| Param | Original file | Final file |
|---|---|---|
| Filename | modeM0/AS1A07_112T01_9000003360_22625cztM0_level2.evt | modeM0/AS1A07_112T01_9000003360_22625cztM0_level2_quad_clean.evt |
| Size (bytes) | 535,032,000 | 65,977,920 |
| Size | 510.2 MB | 62.9 MB |
| Events in quadrant A | 3,156,431 | 398,985 |
| Events in quadrant B | 3,462,548 | 402,806 |
| Events in quadrant C | 3,235,639 | 392,618 |
| Events in quadrant D | 5,938,031 | 380,017 |
| Mode M9 | |||
|---|---|---|---|
| Quadrant | BADHDUFLAG | Total packets | Discarded packets |
| A | 0 | 13 | 0 |
| B | 0 | 13 | 0 |
| C | 0 | 13 | 0 |
| D | 0 | 13 | 0 |
| Mode M0 | |||
|---|---|---|---|
| Quadrant | BADHDUFLAG | Total packets | Discarded packets |
| A | 0 | 12981 | 1 |
| B | 0 | 14013 | 1 |
| C | 0 | 13207 | 1 |
| D | 0 | 21709 | 2 |
| Mode SS | |||
|---|---|---|---|
| Quadrant | BADHDUFLAG | Total packets | Discarded packets |
| A | 0 | 122 | 0 |
| B | 0 | 122 | 0 |
| C | 0 | 122 | 0 |
| D | 0 | 122 | 0 |
| Quadrant | Total seconds | Saturated seconds | Saturation percentage |
|---|---|---|---|
| A | 6063 | 91 | 1.500907% |
| B | 6063 | 116 | 1.913244% |
| C | 6063 | 150 | 2.474023% |
| D | 6063 | 882 | 14.547254% |
Noise dominated data is calculated using 1-second bins in cleaned event files. If a bin has >2000 counts, and if more than 50% of those come from <1% of pixels, then it is considered to be noise-dominated and hence unusable.
| Quadrant | # 1 sec bins | Bins with >0 counts | Bins with >2000 counts | High rate bins dominated by noise | Noise dominated (total time) | Noise dominated (detector-on time) | Marked lightcurve |
|---|---|---|---|---|---|---|---|
| A | 7308 | 6065 | 0 | 0 | 0.00% | 0.00% | 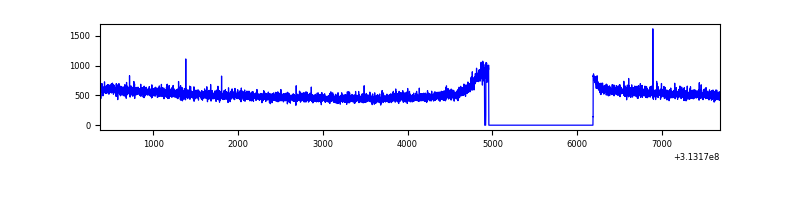 |
| B | 7308 | 6065 | 2 | 2 | 0.03% | 0.03% | 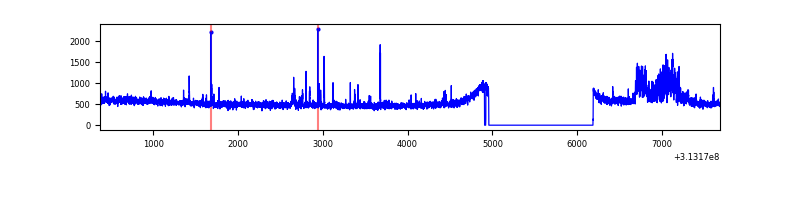 |
| C | 7308 | 6065 | 0 | 0 | 0.00% | 0.00% | 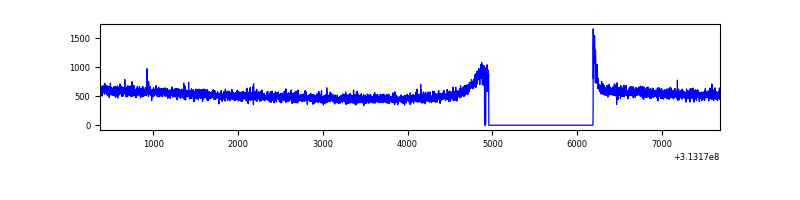 |
| D | 7308 | 6065 | 676 | 676 | 9.25% | 11.15% | 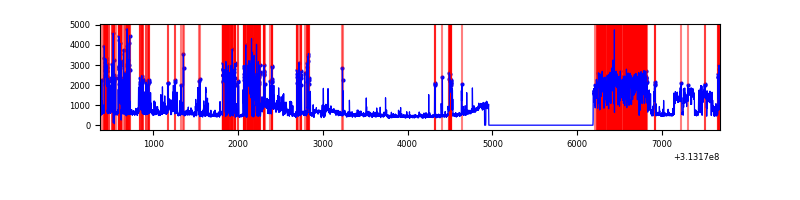 |
Top three noisy pixels from each quadrant. If the there are fewer than three noisy pixels in the level2.evt file, extra rows are filled as -1
| Pixel properties | Quadrant properties | ||||||
|---|---|---|---|---|---|---|---|
| Quadrant | DetID | PixID | Counts | Sigma | Mean | Median | Sigma |
| A | 13 | 254 | 9784 | 55.09 | 817 | 801 | 163.1 |
| A | 11 | 47 | 9115 | 50.99 | 817 | 801 | 163.1 |
| A | 0 | 226 | 7153 | 38.96 | 817 | 801 | 163.1 |
| B | 0 | 190 | 233676 | 1519.65 | 810 | 792 | 153.2 |
| B | 0 | 197 | 21204 | 133.2 | 810 | 792 | 153.2 |
| B | 12 | 111 | 17570 | 109.48 | 810 | 792 | 153.2 |
| C | 14 | 238 | 124108 | 672.36 | 792 | 797 | 183.4 |
| C | 0 | 10 | 22210 | 116.75 | 792 | 797 | 183.4 |
| C | 13 | 61 | 5623 | 26.31 | 792 | 797 | 183.4 |
| D | 1 | 52 | 1921718 | 10409.19 | 766 | 747 | 184.5 |
| D | 1 | 239 | 997026 | 5398.55 | 766 | 747 | 184.5 |
| D | 13 | 249 | 84080 | 451.56 | 766 | 747 | 184.5 |
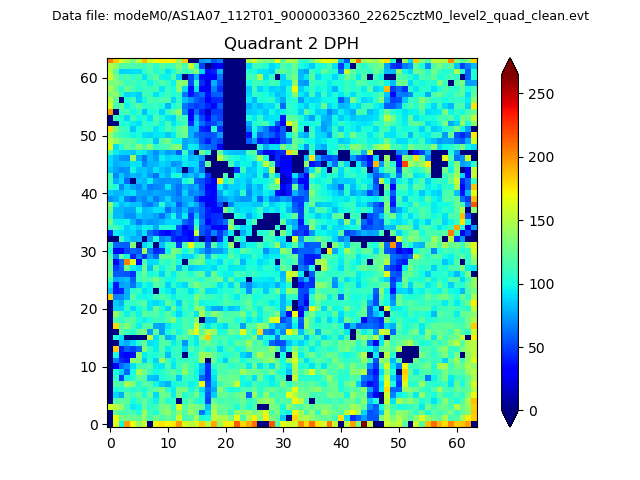
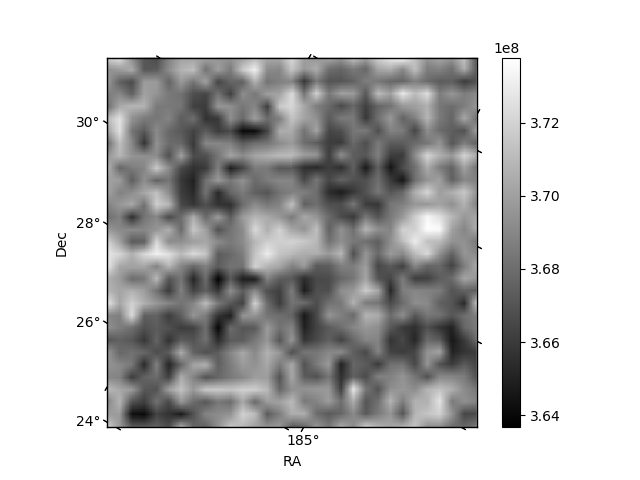
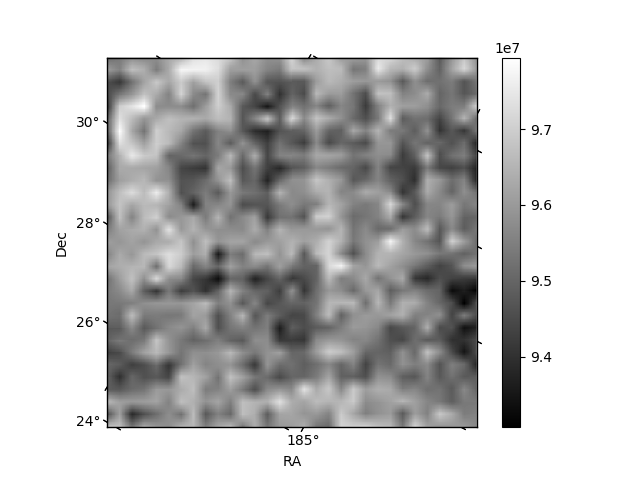
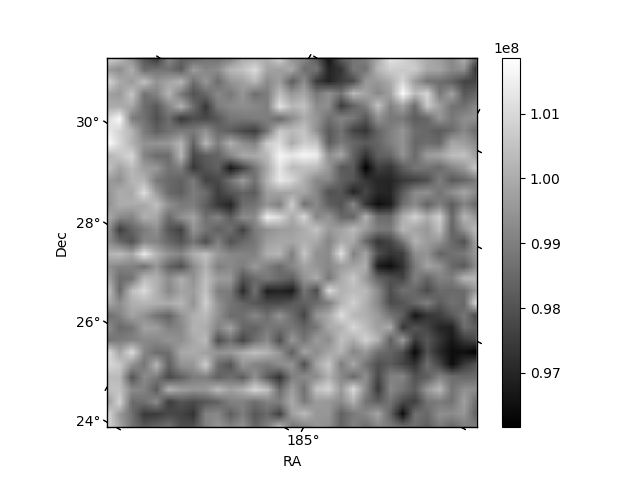
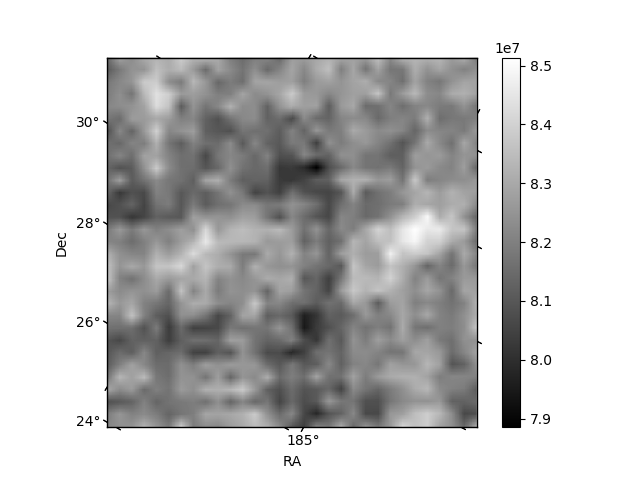
Histogram calculated using DETX and DETY for each event in the final _common_clean file
| Quadrant A | 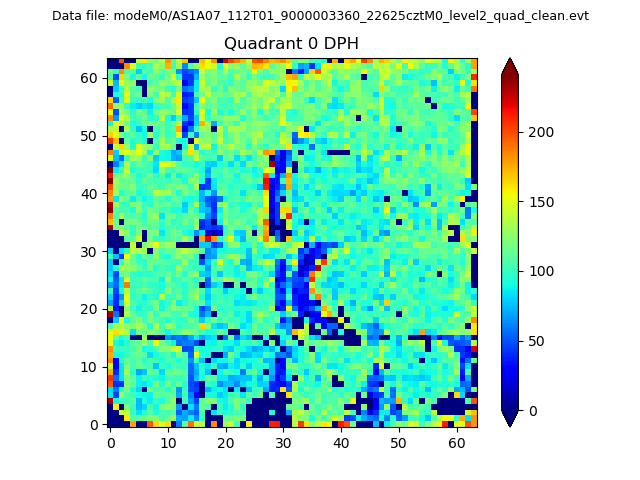 |
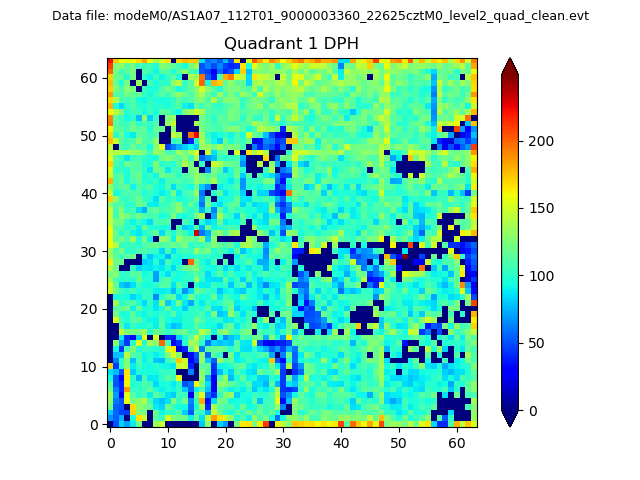 |
Quadrant B |
|---|---|---|---|
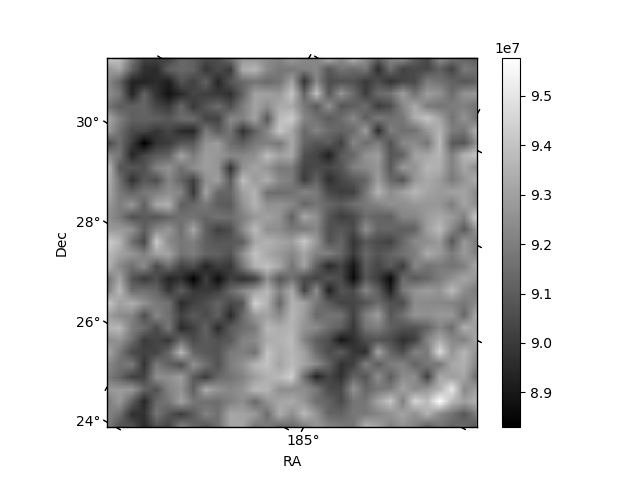
| Quadrant D | 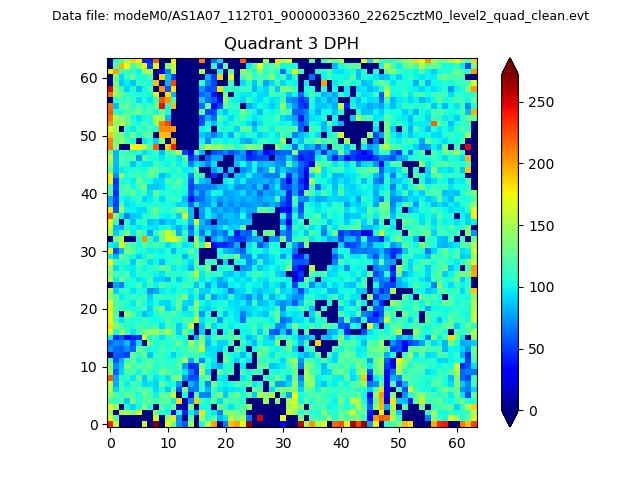 |
 |
Quadrant C |
| Plot type | Count rate plots | Images |
|---|---|---|
| Comparison with Poisson distribution Blue bars denote a histogram of data divided into 1 sec bins. Red curve is a Poisson curve with rate = median count rate of data. |
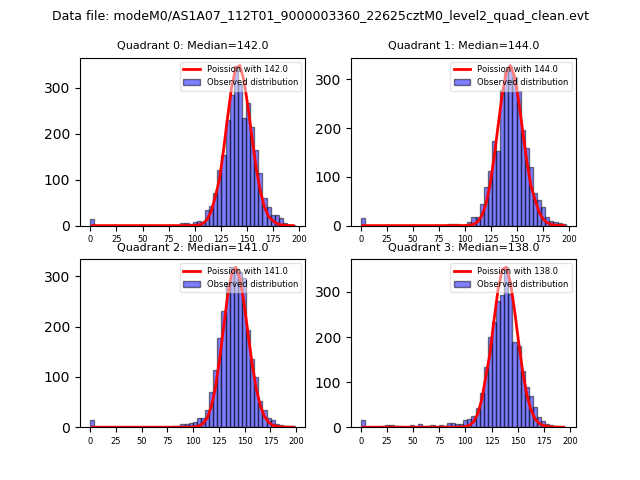 |
 |
| Quadrant-wise count rates Data is divided into 100 sec bins |
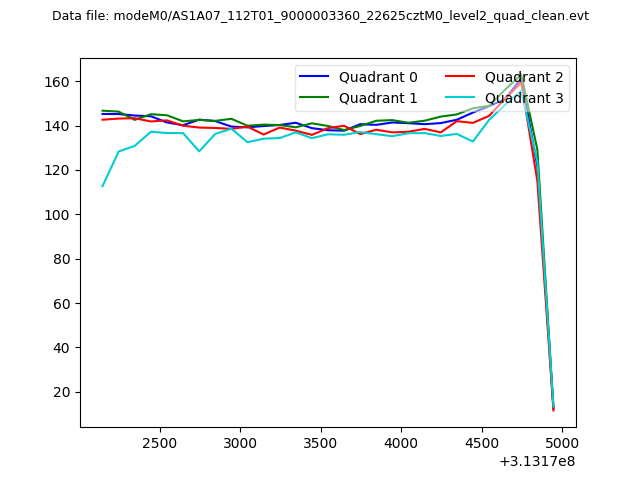 |
|
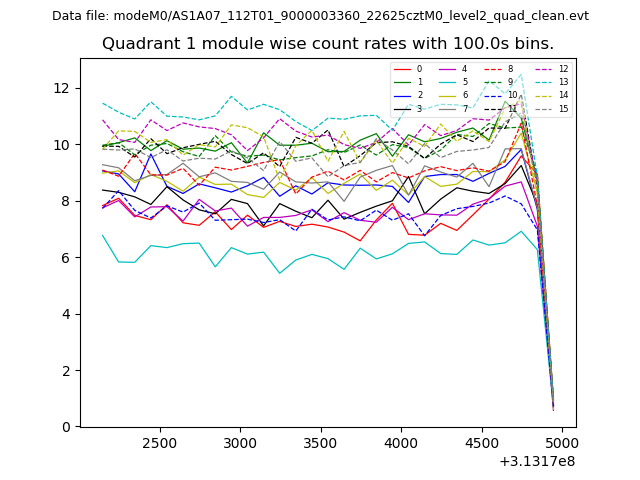
| Module-wise count rates for Quadrant A Data is divided into 100 sec bins |
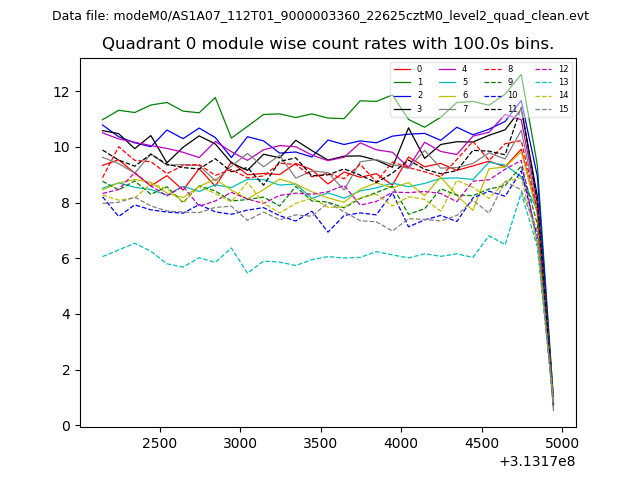 |
 |
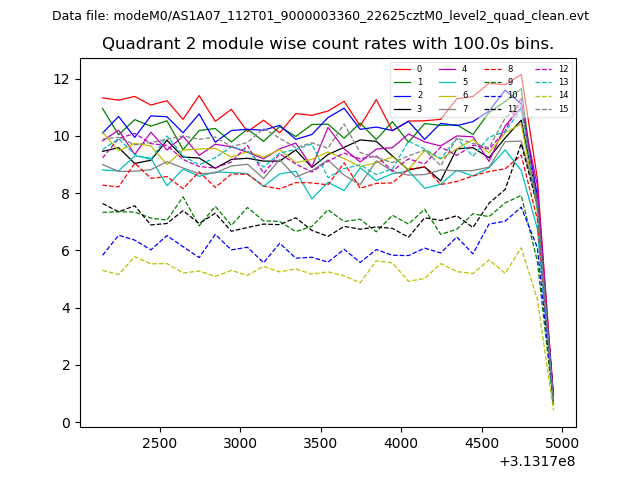
| Module-wise count rates for Quadrant B Data is divided into 100 sec bins |
 |
 |
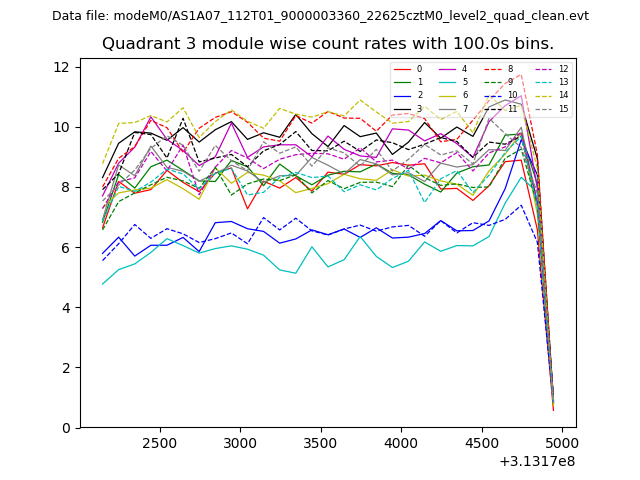
| Module-wise count rates for Quadrant C Data is divided into 100 sec bins |
 |
 |
| Module-wise count rates for Quadrant D Data is divided into 100 sec bins |
 |
 |
| Parameter | Plot |
|---|---|
| CZT HV Monitor | 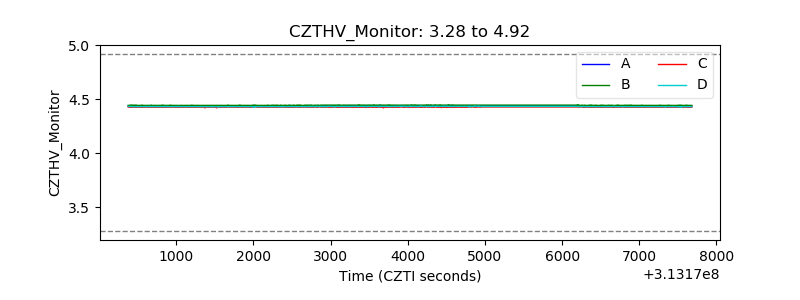 |
| D_VDD | 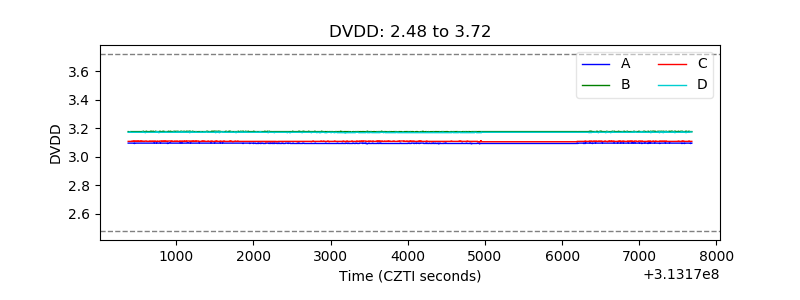 |
| Temperature 1 | 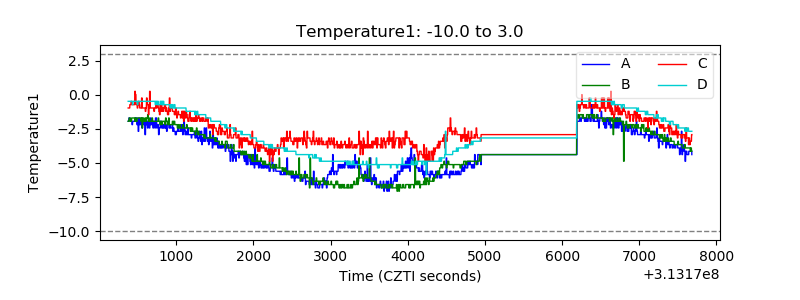 |
| Veto HV Monitor | 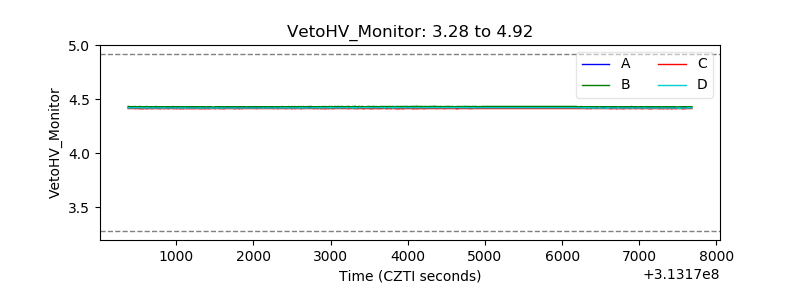 |
| Veto LLD | 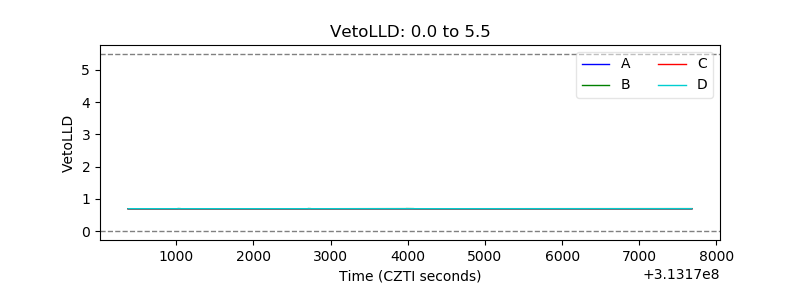 |
| Alpha Counter | 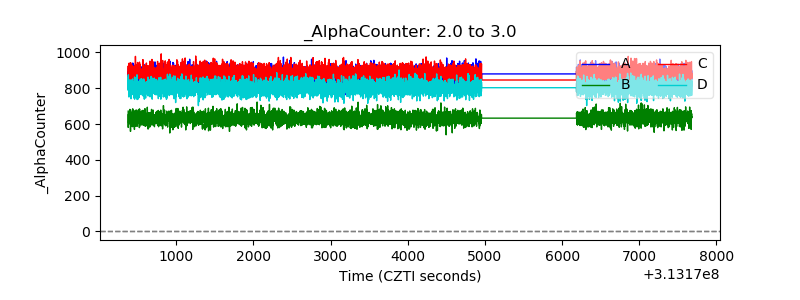 |
| _CPM_Rate | 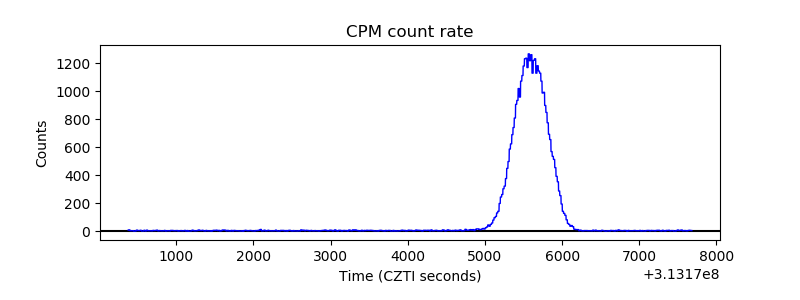 |
| CZT Counter | 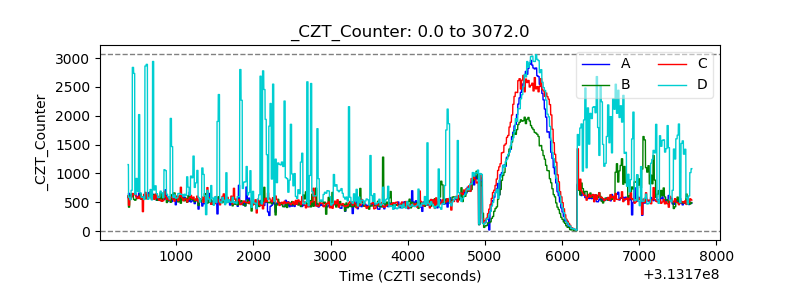 |
| +2.5 Volts monitor |  |
| +5 Volts monitor |  |
| _ROLL_ROT | 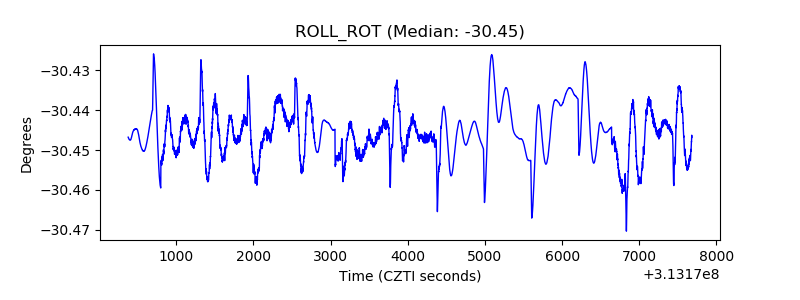 |
| _Roll_DEC | 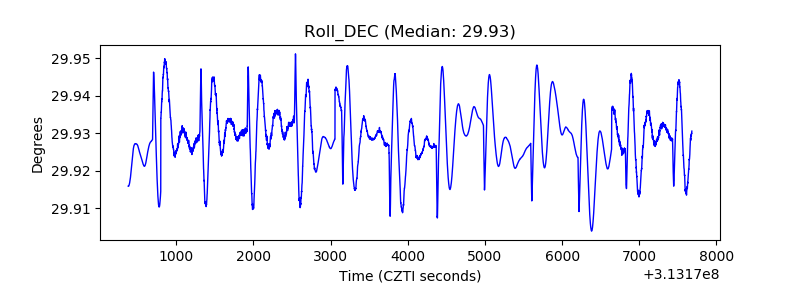 |
| _Roll_RA | 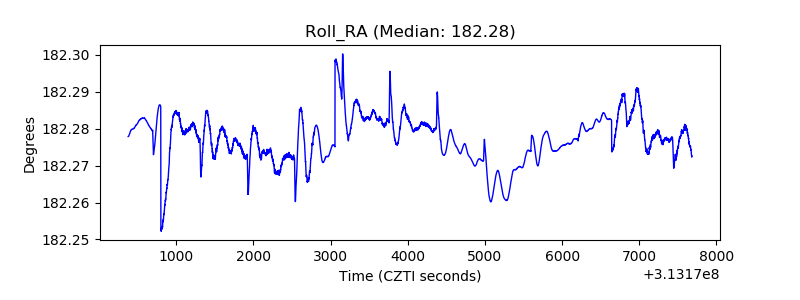 |
| Veto Counter | 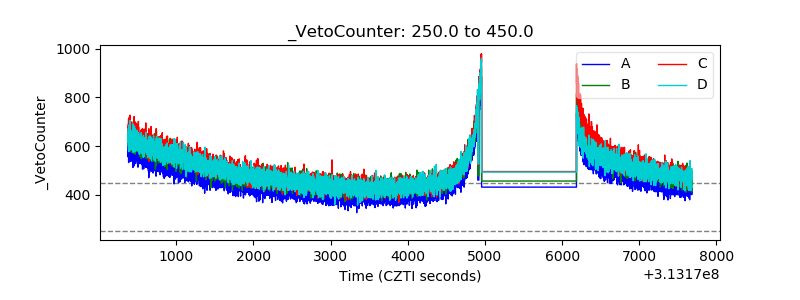 |