| Param | Original file | Final file |
|---|---|---|
| Filename | modeM0/AS1A07_112T01_9000003360_22626cztM0_level2.evt | modeM0/AS1A07_112T01_9000003360_22626cztM0_level2_quad_clean.evt |
| Size (bytes) | 514,584,000 | 75,119,040 |
| Size | 490.7 MB | 71.6 MB |
| Events in quadrant A | 2,992,171 | 469,183 |
| Events in quadrant B | 3,239,024 | 474,709 |
| Events in quadrant C | 3,076,055 | 463,143 |
| Events in quadrant D | 5,866,437 | 444,704 |
| Mode M9 | |||
|---|---|---|---|
| Quadrant | BADHDUFLAG | Total packets | Discarded packets |
| A | 0 | 10 | 0 |
| B | 0 | 10 | 0 |
| C | 0 | 10 | 0 |
| D | 0 | 10 | 0 |
| Mode M0 | |||
|---|---|---|---|
| Quadrant | BADHDUFLAG | Total packets | Discarded packets |
| A | 0 | 12597 | 1 |
| B | 0 | 13438 | 1 |
| C | 0 | 12763 | 1 |
| D | 0 | 21592 | 1 |
| Mode SS | |||
|---|---|---|---|
| Quadrant | BADHDUFLAG | Total packets | Discarded packets |
| A | 0 | 122 | 0 |
| B | 0 | 122 | 0 |
| C | 0 | 122 | 0 |
| D | 0 | 122 | 0 |
| Quadrant | Total seconds | Saturated seconds | Saturation percentage |
|---|---|---|---|
| A | 6057 | 82 | 1.353806% |
| B | 6057 | 104 | 1.717022% |
| C | 6058 | 140 | 2.310994% |
| D | 6058 | 655 | 10.812149% |
Noise dominated data is calculated using 1-second bins in cleaned event files. If a bin has >2000 counts, and if more than 50% of those come from <1% of pixels, then it is considered to be noise-dominated and hence unusable.
| Quadrant | # 1 sec bins | Bins with >0 counts | Bins with >2000 counts | High rate bins dominated by noise | Noise dominated (total time) | Noise dominated (detector-on time) | Marked lightcurve |
|---|---|---|---|---|---|---|---|
| A | 7037 | 6058 | 0 | 0 | 0.00% | 0.00% | 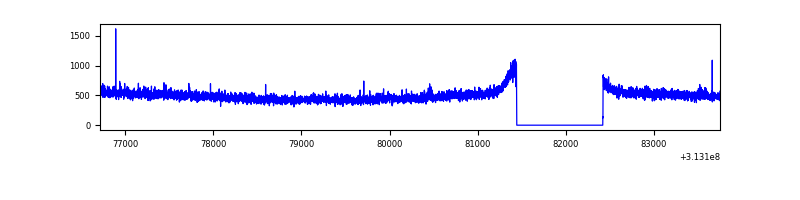 |
| B | 7037 | 6058 | 0 | 0 | 0.00% | 0.00% | 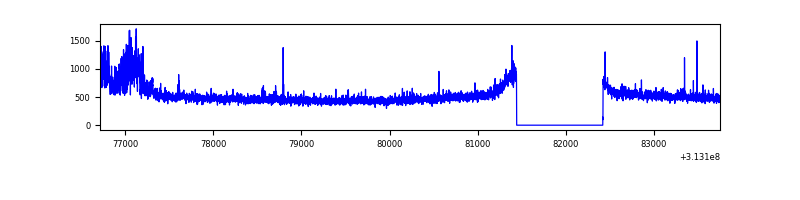 |
| C | 7038 | 6059 | 0 | 0 | 0.00% | 0.00% | 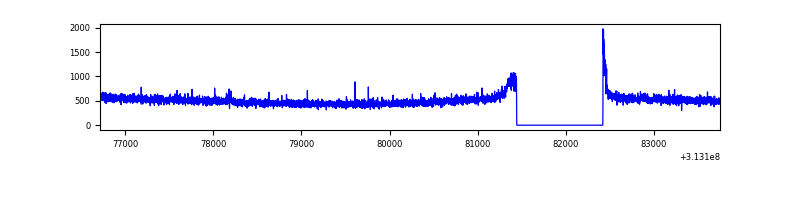 |
| D | 7038 | 6059 | 521 | 521 | 7.40% | 8.60% | 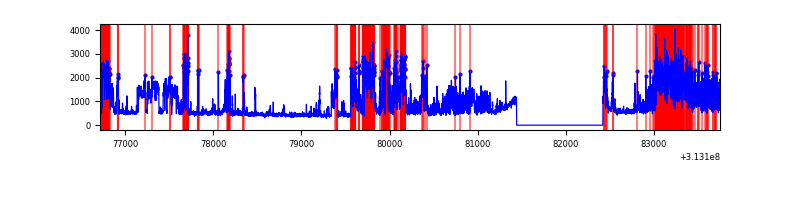 |
Top three noisy pixels from each quadrant. If the there are fewer than three noisy pixels in the level2.evt file, extra rows are filled as -1
| Pixel properties | Quadrant properties | ||||||
|---|---|---|---|---|---|---|---|
| Quadrant | DetID | PixID | Counts | Sigma | Mean | Median | Sigma |
| A | 11 | 47 | 15994 | 97.8 | 771 | 755 | 155.8 |
| A | 13 | 254 | 10287 | 61.18 | 771 | 755 | 155.8 |
| A | 0 | 226 | 6829 | 38.98 | 771 | 755 | 155.8 |
| B | 0 | 190 | 207315 | 1403.79 | 769 | 751 | 147.1 |
| B | 12 | 111 | 17433 | 113.37 | 769 | 751 | 147.1 |
| B | 11 | 111 | 15109 | 97.58 | 769 | 751 | 147.1 |
| C | 14 | 238 | 119076 | 679.06 | 748 | 753 | 174.2 |
| C | 0 | 10 | 29802 | 166.71 | 748 | 753 | 174.2 |
| C | 10 | 22 | 5650 | 28.1 | 748 | 753 | 174.2 |
| D | 1 | 52 | 1665334 | 9196.93 | 741 | 719 | 181.0 |
| D | 1 | 239 | 1246704 | 6884.02 | 741 | 719 | 181.0 |
| D | 10 | 230 | 58877 | 321.32 | 741 | 719 | 181.0 |
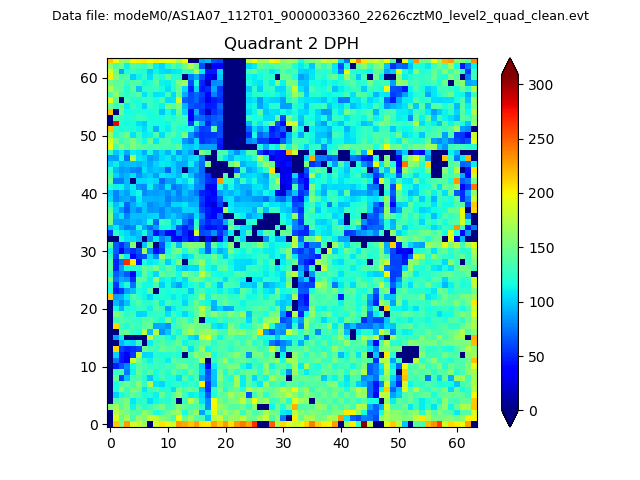
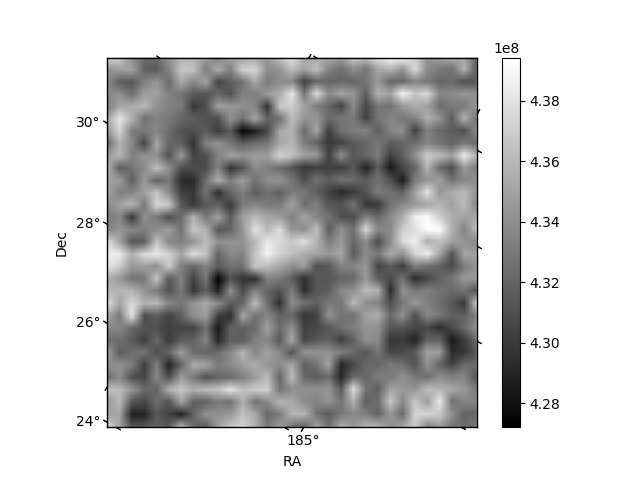
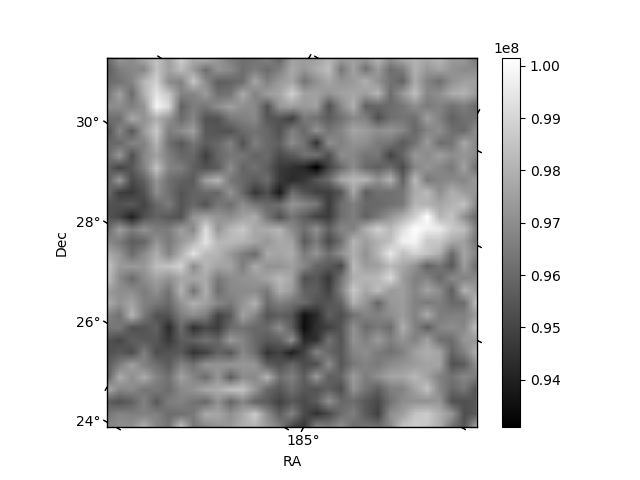
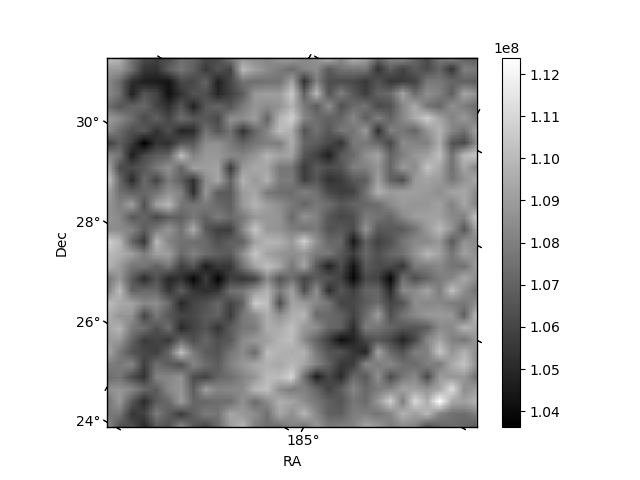
Histogram calculated using DETX and DETY for each event in the final _common_clean file
| Quadrant A | 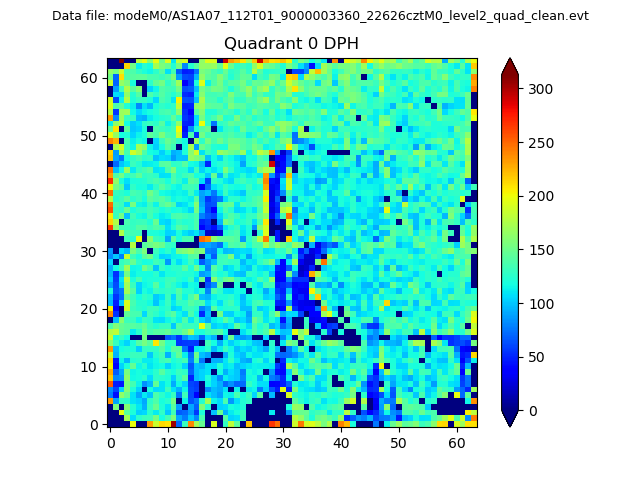 |
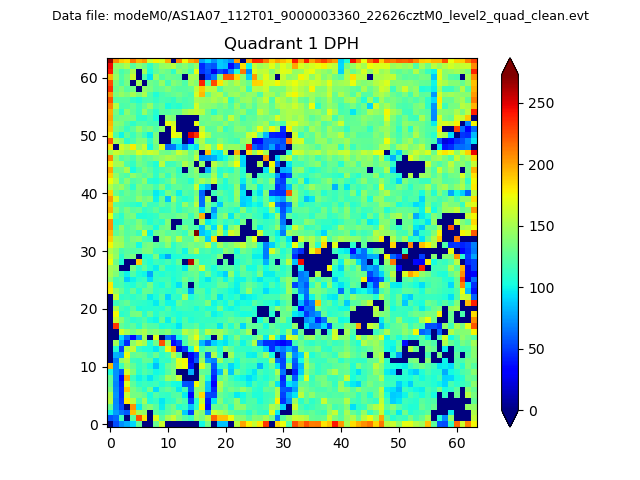 |
Quadrant B |
|---|---|---|---|
| Quadrant D | 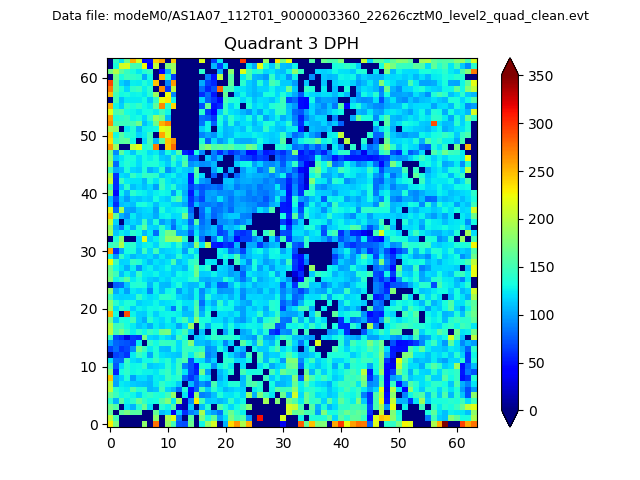 |
 |
Quadrant C |
| Plot type | Count rate plots | Images |
|---|---|---|
| Comparison with Poisson distribution Blue bars denote a histogram of data divided into 1 sec bins. Red curve is a Poisson curve with rate = median count rate of data. |
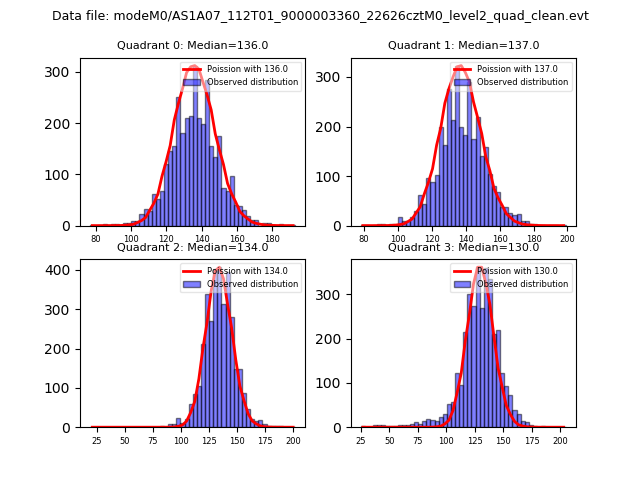 |
 |
| Quadrant-wise count rates Data is divided into 100 sec bins |
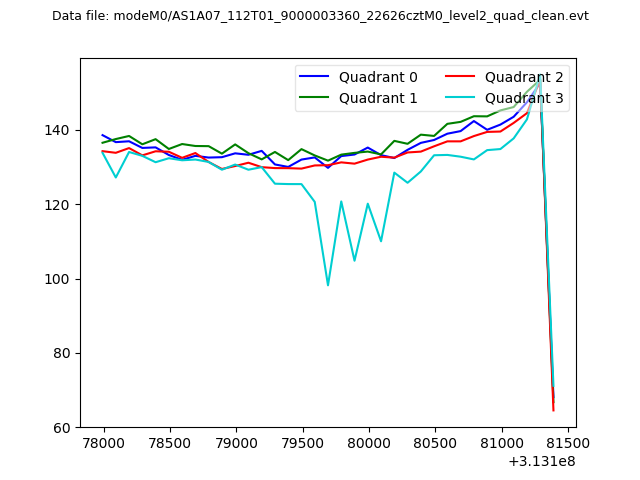 |
|
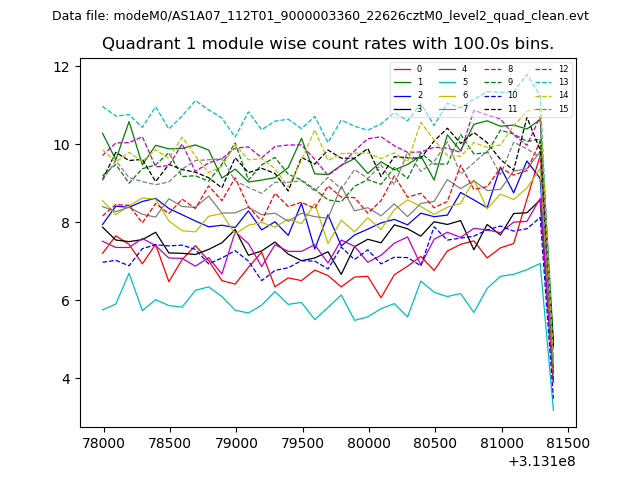
| Module-wise count rates for Quadrant A Data is divided into 100 sec bins |
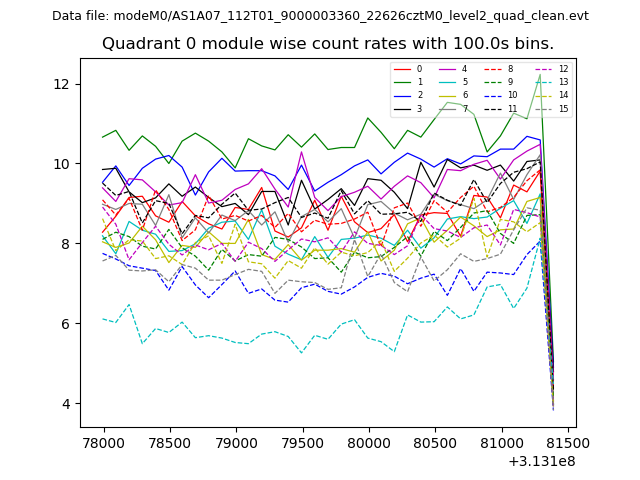 |
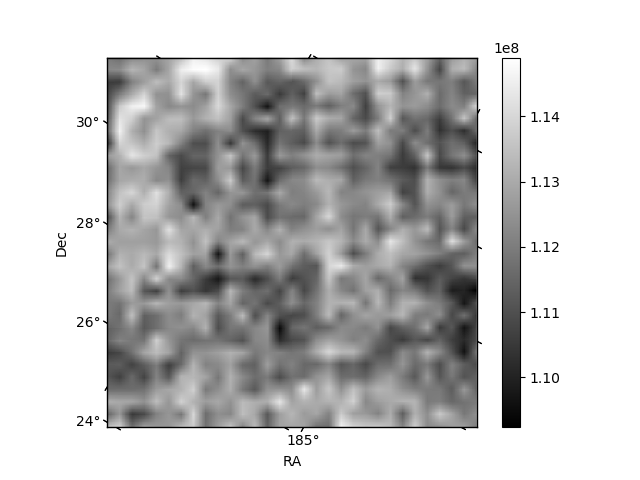 |
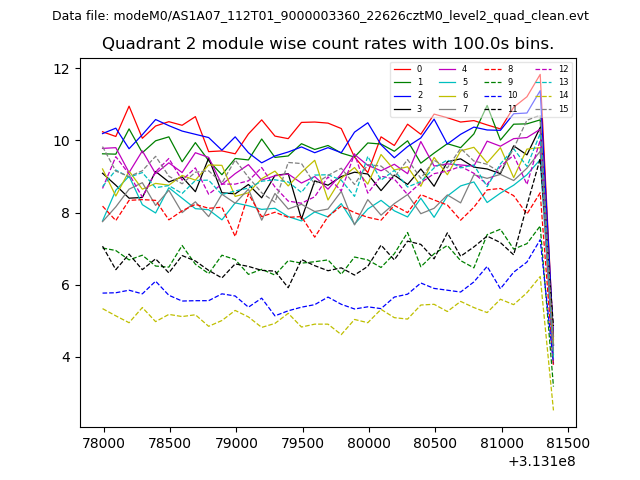
| Module-wise count rates for Quadrant B Data is divided into 100 sec bins |
 |
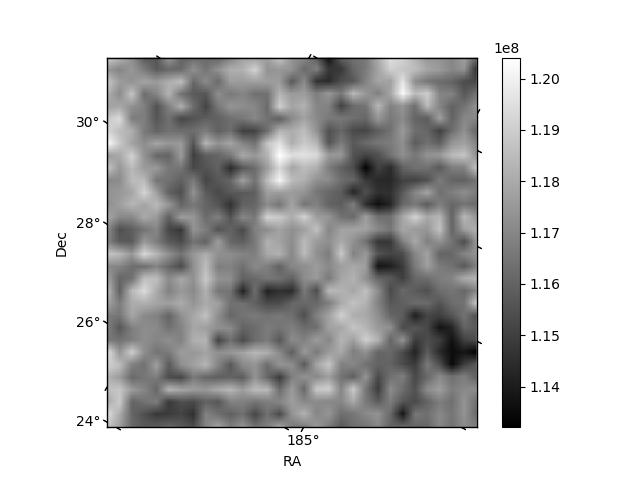 |
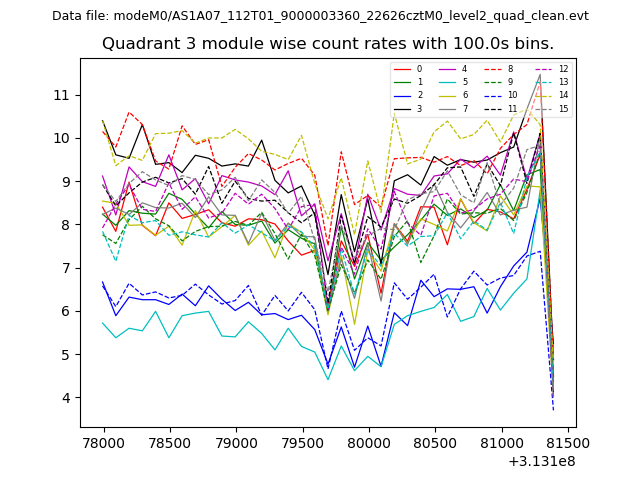
| Module-wise count rates for Quadrant C Data is divided into 100 sec bins |
 |
 |
| Module-wise count rates for Quadrant D Data is divided into 100 sec bins |
 |
 |
| Parameter | Plot |
|---|---|
| CZT HV Monitor | 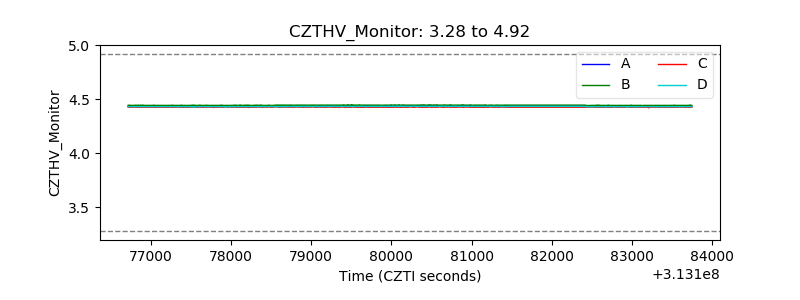 |
| D_VDD | 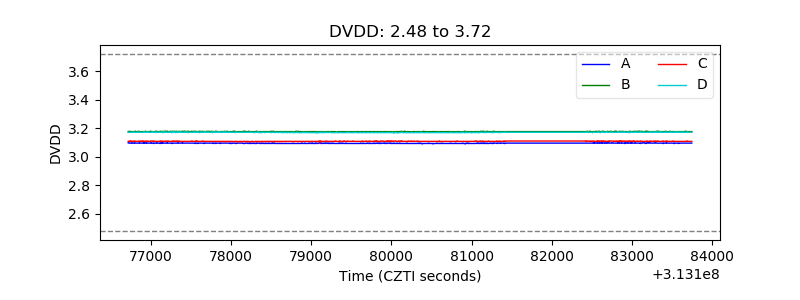 |
| Temperature 1 | 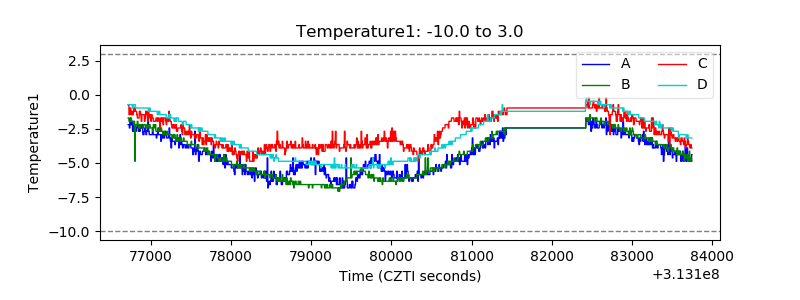 |
| Veto HV Monitor | 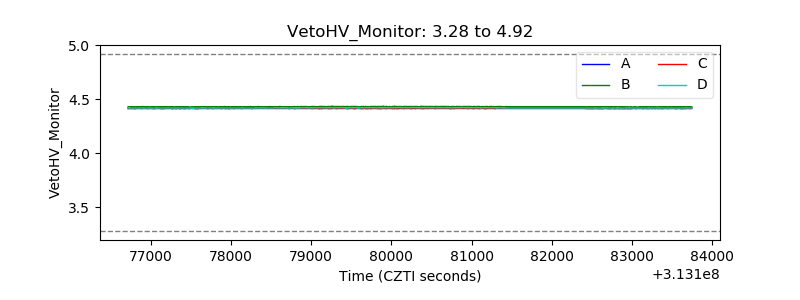 |
| Veto LLD | 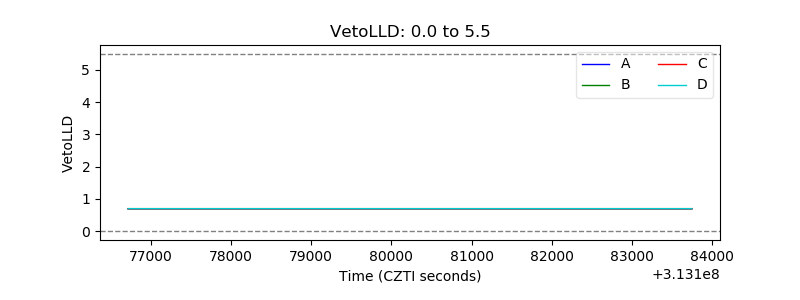 |
| Alpha Counter | 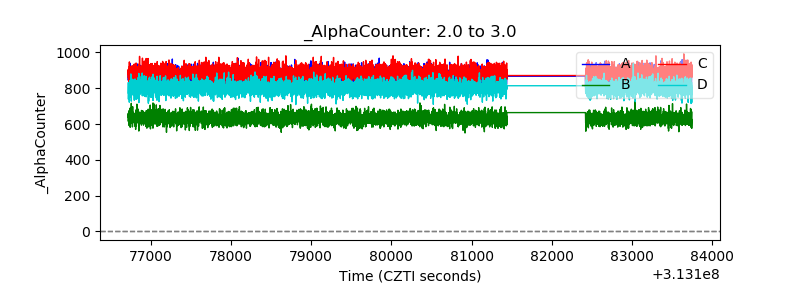 |
| _CPM_Rate | 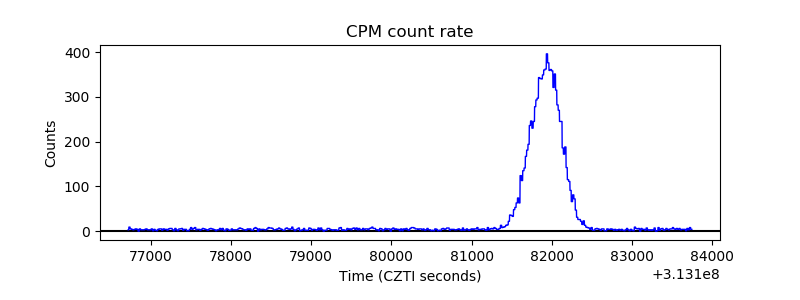 |
| CZT Counter | 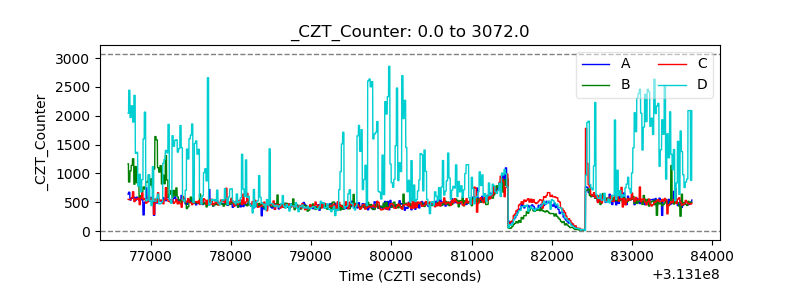 |
| +2.5 Volts monitor |  |
| +5 Volts monitor |  |
| _ROLL_ROT | 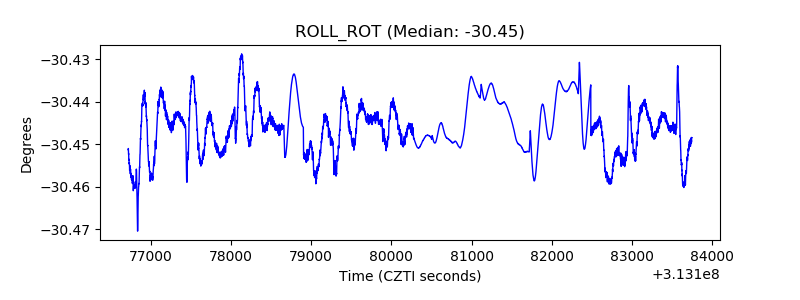 |
| _Roll_DEC | 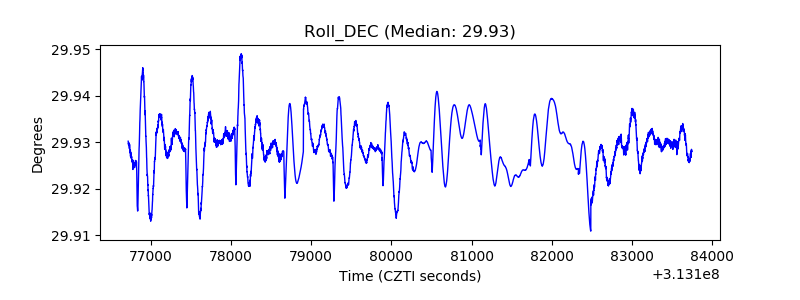 |
| _Roll_RA | 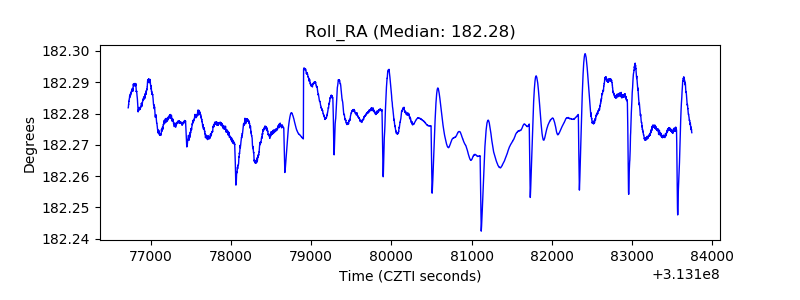 |
| Veto Counter | 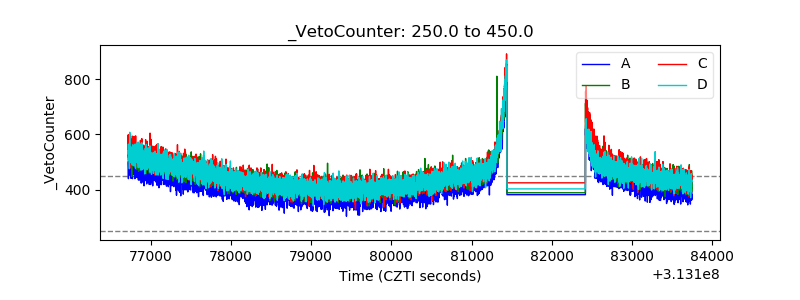 |