| Param | Original file | Final file |
|---|---|---|
| Filename | modeM0/AS1A07_112T01_9000003360_22627cztM0_level2.evt | modeM0/AS1A07_112T01_9000003360_22627cztM0_level2_quad_clean.evt |
| Size (bytes) | 611,550,720 | 84,847,680 |
| Size | 583.2 MB | 80.9 MB |
| Events in quadrant A | 3,391,090 | 531,500 |
| Events in quadrant B | 3,602,239 | 531,390 |
| Events in quadrant C | 3,505,242 | 523,727 |
| Events in quadrant D | 7,543,428 | 490,851 |
| Mode M9 | |||
|---|---|---|---|
| Quadrant | BADHDUFLAG | Total packets | Discarded packets |
| A | 0 | 15 | 0 |
| B | 0 | 16 | 0 |
| C | 0 | 16 | 0 |
| D | 0 | 16 | 0 |
| Mode M0 | |||
|---|---|---|---|
| Quadrant | BADHDUFLAG | Total packets | Discarded packets |
| A | 0 | 14568 | 2 |
| B | 0 | 15154 | 2 |
| C | 0 | 14774 | 2 |
| D | 0 | 27285 | 4 |
| Mode SS | |||
|---|---|---|---|
| Quadrant | BADHDUFLAG | Total packets | Discarded packets |
| A | 0 | 144 | 0 |
| B | 0 | 146 | 0 |
| C | 0 | 146 | 0 |
| D | 0 | 146 | 0 |
| Quadrant | Total seconds | Saturated seconds | Saturation percentage |
|---|---|---|---|
| A | 7058 | 50 | 0.708416% |
| B | 7058 | 113 | 1.601020% |
| C | 7058 | 142 | 2.011901% |
| D | 7057 | 1426 | 20.206887% |
Noise dominated data is calculated using 1-second bins in cleaned event files. If a bin has >2000 counts, and if more than 50% of those come from <1% of pixels, then it is considered to be noise-dominated and hence unusable.
| Quadrant | # 1 sec bins | Bins with >0 counts | Bins with >2000 counts | High rate bins dominated by noise | Noise dominated (total time) | Noise dominated (detector-on time) | Marked lightcurve |
|---|---|---|---|---|---|---|---|
| A | 7683 | 7059 | 0 | 0 | 0.00% | 0.00% | 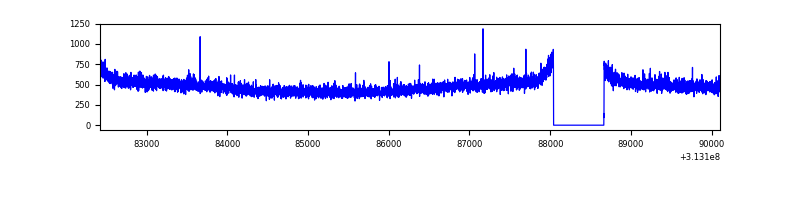 |
| B | 7683 | 7059 | 40 | 40 | 0.52% | 0.57% | 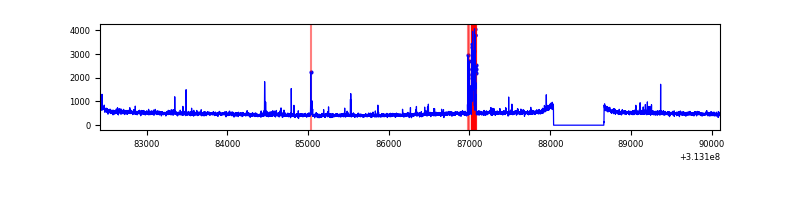 |
| C | 7683 | 7059 | 1 | 1 | 0.01% | 0.01% | 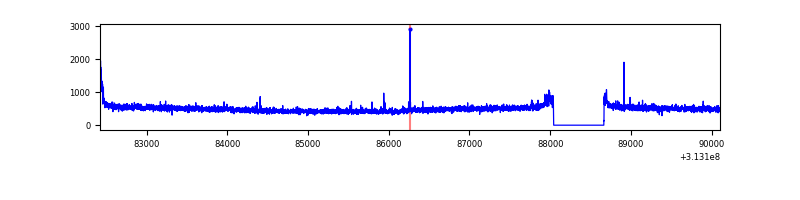 |
| D | 7682 | 7058 | 826 | 826 | 10.75% | 11.70% | 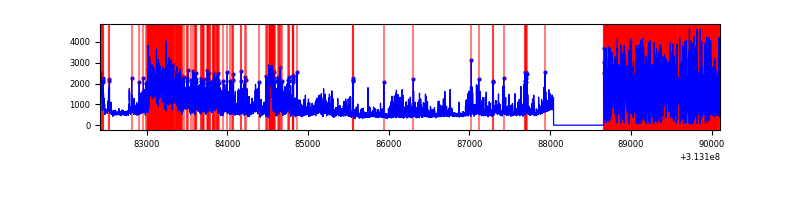 |
Top three noisy pixels from each quadrant. If the there are fewer than three noisy pixels in the level2.evt file, extra rows are filled as -1
| Pixel properties | Quadrant properties | ||||||
|---|---|---|---|---|---|---|---|
| Quadrant | DetID | PixID | Counts | Sigma | Mean | Median | Sigma |
| A | 13 | 254 | 12362 | 64.87 | 877 | 857 | 177.4 |
| A | 11 | 47 | 8855 | 45.1 | 877 | 857 | 177.4 |
| A | 3 | 137 | 7533 | 37.64 | 877 | 857 | 177.4 |
| B | 10 | 247 | 139662 | 847.12 | 866 | 843 | 163.9 |
| B | 12 | 111 | 19575 | 114.31 | 866 | 843 | 163.9 |
| B | 4 | 173 | 18907 | 110.23 | 866 | 843 | 163.9 |
| C | 14 | 238 | 134964 | 683.22 | 843 | 850 | 196.3 |
| C | 0 | 10 | 32587 | 161.68 | 843 | 850 | 196.3 |
| C | 9 | 54 | 29019 | 143.5 | 843 | 850 | 196.3 |
| D | 1 | 239 | 3678244 | 19527.08 | 779 | 757 | 188.3 |
| D | 1 | 52 | 728807 | 3865.87 | 779 | 757 | 188.3 |
| D | 10 | 230 | 58769 | 308.04 | 779 | 757 | 188.3 |
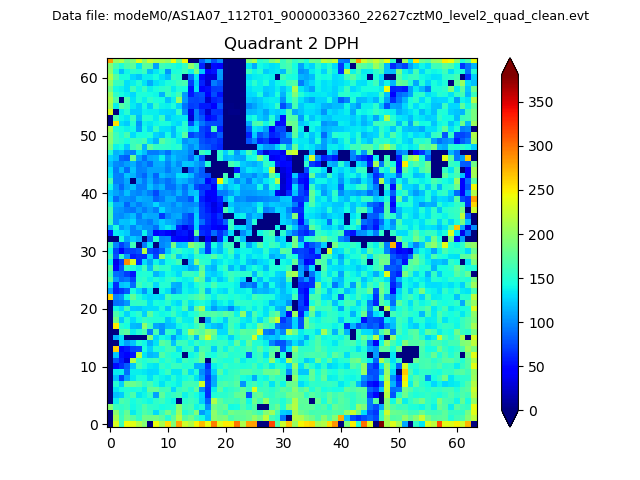
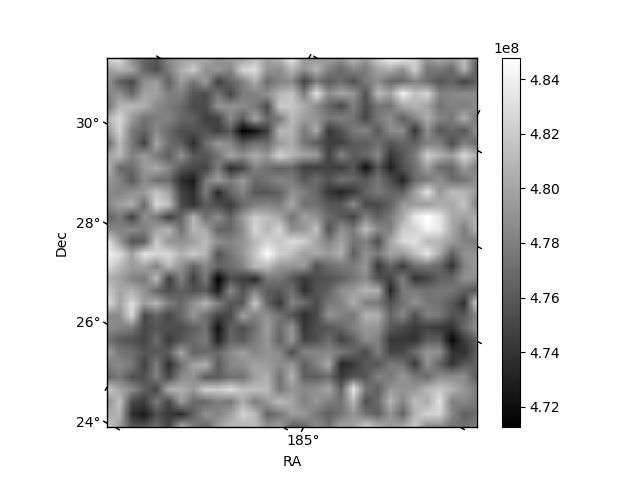
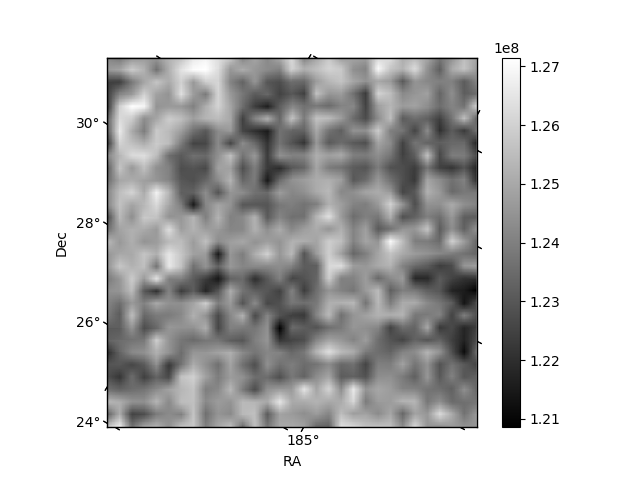
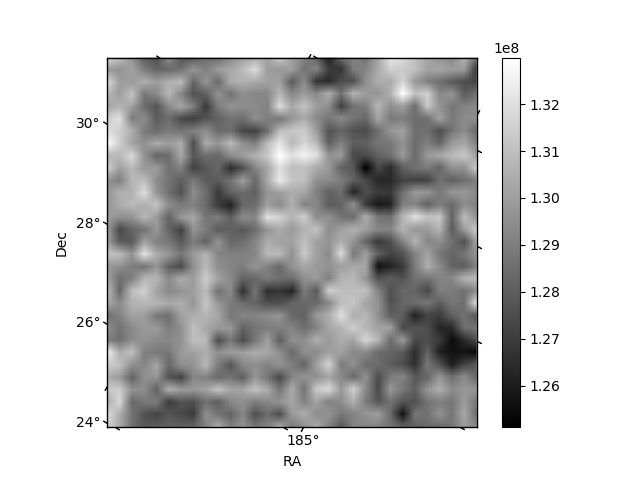
Histogram calculated using DETX and DETY for each event in the final _common_clean file
| Quadrant A | 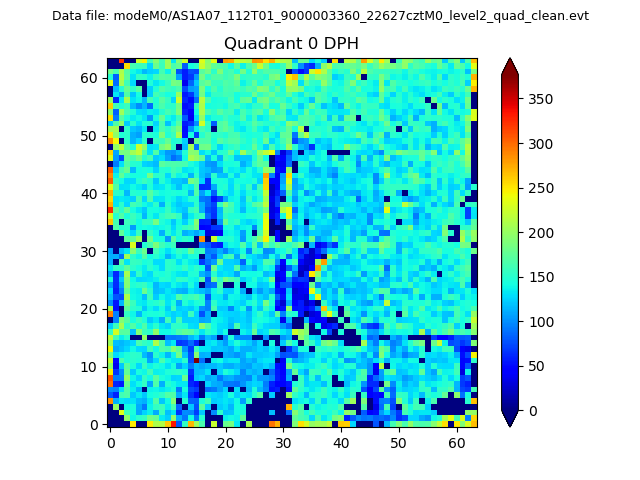 |
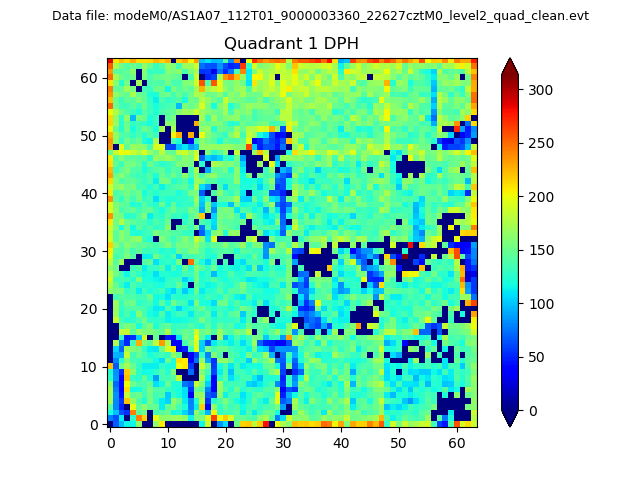 |
Quadrant B |
|---|---|---|---|
| Quadrant D | 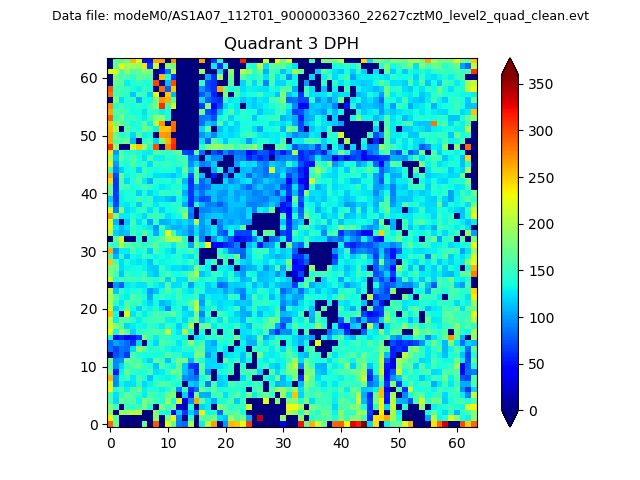 |
 |
Quadrant C |
| Plot type | Count rate plots | Images |
|---|---|---|
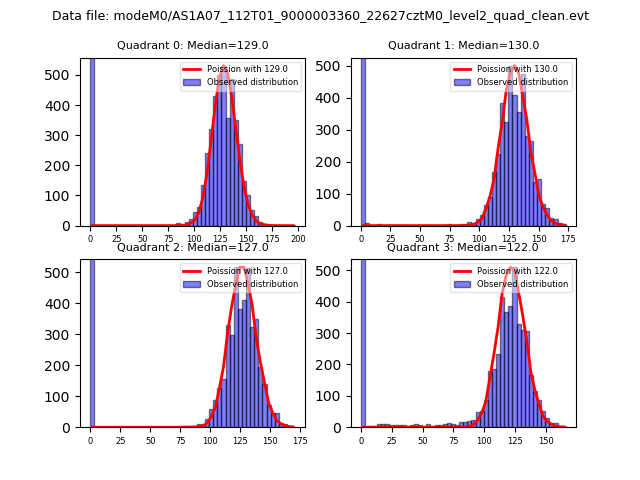
| Comparison with Poisson distribution Blue bars denote a histogram of data divided into 1 sec bins. Red curve is a Poisson curve with rate = median count rate of data. |
 |
 |
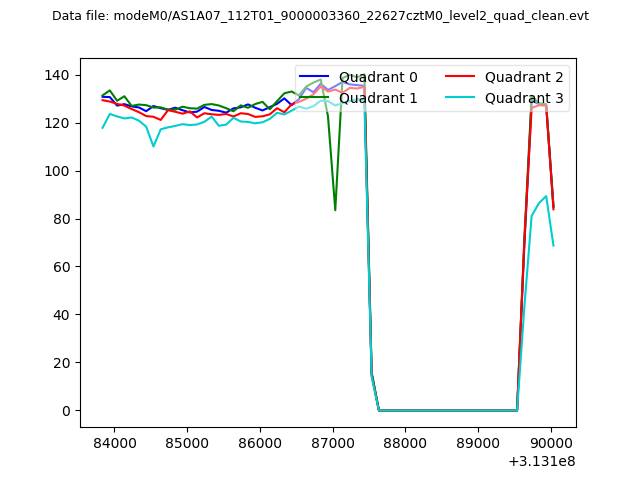
| Quadrant-wise count rates Data is divided into 100 sec bins |
 |
|
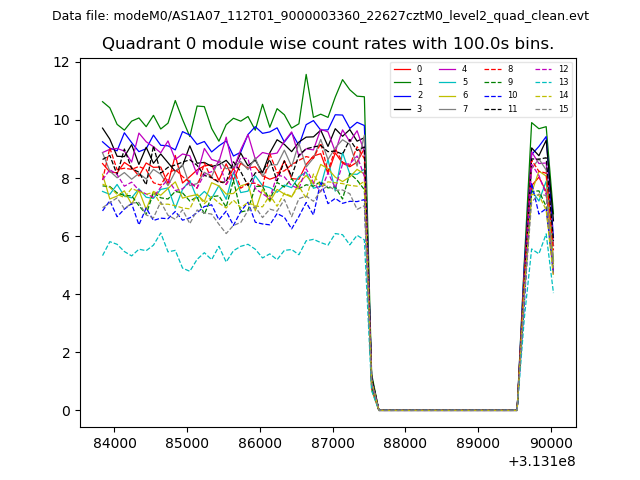
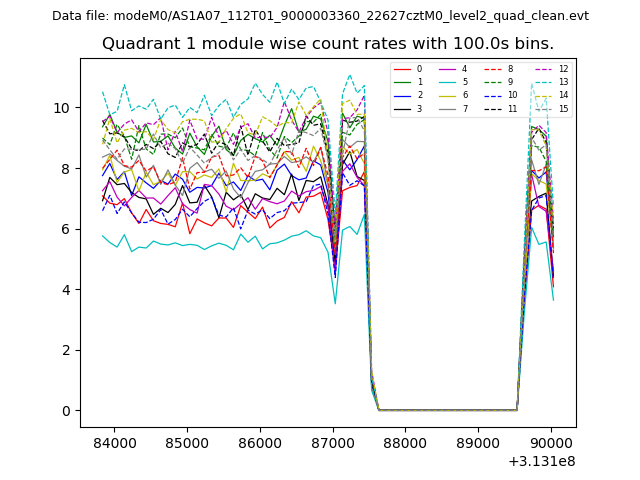
| Module-wise count rates for Quadrant A Data is divided into 100 sec bins |
 |
 |
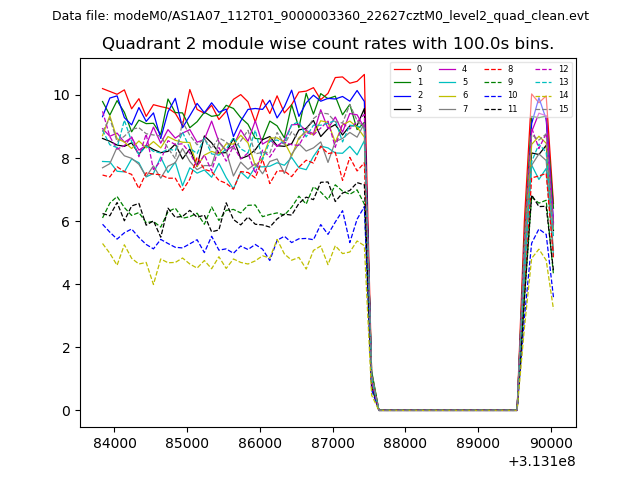
| Module-wise count rates for Quadrant B Data is divided into 100 sec bins |
 |
 |
| Module-wise count rates for Quadrant C Data is divided into 100 sec bins |
 |
 |
| Module-wise count rates for Quadrant D Data is divided into 100 sec bins |
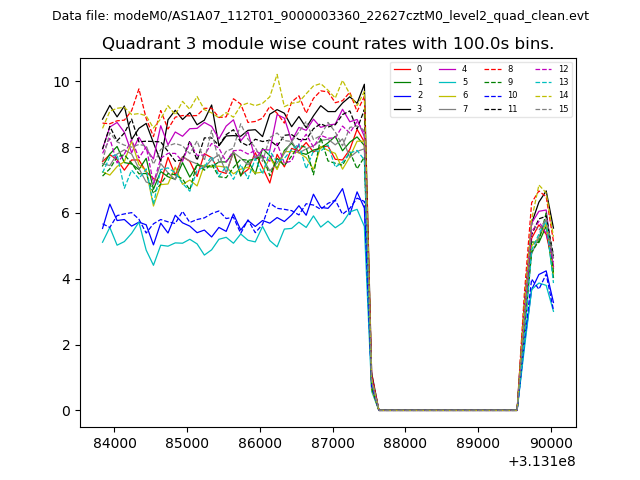 |
 |
| Parameter | Plot |
|---|---|
| CZT HV Monitor | 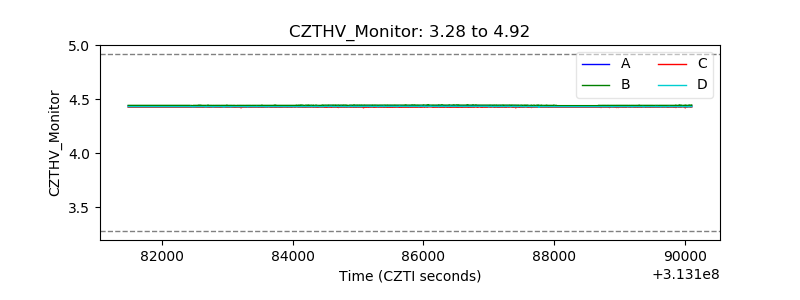 |
| D_VDD | 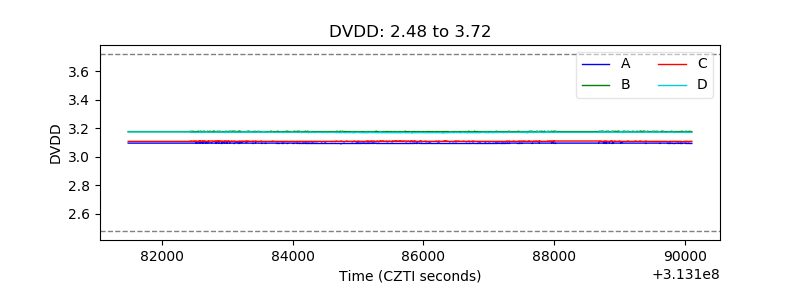 |
| Temperature 1 | 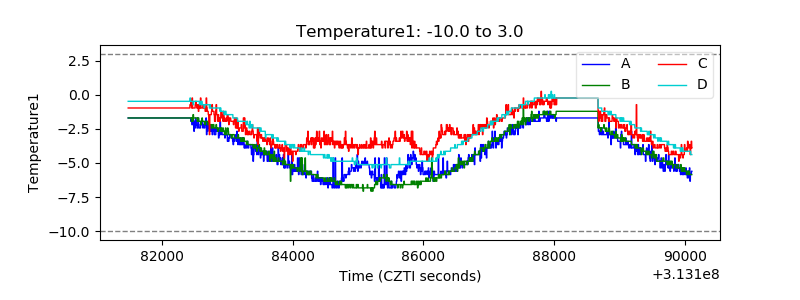 |
| Veto HV Monitor | 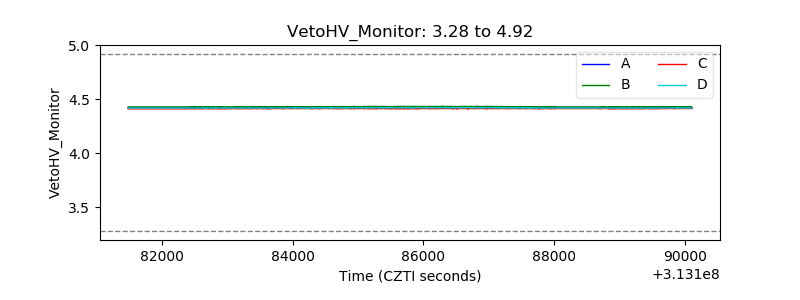 |
| Veto LLD | 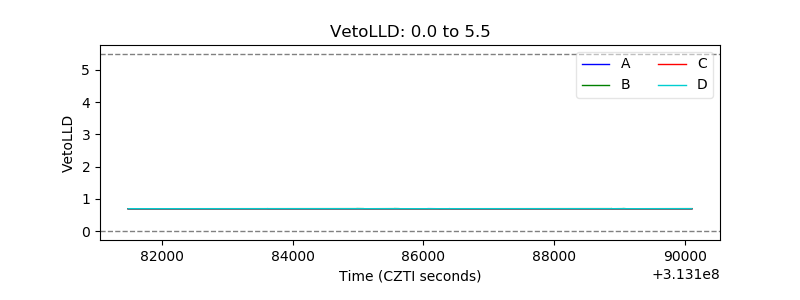 |
| Alpha Counter | 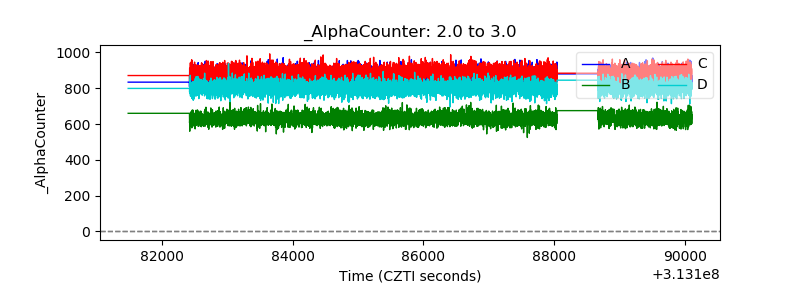 |
| _CPM_Rate | 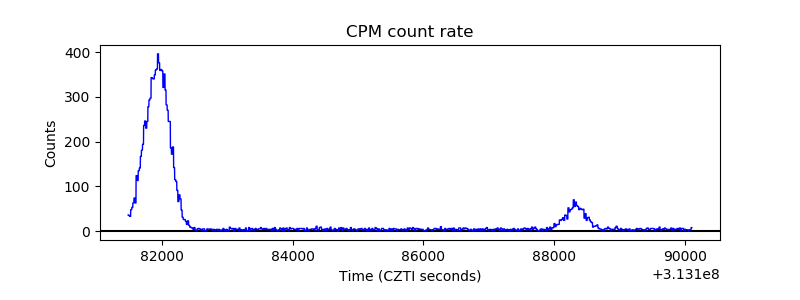 |
| CZT Counter | 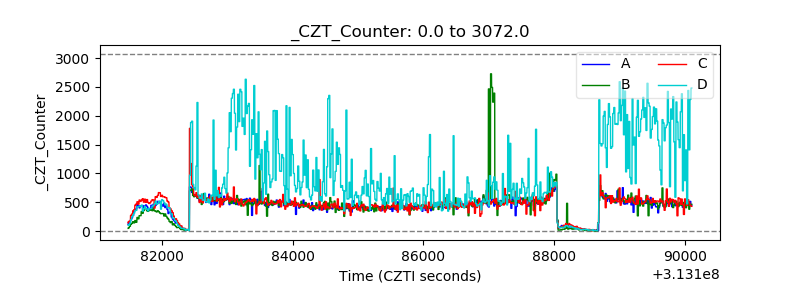 |
| +2.5 Volts monitor |  |
| +5 Volts monitor |  |
| _ROLL_ROT | 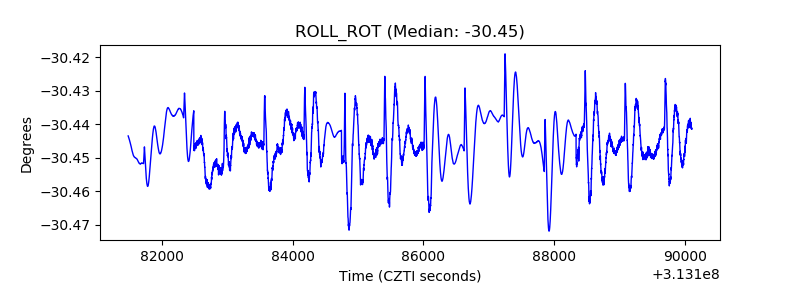 |
| _Roll_DEC | 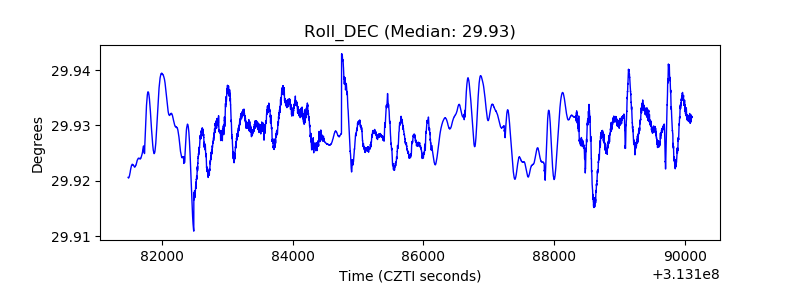 |
| _Roll_RA | 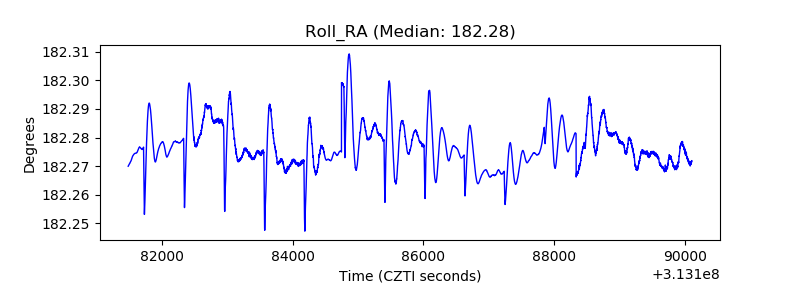 |
| Veto Counter | 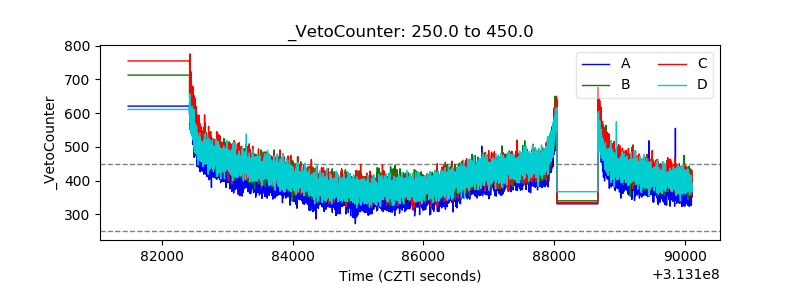 |