| Param | Original file | Final file |
|---|---|---|
| Filename | modeM0/AS1A07_112T01_9000003360_22628cztM0_level2.evt | modeM0/AS1A07_112T01_9000003360_22628cztM0_level2_quad_clean.evt |
| Size (bytes) | 272,459,520 | 24,408,000 |
| Size | 259.8 MB | 23.3 MB |
| Events in quadrant A | 1,304,653 | 148,960 |
| Events in quadrant B | 1,358,674 | 151,642 |
| Events in quadrant C | 1,361,427 | 148,029 |
| Events in quadrant D | 4,045,105 | 100,132 |
| Mode M9 | |||
|---|---|---|---|
| Quadrant | BADHDUFLAG | Total packets | Discarded packets |
| A | 0 | 6 | 0 |
| B | 0 | 6 | 0 |
| C | 0 | 6 | 0 |
| D | 0 | 6 | 0 |
| Mode M0 | |||
|---|---|---|---|
| Quadrant | BADHDUFLAG | Total packets | Discarded packets |
| A | 0 | 6069 | 491 |
| B | 0 | 6170 | 460 |
| C | 0 | 6146 | 473 |
| D | 0 | 15723 | 1937 |
| Mode SS | |||
|---|---|---|---|
| Quadrant | BADHDUFLAG | Total packets | Discarded packets |
| A | 0 | 60 | 4 |
| B | 0 | 60 | 4 |
| C | 0 | 59 | 5 |
| D | 0 | 60 | 4 |
| Quadrant | Total seconds | Saturated seconds | Saturation percentage |
|---|---|---|---|
| A | 2650 | 39 | 1.471698% |
| B | 2668 | 42 | 1.574213% |
| C | 2664 | 86 | 3.228228% |
| D | 2584 | 1381 | 53.444272% |
Noise dominated data is calculated using 1-second bins in cleaned event files. If a bin has >2000 counts, and if more than 50% of those come from <1% of pixels, then it is considered to be noise-dominated and hence unusable.
| Quadrant | # 1 sec bins | Bins with >0 counts | Bins with >2000 counts | High rate bins dominated by noise | Noise dominated (total time) | Noise dominated (detector-on time) | Marked lightcurve |
|---|---|---|---|---|---|---|---|
| A | 3454 | 2712 | 0 | 0 | 0.00% | 0.00% | 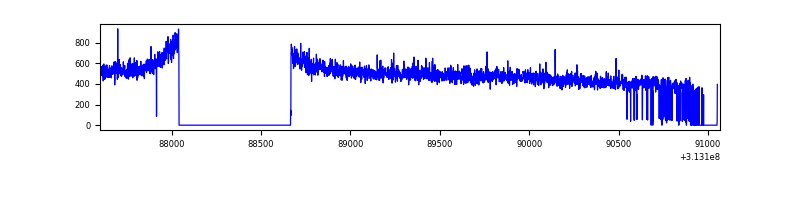 |
| B | 3467 | 2722 | 1 | 1 | 0.03% | 0.04% | 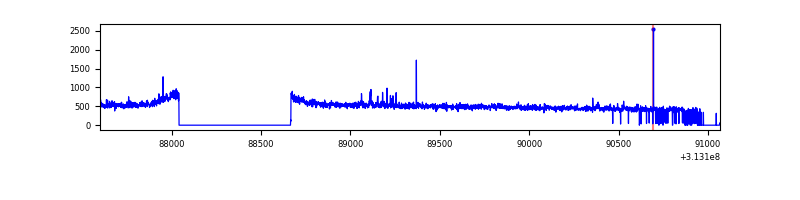 |
| C | 3451 | 2715 | 0 | 0 | 0.00% | 0.00% | 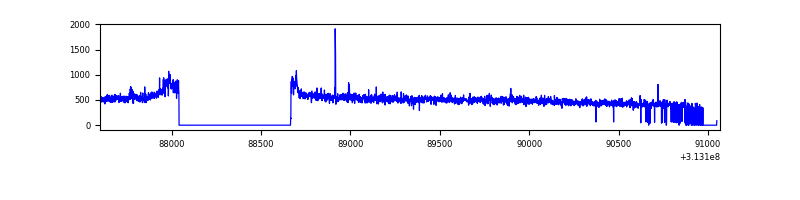 |
| D | 3362 | 2658 | 792 | 792 | 23.56% | 29.80% | 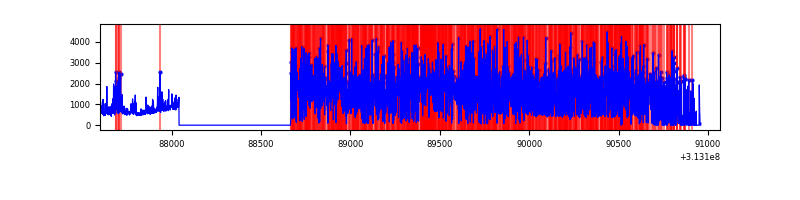 |
Top three noisy pixels from each quadrant. If the there are fewer than three noisy pixels in the level2.evt file, extra rows are filled as -1
| Pixel properties | Quadrant properties | ||||||
|---|---|---|---|---|---|---|---|
| Quadrant | DetID | PixID | Counts | Sigma | Mean | Median | Sigma |
| A | 13 | 254 | 4422 | 58.36 | 337 | 328 | 70.2 |
| A | 3 | 137 | 2977 | 37.76 | 337 | 328 | 70.2 |
| A | 0 | 226 | 2906 | 36.75 | 337 | 328 | 70.2 |
| B | 0 | 190 | 12837 | 187.37 | 337 | 328 | 66.8 |
| B | 12 | 111 | 7796 | 111.86 | 337 | 328 | 66.8 |
| B | 0 | 197 | 7294 | 104.34 | 337 | 328 | 66.8 |
| C | 14 | 238 | 51739 | 661.6 | 328 | 330 | 77.7 |
| C | 2 | 16 | 15083 | 189.86 | 328 | 330 | 77.7 |
| C | 9 | 54 | 6898 | 84.53 | 328 | 330 | 77.7 |
| D | 1 | 239 | 2895917 | 47083.81 | 244 | 237 | 61.5 |
| D | 1 | 52 | 193682 | 3145.42 | 244 | 237 | 61.5 |
| D | 12 | 233 | 12494 | 199.3 | 244 | 237 | 61.5 |
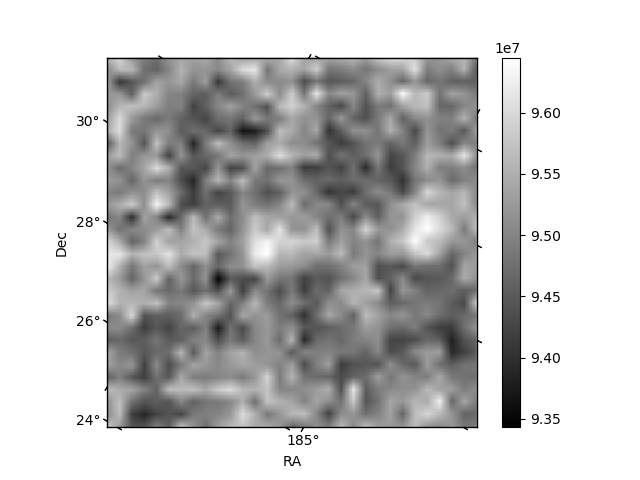
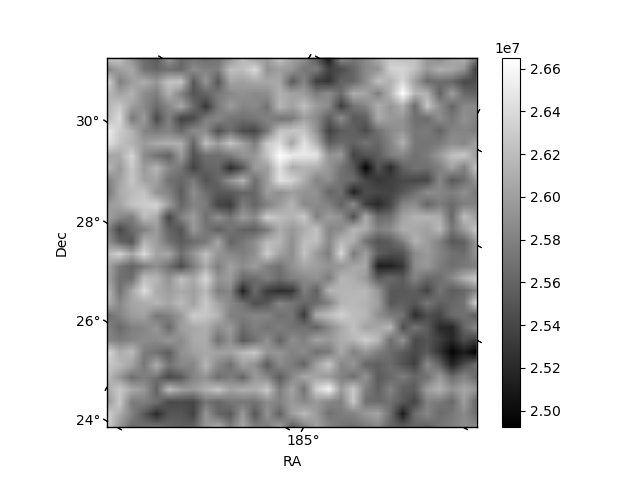
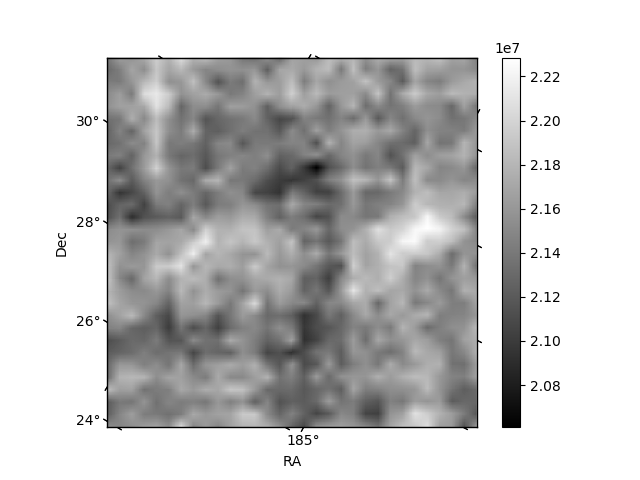
Histogram calculated using DETX and DETY for each event in the final _common_clean file
| Quadrant A | 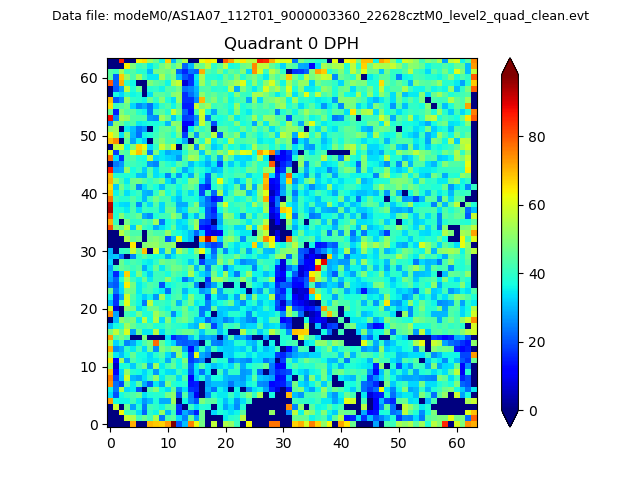 |
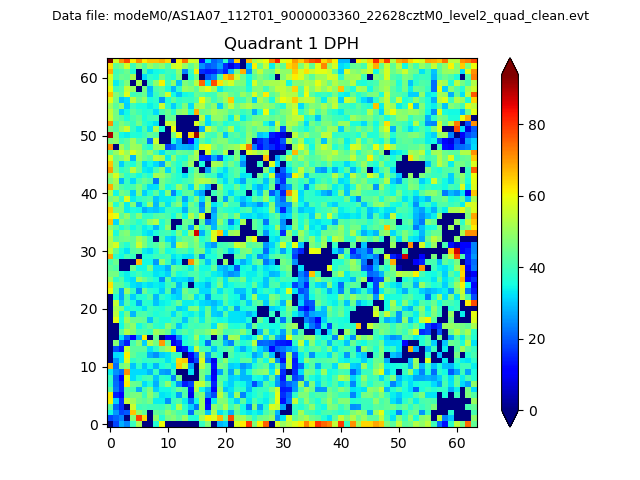 |
Quadrant B |
|---|---|---|---|
| Quadrant D |  |
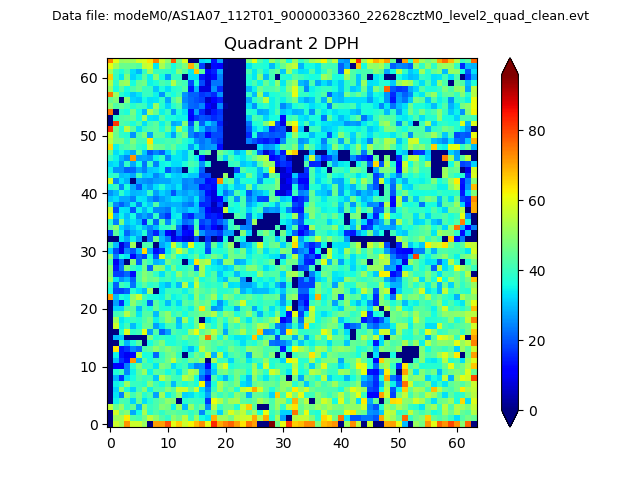 |
Quadrant C |
| Plot type | Count rate plots | Images |
|---|---|---|
| Comparison with Poisson distribution Blue bars denote a histogram of data divided into 1 sec bins. Red curve is a Poisson curve with rate = median count rate of data. |
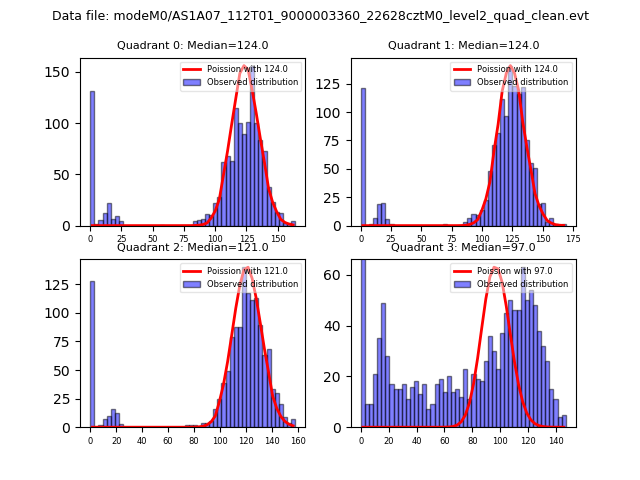 |
 |
| Quadrant-wise count rates Data is divided into 100 sec bins |
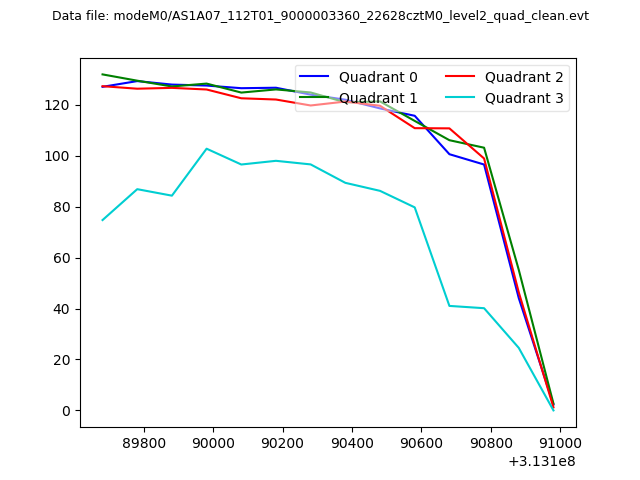 |
|
| Module-wise count rates for Quadrant A Data is divided into 100 sec bins |
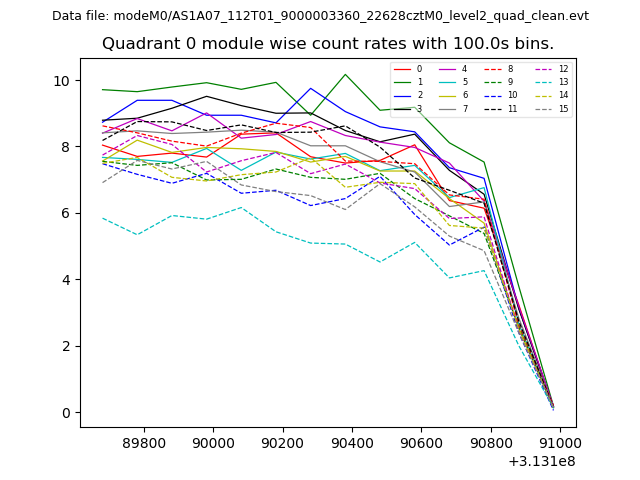 |
 |
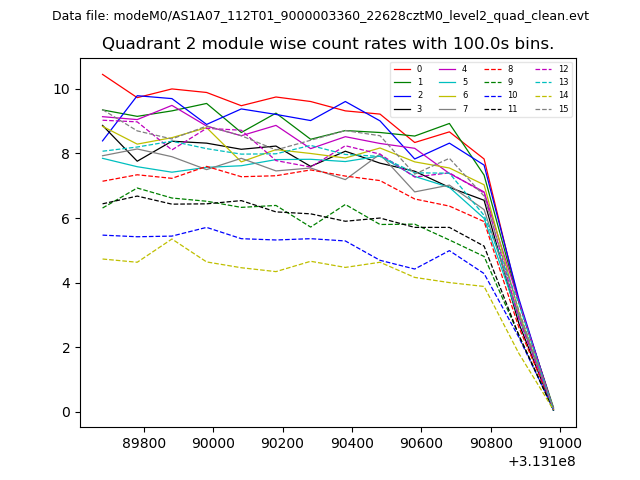
| Module-wise count rates for Quadrant B Data is divided into 100 sec bins |
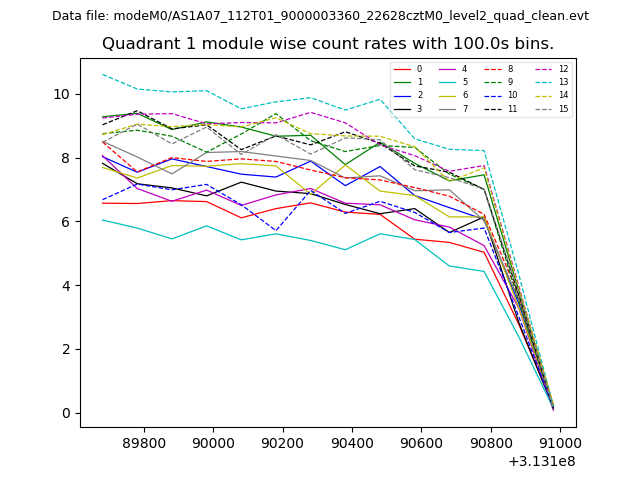 |
 |
| Module-wise count rates for Quadrant C Data is divided into 100 sec bins |
 |
 |
| Module-wise count rates for Quadrant D Data is divided into 100 sec bins |
 |
 |
| Parameter | Plot |
|---|---|
| CZT HV Monitor | 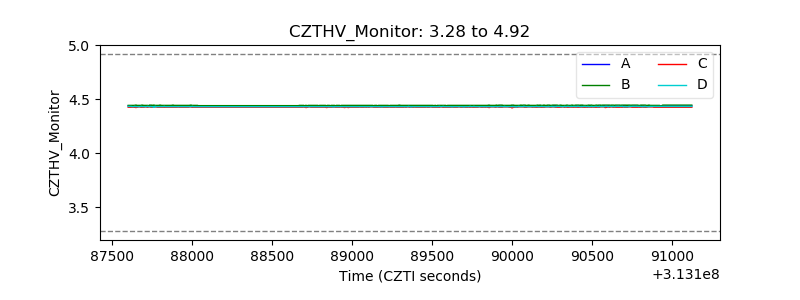 |
| D_VDD | 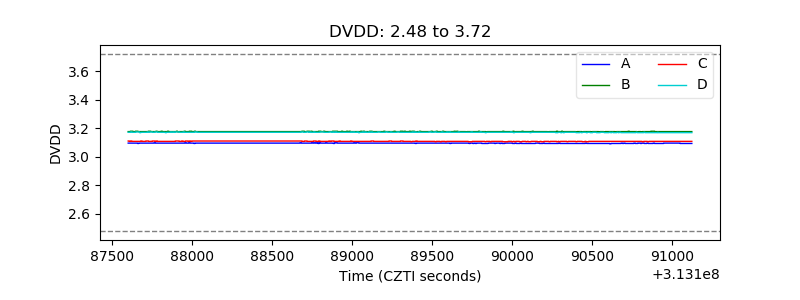 |
| Temperature 1 | 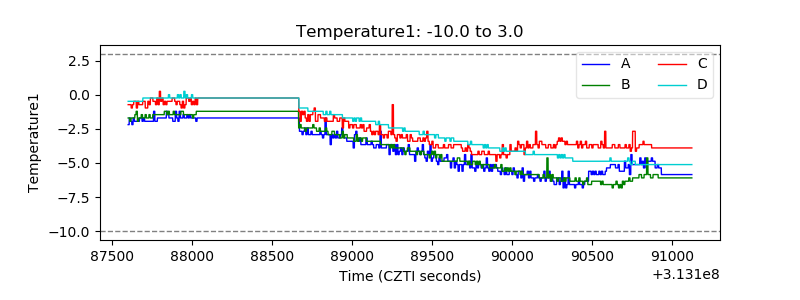 |
| Veto HV Monitor | 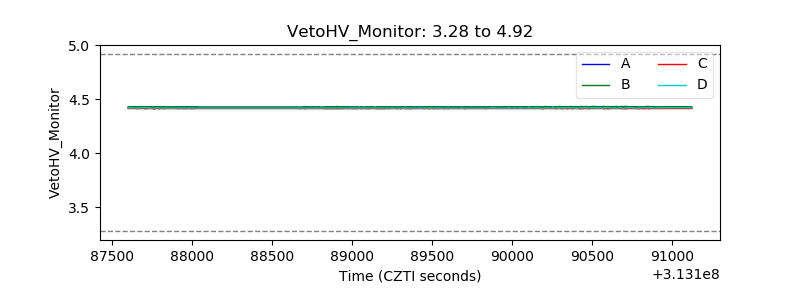 |
| Veto LLD | 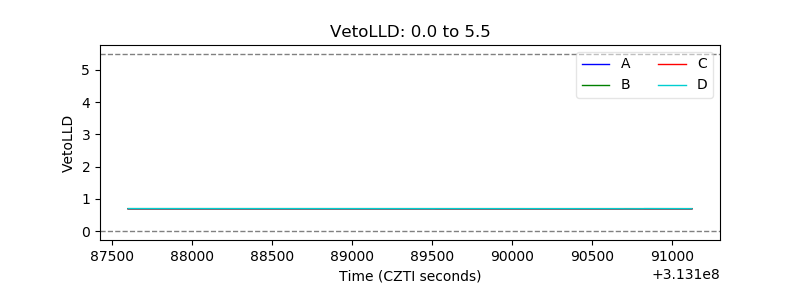 |
| Alpha Counter | 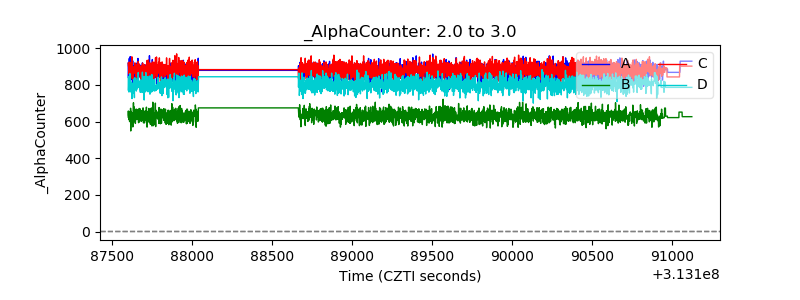 |
| _CPM_Rate | 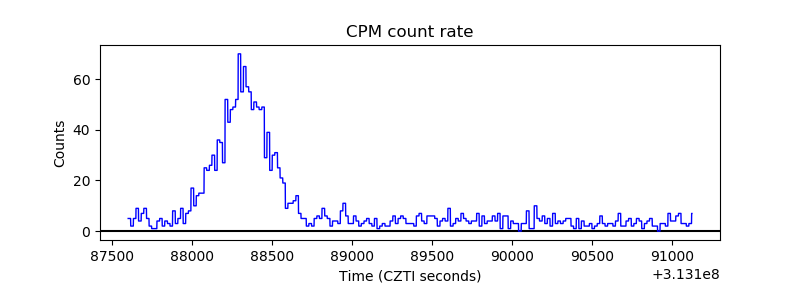 |
| CZT Counter | 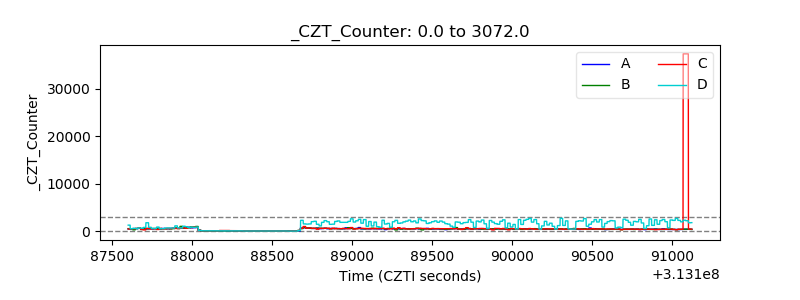 |
| +2.5 Volts monitor | 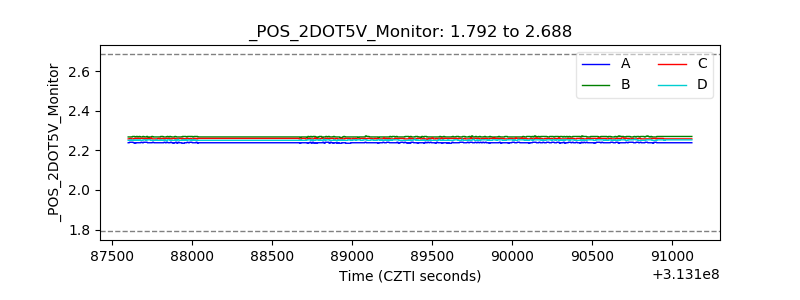 |
| +5 Volts monitor | 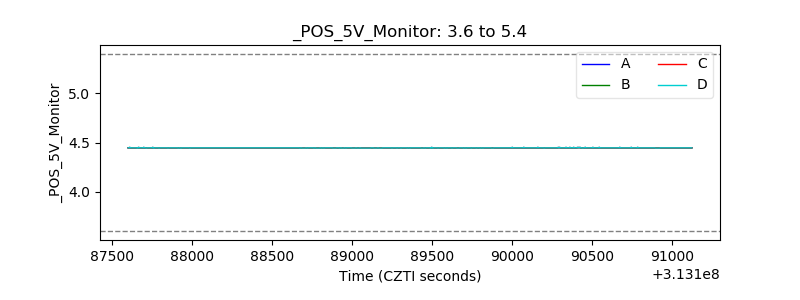 |
| _ROLL_ROT | 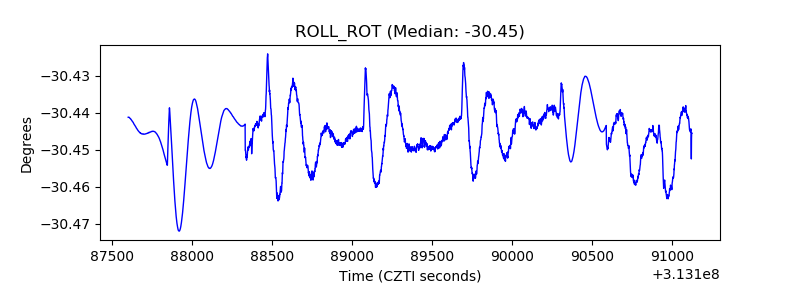 |
| _Roll_DEC | 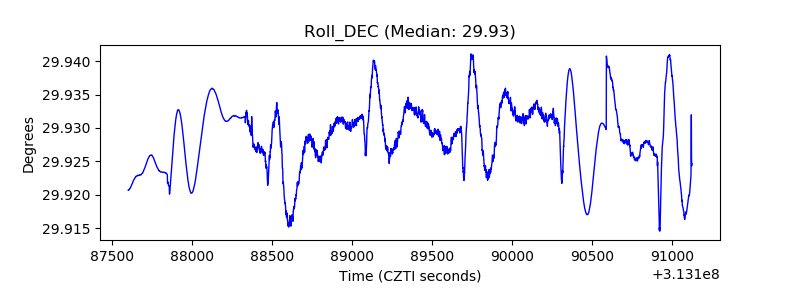 |
| _Roll_RA | 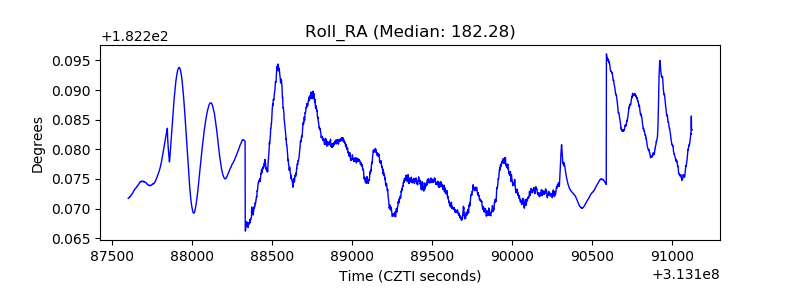 |
| Veto Counter | 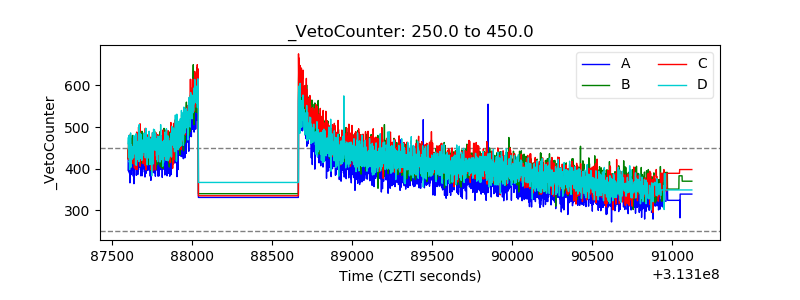 |