| Param | Original file | Final file |
|---|---|---|
| Filename | modeM0/AS1A07_112T01_9000003360_22632cztM0_level2.evt | modeM0/AS1A07_112T01_9000003360_22632cztM0_level2_quad_clean.evt |
| Size (bytes) | 1,686,205,440 | 294,056,640 |
| Size | 1.6 GB | 280.4 MB |
| Events in quadrant A | 10,309,845 | 1,891,117 |
| Events in quadrant B | 10,614,393 | 1,918,435 |
| Events in quadrant C | 10,486,853 | 1,849,614 |
| Events in quadrant D | 18,132,470 | 1,694,953 |
| Mode M9 | |||
|---|---|---|---|
| Quadrant | BADHDUFLAG | Total packets | Discarded packets |
| A | 0 | 23 | 0 |
| B | 0 | 23 | 0 |
| C | 0 | 23 | 0 |
| D | 0 | 23 | 0 |
| Mode M0 | |||
|---|---|---|---|
| Quadrant | BADHDUFLAG | Total packets | Discarded packets |
| A | 0 | 46020 | 4 |
| B | 0 | 46565 | 4 |
| C | 0 | 46363 | 4 |
| D | 0 | 69657 | 4 |
| Mode SS | |||
|---|---|---|---|
| Quadrant | BADHDUFLAG | Total packets | Discarded packets |
| A | 0 | 460 | 0 |
| B | 0 | 460 | 0 |
| C | 0 | 460 | 0 |
| D | 0 | 460 | 0 |
| Quadrant | Total seconds | Saturated seconds | Saturation percentage |
|---|---|---|---|
| A | 22544 | 111 | 0.492370% |
| B | 22545 | 183 | 0.811710% |
| C | 22545 | 277 | 1.228654% |
| D | 22545 | 3073 | 13.630517% |
Noise dominated data is calculated using 1-second bins in cleaned event files. If a bin has >2000 counts, and if more than 50% of those come from <1% of pixels, then it is considered to be noise-dominated and hence unusable.
| Quadrant | # 1 sec bins | Bins with >0 counts | Bins with >2000 counts | High rate bins dominated by noise | Noise dominated (total time) | Noise dominated (detector-on time) | Marked lightcurve |
|---|---|---|---|---|---|---|---|
| A | 32616 | 22550 | 0 | 0 | 0.00% | 0.00% | 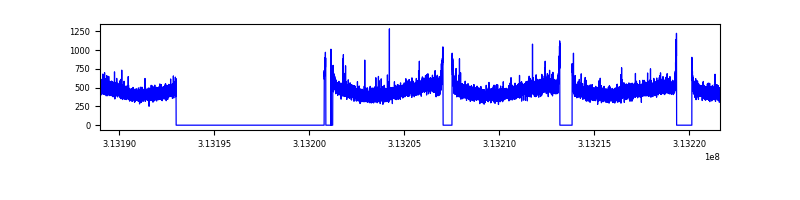 |
| B | 32617 | 22551 | 8 | 8 | 0.02% | 0.04% | 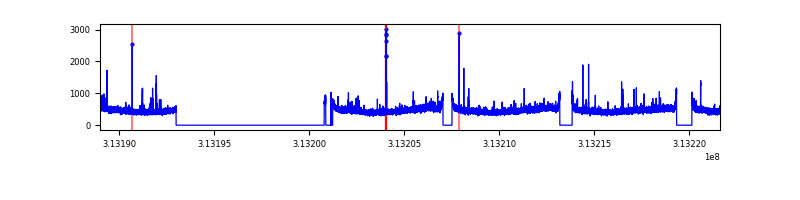 |
| C | 32617 | 22551 | 10 | 10 | 0.03% | 0.04% | 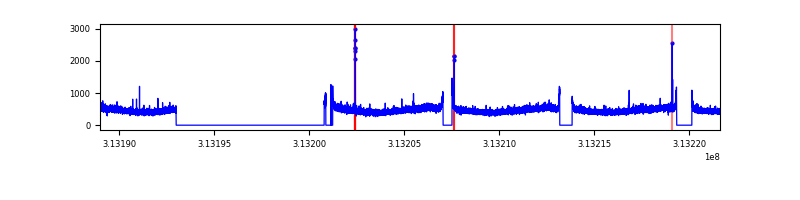 |
| D | 32617 | 22551 | 2138 | 2138 | 6.55% | 9.48% | 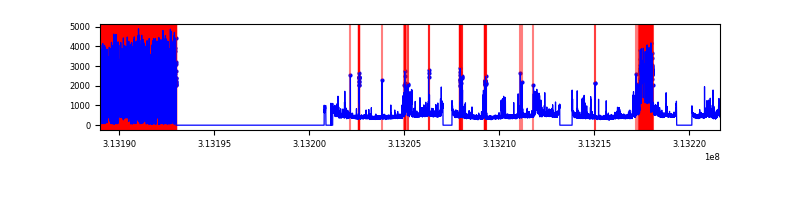 |
Top three noisy pixels from each quadrant. If the there are fewer than three noisy pixels in the level2.evt file, extra rows are filled as -1
| Pixel properties | Quadrant properties | ||||||
|---|---|---|---|---|---|---|---|
| Quadrant | DetID | PixID | Counts | Sigma | Mean | Median | Sigma |
| A | 13 | 254 | 35485 | 61.44 | 2666 | 2608 | 535.1 |
| A | 11 | 47 | 25568 | 42.91 | 2666 | 2608 | 535.1 |
| A | 3 | 137 | 23231 | 38.54 | 2666 | 2608 | 535.1 |
| B | 0 | 230 | 65475 | 124.69 | 2659 | 2589 | 504.4 |
| B | 12 | 111 | 63052 | 119.88 | 2659 | 2589 | 504.4 |
| B | 11 | 111 | 54960 | 103.84 | 2659 | 2589 | 504.4 |
| C | 14 | 238 | 404707 | 671.36 | 2556 | 2570 | 599.0 |
| C | 10 | 22 | 56398 | 89.87 | 2556 | 2570 | 599.0 |
| C | 0 | 207 | 32219 | 49.5 | 2556 | 2570 | 599.0 |
| D | 1 | 239 | 5005585 | 8621.09 | 2398 | 2336 | 580.3 |
| D | 7 | 238 | 2011054 | 3461.22 | 2398 | 2336 | 580.3 |
| D | 1 | 52 | 1531599 | 2635.07 | 2398 | 2336 | 580.3 |
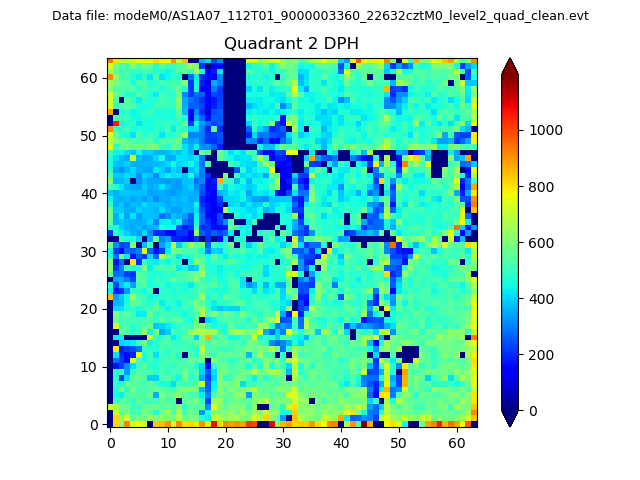
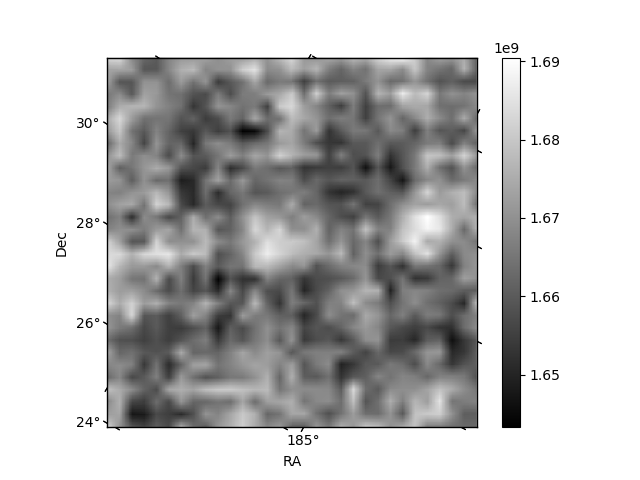
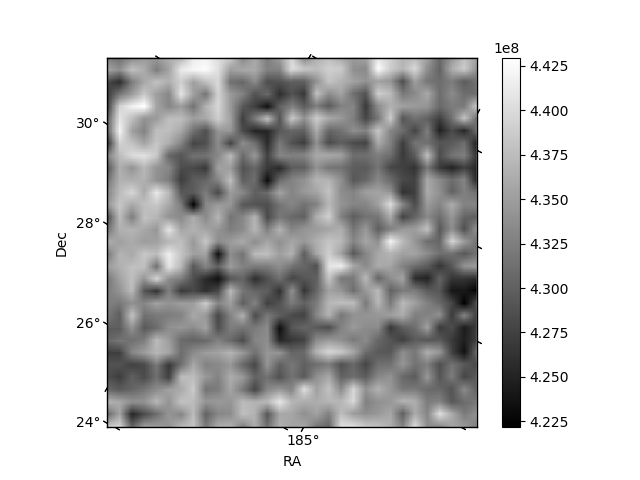
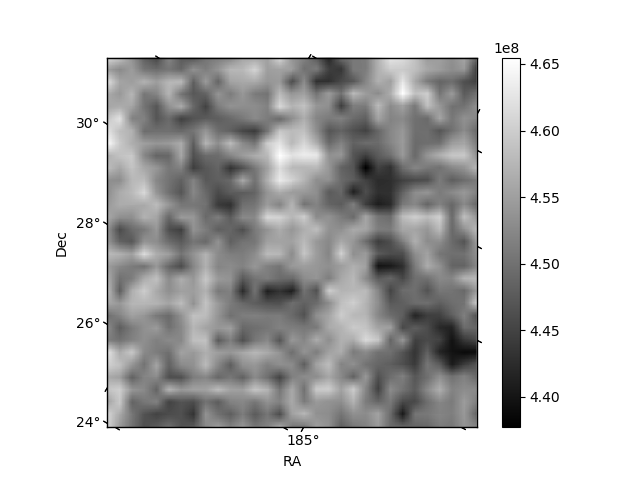
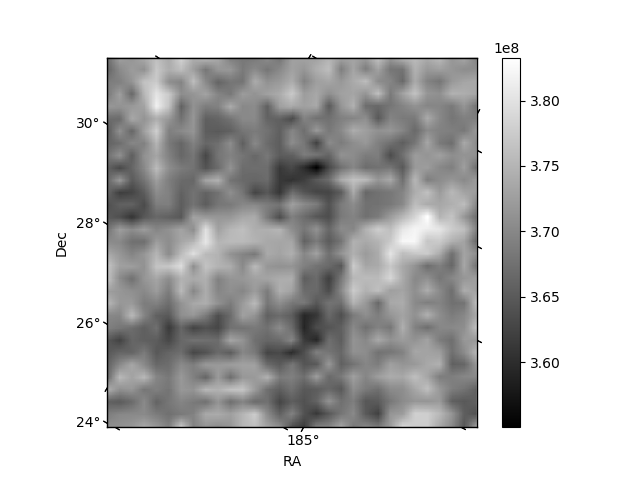
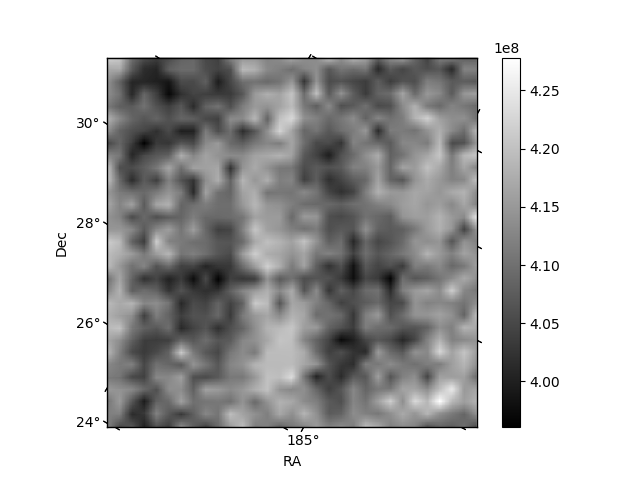
Histogram calculated using DETX and DETY for each event in the final _common_clean file
| Quadrant A | 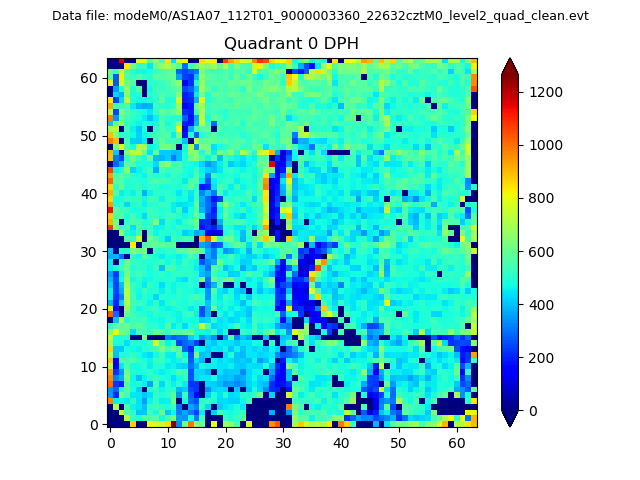 |
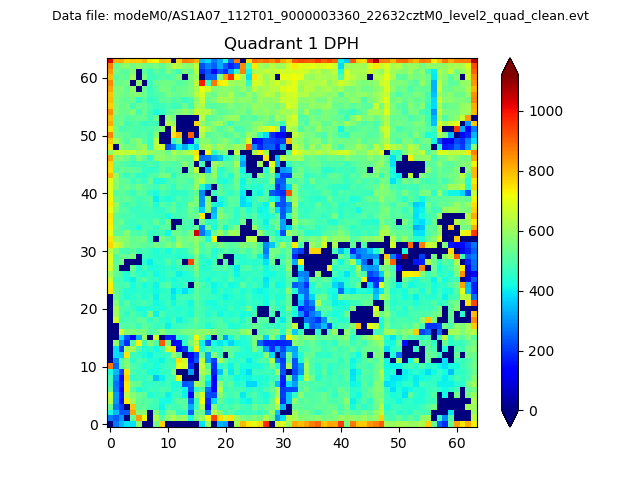 |
Quadrant B |
|---|---|---|---|
| Quadrant D | 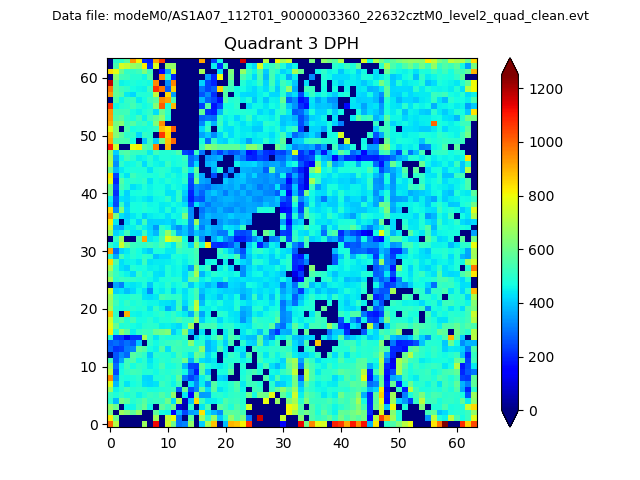 |
 |
Quadrant C |
| Plot type | Count rate plots | Images |
|---|---|---|
| Comparison with Poisson distribution Blue bars denote a histogram of data divided into 1 sec bins. Red curve is a Poisson curve with rate = median count rate of data. |
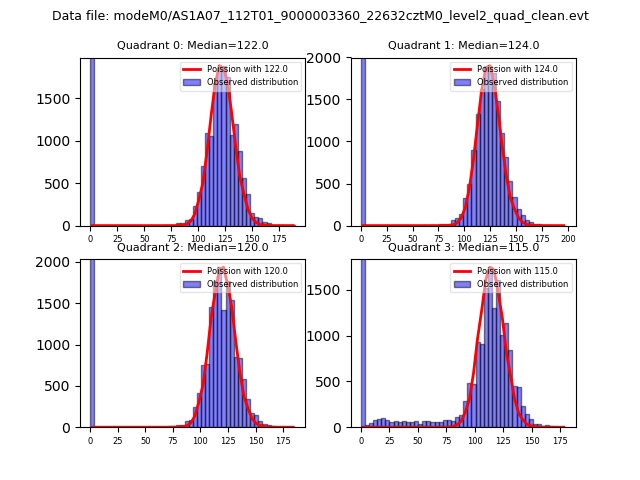 |
 |
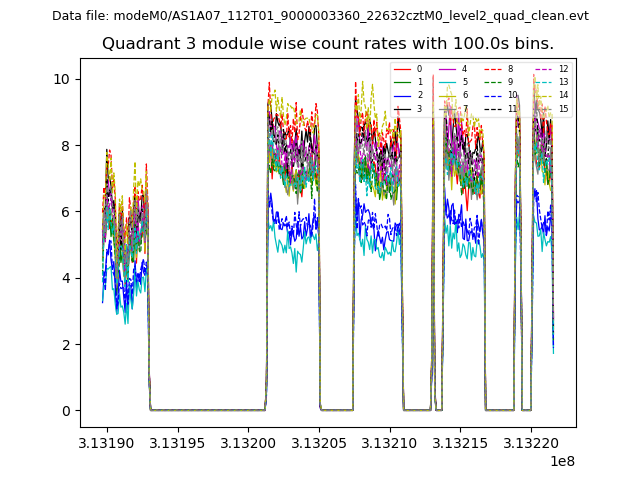
| Quadrant-wise count rates Data is divided into 100 sec bins |
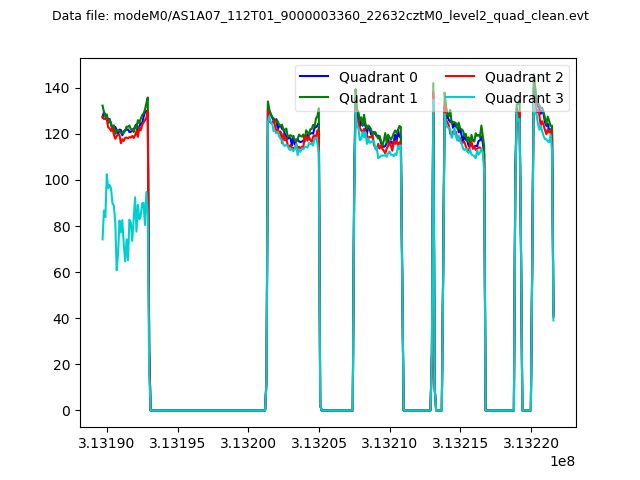 |
|
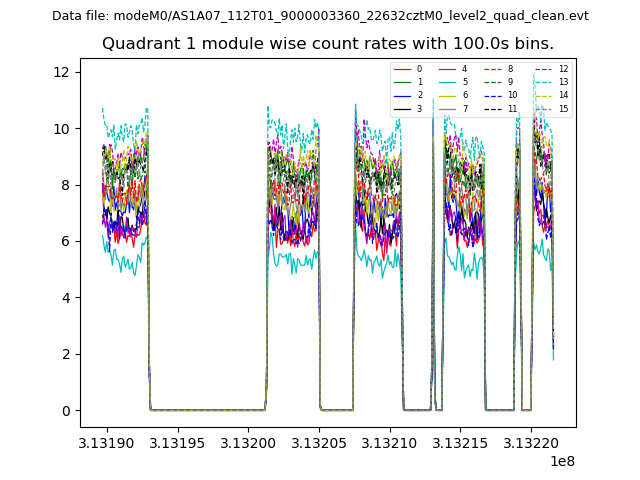
| Module-wise count rates for Quadrant A Data is divided into 100 sec bins |
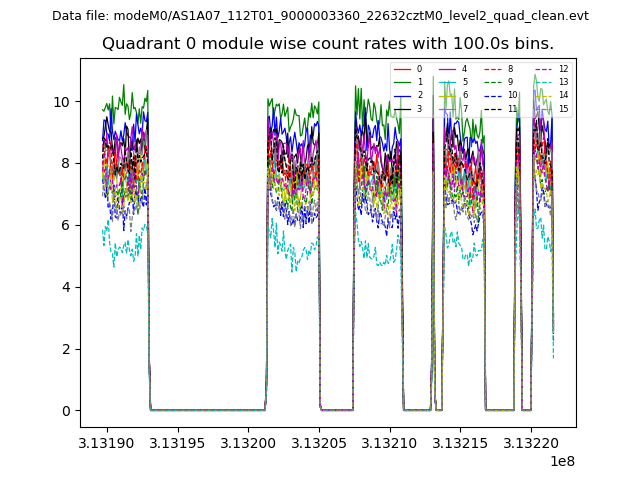 |
 |
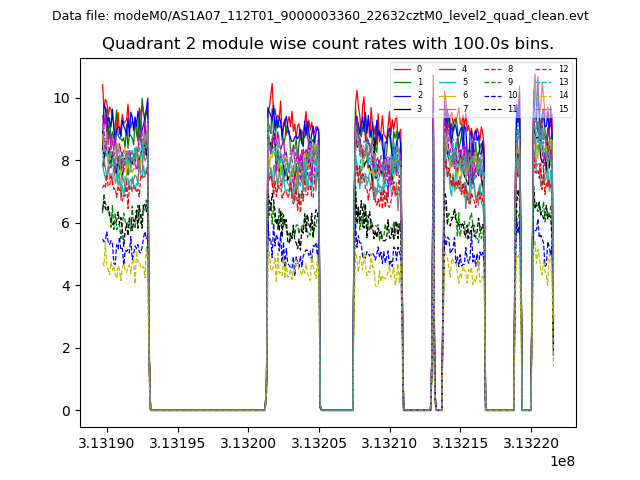
| Module-wise count rates for Quadrant B Data is divided into 100 sec bins |
 |
 |
| Module-wise count rates for Quadrant C Data is divided into 100 sec bins |
 |
 |
| Module-wise count rates for Quadrant D Data is divided into 100 sec bins |
 |
 |
| Parameter | Plot |
|---|---|
| CZT HV Monitor | 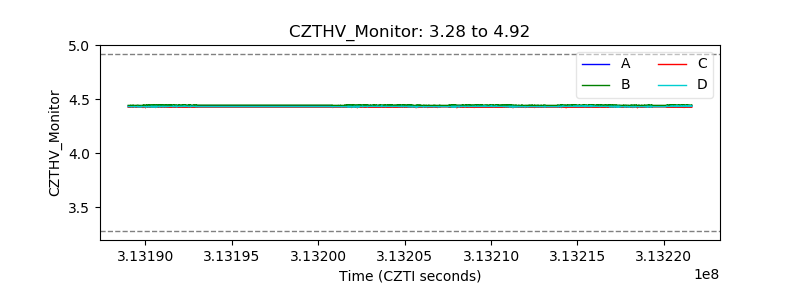 |
| D_VDD | 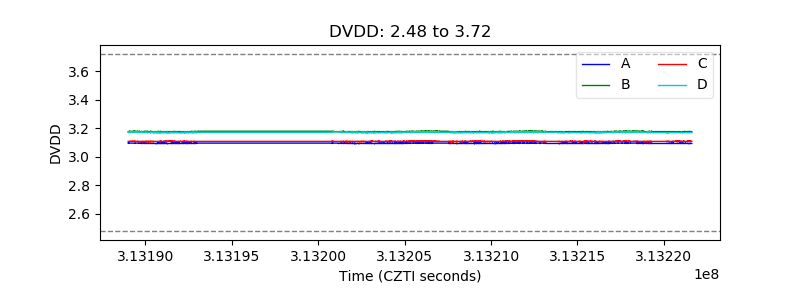 |
| Temperature 1 | 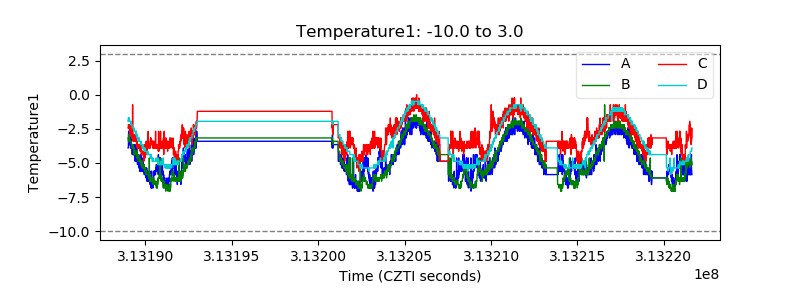 |
| Veto HV Monitor | 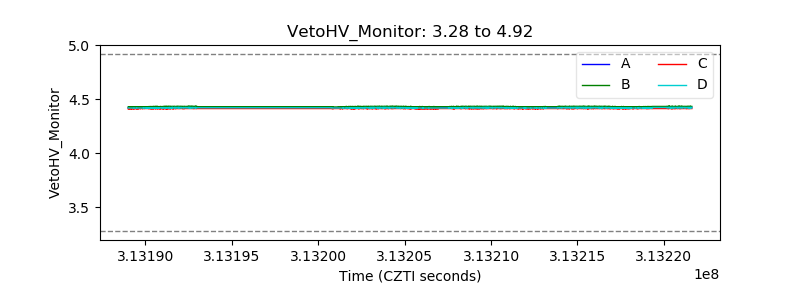 |
| Veto LLD | 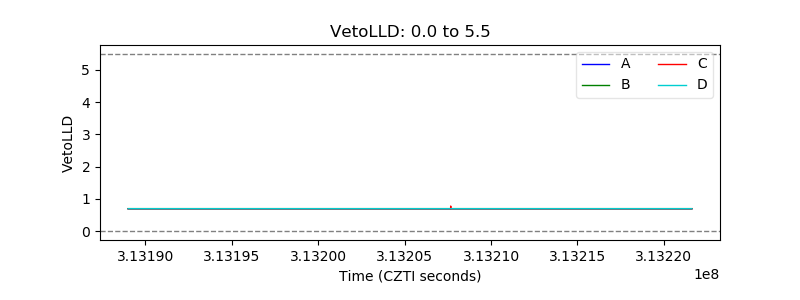 |
| Alpha Counter | 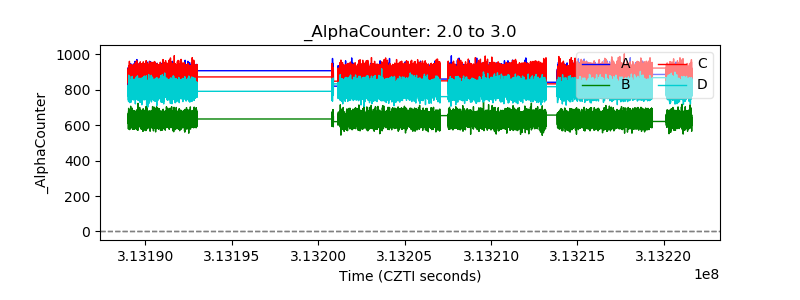 |
| _CPM_Rate | 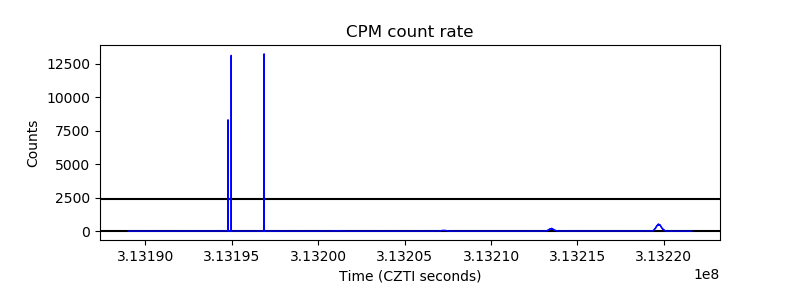 |
| CZT Counter | 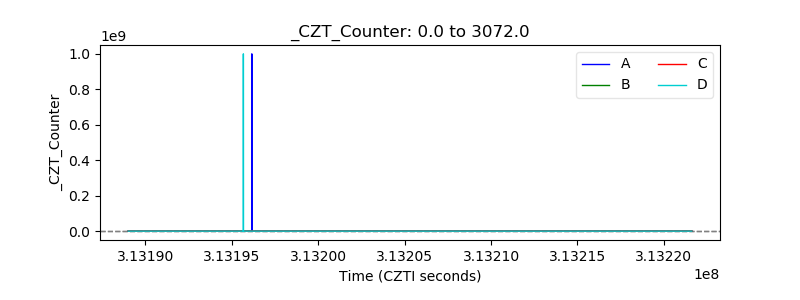 |
| +2.5 Volts monitor |  |
| +5 Volts monitor | 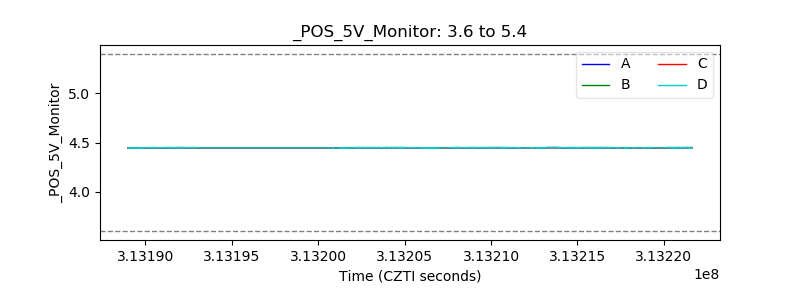 |
| _ROLL_ROT | 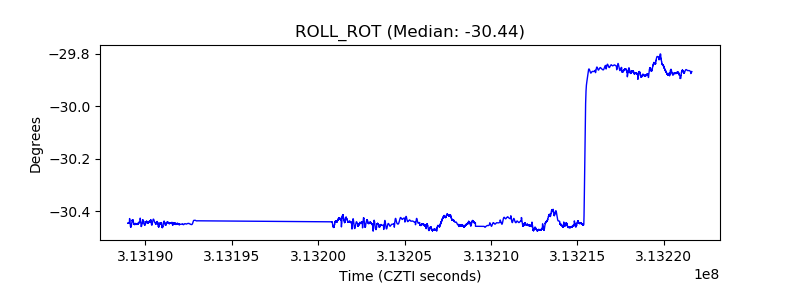 |
| _Roll_DEC | 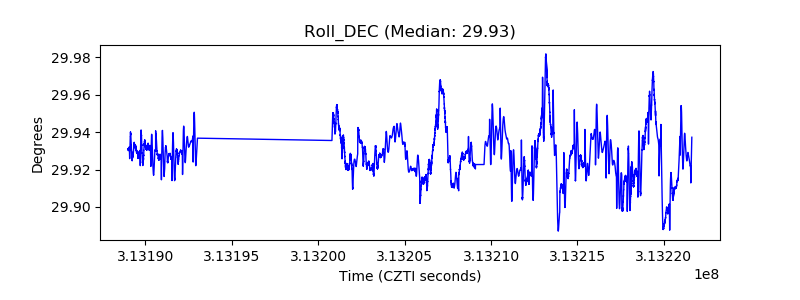 |
| _Roll_RA | 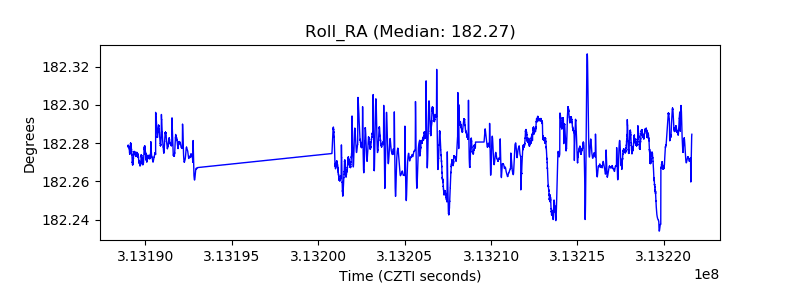 |
| Veto Counter | 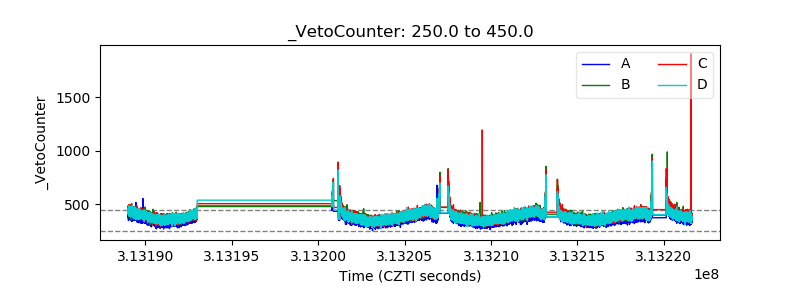 |