| Param | Original file | Final file |
|---|---|---|
| Filename | modeM0/AS1A07_112T01_9000003360_22633cztM0_level2.evt | modeM0/AS1A07_112T01_9000003360_22633cztM0_level2_quad_clean.evt |
| Size (bytes) | 2,629,584,000 | 442,808,640 |
| Size | 2.4 GB | 422.3 MB |
| Events in quadrant A | 16,430,874 | 2,813,601 |
| Events in quadrant B | 16,918,740 | 2,854,558 |
| Events in quadrant C | 16,777,572 | 2,753,306 |
| Events in quadrant D | 27,121,945 | 2,560,245 |
| Mode M9 | |||
|---|---|---|---|
| Quadrant | BADHDUFLAG | Total packets | Discarded packets |
| A | 0 | 36 | 0 |
| B | 0 | 36 | 0 |
| C | 0 | 36 | 0 |
| D | 0 | 36 | 0 |
| Mode M0 | |||
|---|---|---|---|
| Quadrant | BADHDUFLAG | Total packets | Discarded packets |
| A | 0 | 72427 | 6 |
| B | 0 | 73468 | 6 |
| C | 0 | 73162 | 6 |
| D | 0 | 105140 | 6 |
| Mode SS | |||
|---|---|---|---|
| Quadrant | BADHDUFLAG | Total packets | Discarded packets |
| A | 0 | 718 | 0 |
| B | 0 | 718 | 0 |
| C | 0 | 718 | 0 |
| D | 0 | 718 | 0 |
| Quadrant | Total seconds | Saturated seconds | Saturation percentage |
|---|---|---|---|
| A | 35381 | 196 | 0.553970% |
| B | 35382 | 287 | 0.811147% |
| C | 35382 | 470 | 1.328359% |
| D | 35382 | 4335 | 12.251993% |
Noise dominated data is calculated using 1-second bins in cleaned event files. If a bin has >2000 counts, and if more than 50% of those come from <1% of pixels, then it is considered to be noise-dominated and hence unusable.
| Quadrant | # 1 sec bins | Bins with >0 counts | Bins with >2000 counts | High rate bins dominated by noise | Noise dominated (total time) | Noise dominated (detector-on time) | Marked lightcurve |
|---|---|---|---|---|---|---|---|
| A | 38871 | 35388 | 0 | 0 | 0.00% | 0.00% | 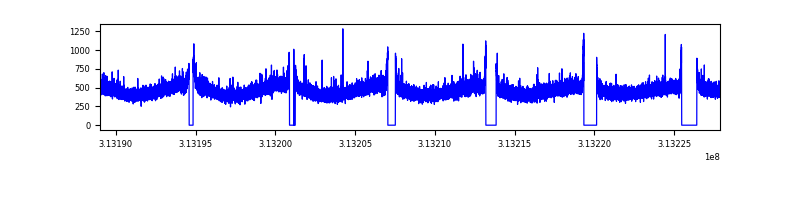 |
| B | 38872 | 35389 | 19 | 19 | 0.05% | 0.05% | 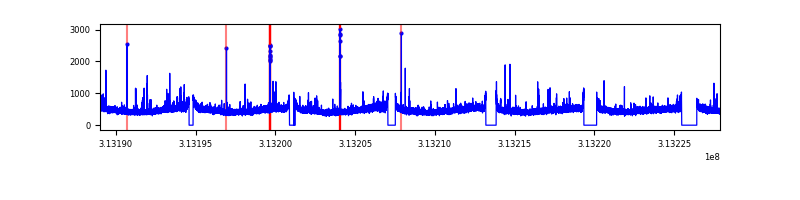 |
| C | 38872 | 35389 | 27 | 27 | 0.07% | 0.08% | 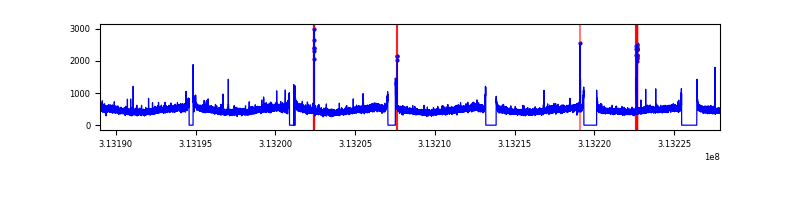 |
| D | 38872 | 35389 | 2731 | 2731 | 7.03% | 7.72% | 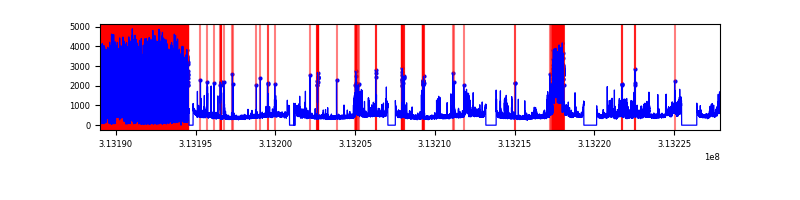 |
Top three noisy pixels from each quadrant. If the there are fewer than three noisy pixels in the level2.evt file, extra rows are filled as -1
| Pixel properties | Quadrant properties | ||||||
|---|---|---|---|---|---|---|---|
| Quadrant | DetID | PixID | Counts | Sigma | Mean | Median | Sigma |
| A | 11 | 47 | 61491 | 67.49 | 4245 | 4155 | 849.5 |
| A | 13 | 254 | 55599 | 60.56 | 4245 | 4155 | 849.5 |
| A | 3 | 137 | 36586 | 38.18 | 4245 | 4155 | 849.5 |
| B | 12 | 111 | 99555 | 119.5 | 4226 | 4115 | 798.7 |
| B | 10 | 247 | 93876 | 112.39 | 4226 | 4115 | 798.7 |
| B | 0 | 230 | 92578 | 110.76 | 4226 | 4115 | 798.7 |
| C | 14 | 238 | 641532 | 671.34 | 4068 | 4092 | 949.5 |
| C | 10 | 22 | 135188 | 138.07 | 4068 | 4092 | 949.5 |
| C | 0 | 207 | 72741 | 72.3 | 4068 | 4092 | 949.5 |
| D | 1 | 239 | 7284919 | 7827.69 | 3860 | 3757 | 930.2 |
| D | 7 | 238 | 2027853 | 2176.03 | 3860 | 3757 | 930.2 |
| D | 1 | 52 | 1753657 | 1881.25 | 3860 | 3757 | 930.2 |
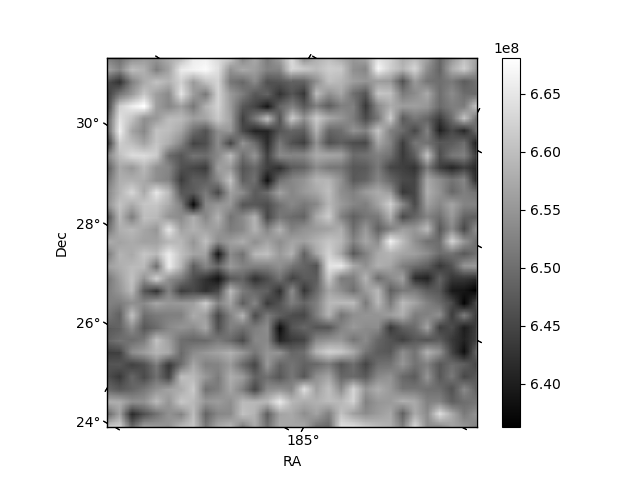
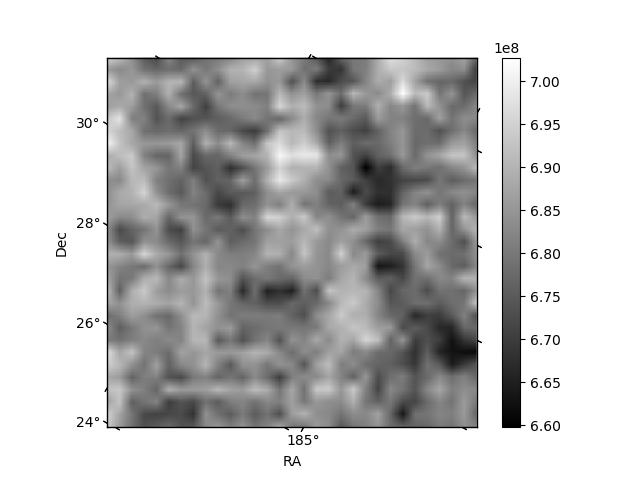
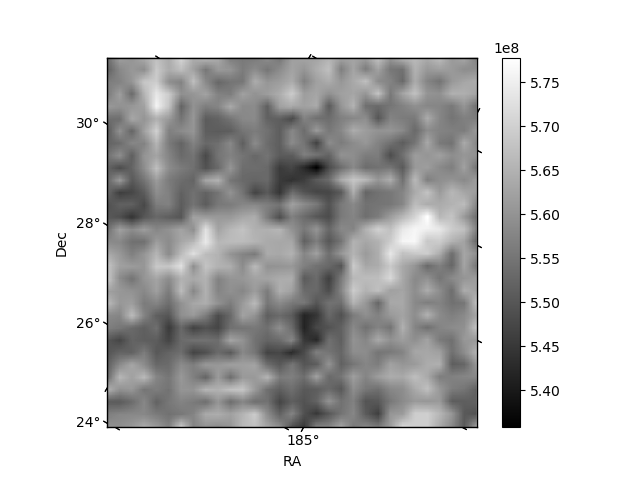
Histogram calculated using DETX and DETY for each event in the final _common_clean file
| Quadrant A | 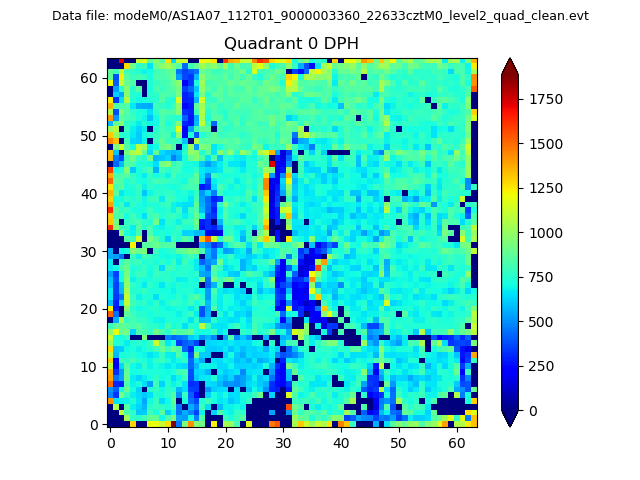 |
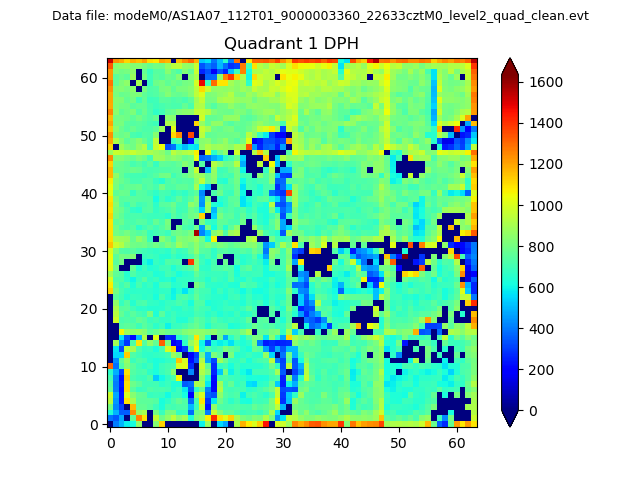 |
Quadrant B |
|---|---|---|---|
| Quadrant D | 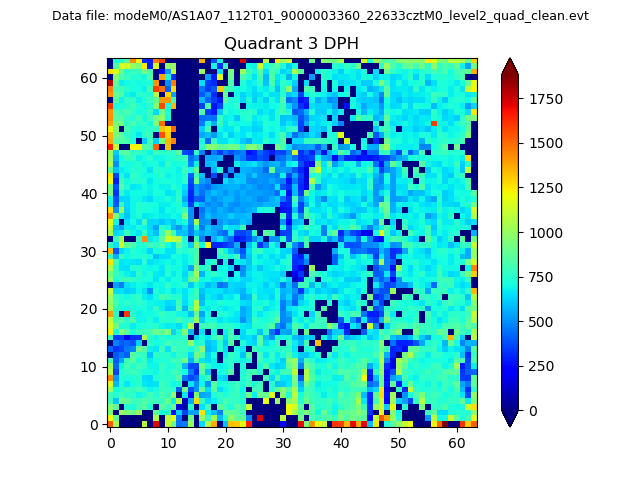 |
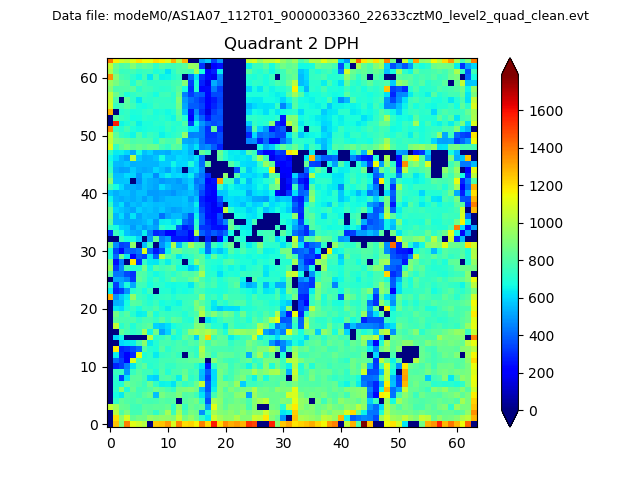 |
Quadrant C |
| Plot type | Count rate plots | Images |
|---|---|---|
| Comparison with Poisson distribution Blue bars denote a histogram of data divided into 1 sec bins. Red curve is a Poisson curve with rate = median count rate of data. |
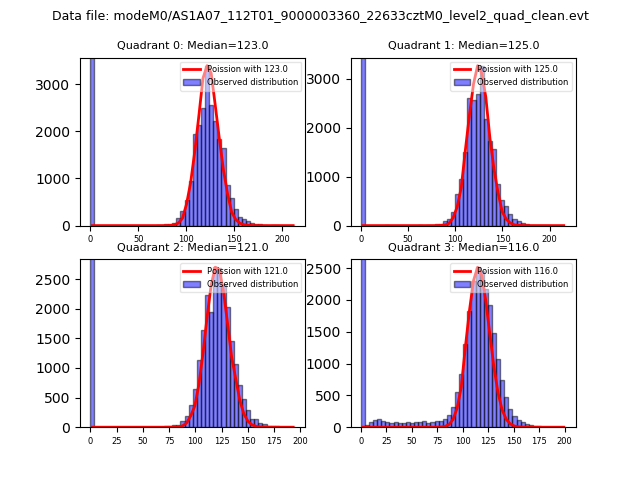 |
 |
| Quadrant-wise count rates Data is divided into 100 sec bins |
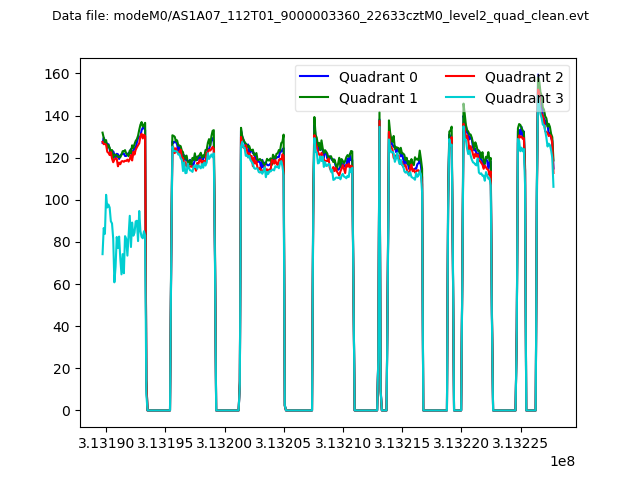 |
|
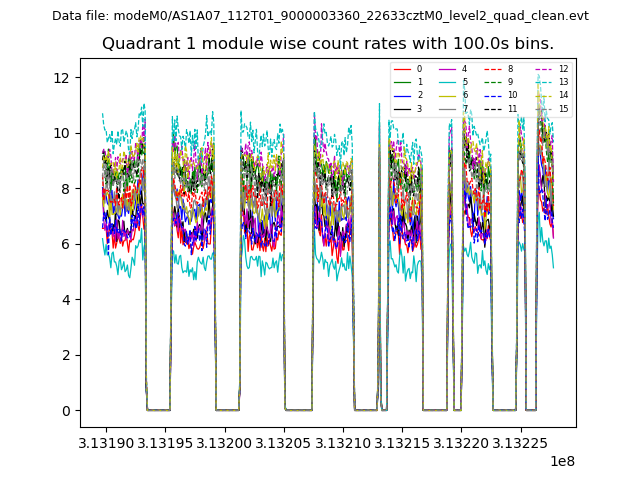
| Module-wise count rates for Quadrant A Data is divided into 100 sec bins |
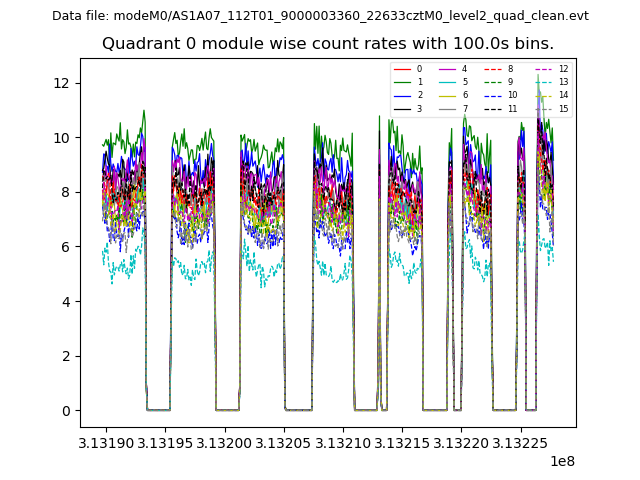 |
 |
| Module-wise count rates for Quadrant B Data is divided into 100 sec bins |
 |
 |
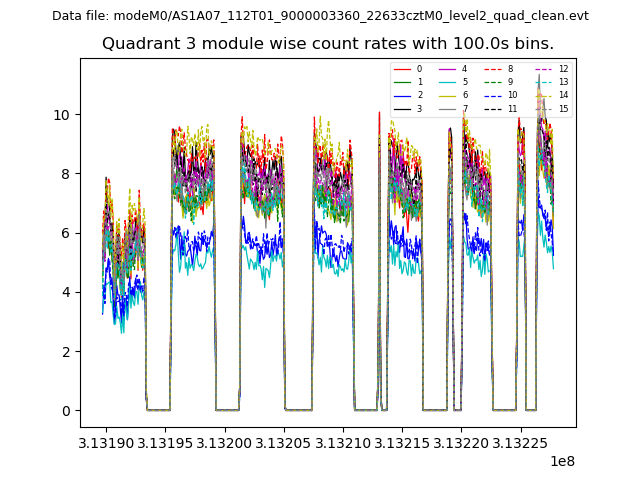
| Module-wise count rates for Quadrant C Data is divided into 100 sec bins |
 |
 |
| Module-wise count rates for Quadrant D Data is divided into 100 sec bins |
 |
 |
| Parameter | Plot |
|---|---|
| CZT HV Monitor | 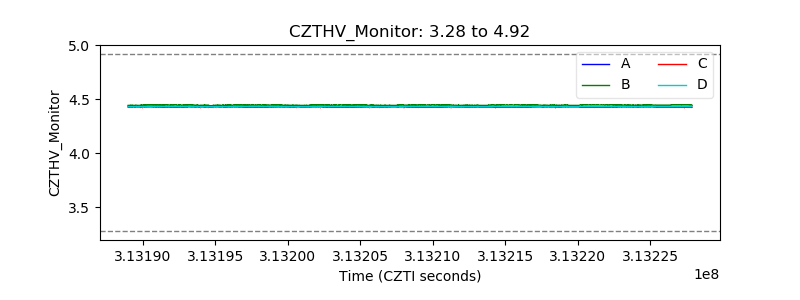 |
| D_VDD |  |
| Temperature 1 | 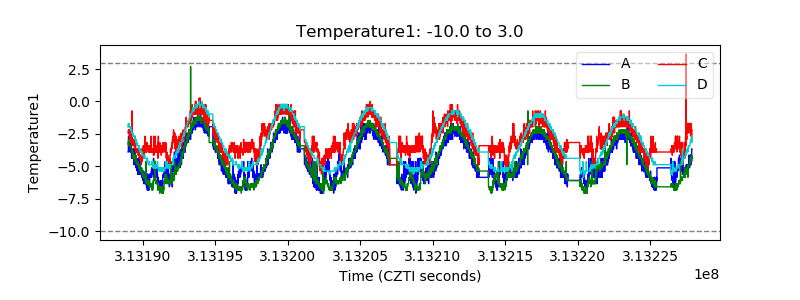 |
| Veto HV Monitor |  |
| Veto LLD | 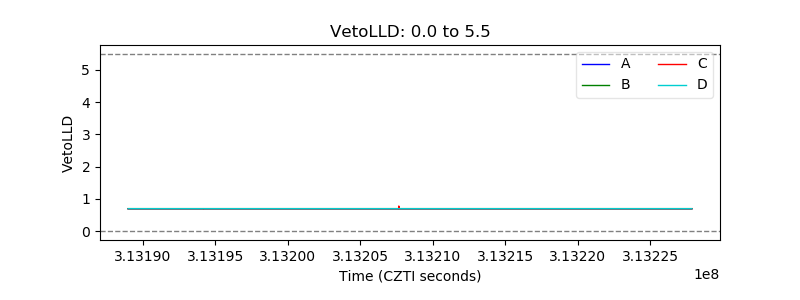 |
| Alpha Counter | 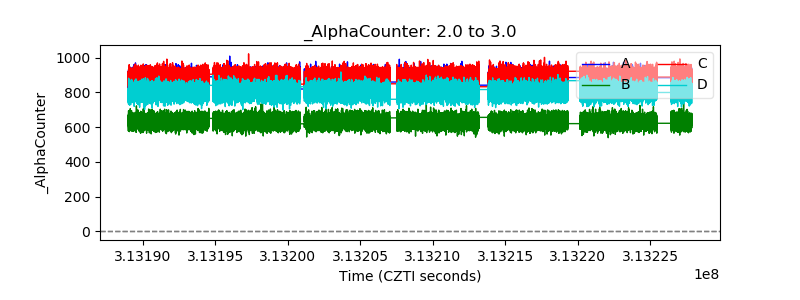 |
| _CPM_Rate | 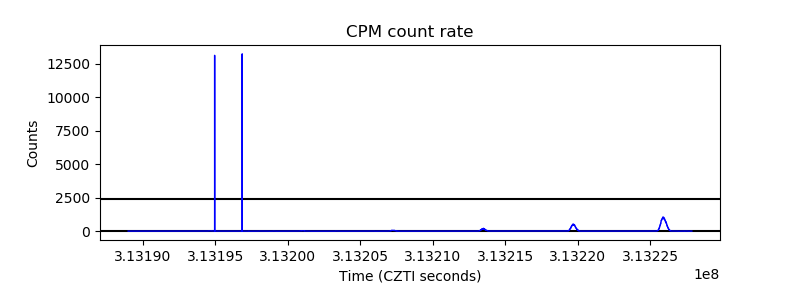 |
| CZT Counter | 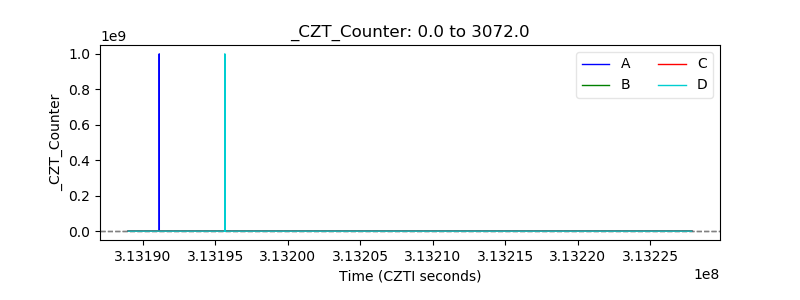 |
| +2.5 Volts monitor |  |
| +5 Volts monitor |  |
| _ROLL_ROT | 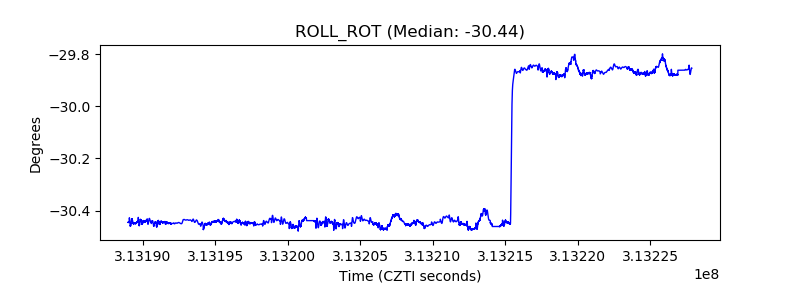 |
| _Roll_DEC | 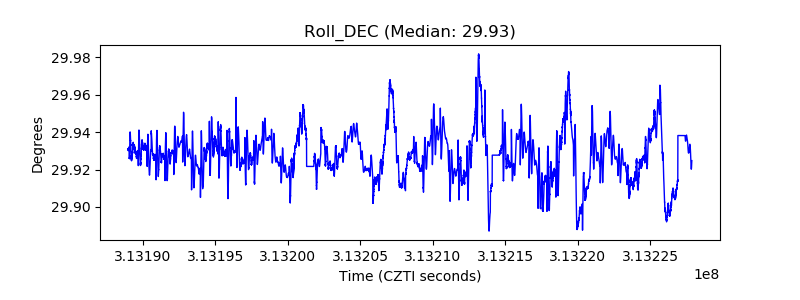 |
| _Roll_RA |  |
| Veto Counter | 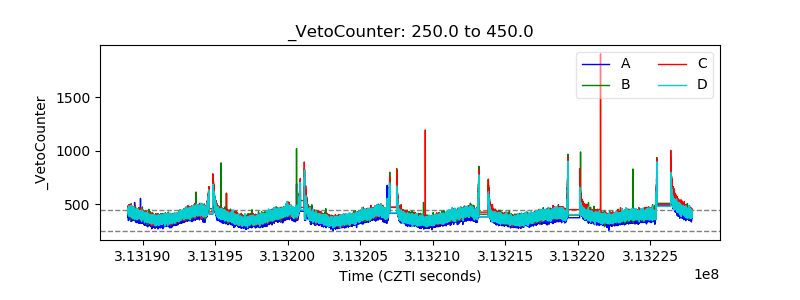 |