| Param | Original file | Final file |
|---|---|---|
| Filename | modeM0/AS1A07_112T01_9000003360_22635cztM0_level2.evt | modeM0/AS1A07_112T01_9000003360_22635cztM0_level2_quad_clean.evt |
| Size (bytes) | 469,437,120 | 93,637,440 |
| Size | 447.7 MB | 89.3 MB |
| Events in quadrant A | 3,121,162 | 604,893 |
| Events in quadrant B | 3,175,693 | 617,182 |
| Events in quadrant C | 3,164,073 | 590,349 |
| Events in quadrant D | 4,319,540 | 574,818 |
| Mode M9 | |||
|---|---|---|---|
| Quadrant | BADHDUFLAG | Total packets | Discarded packets |
| A | 0 | 11 | 0 |
| B | 0 | 11 | 0 |
| C | 0 | 11 | 0 |
| D | 0 | 11 | 0 |
| Mode M0 | |||
|---|---|---|---|
| Quadrant | BADHDUFLAG | Total packets | Discarded packets |
| A | 0 | 13134 | 1 |
| B | 0 | 13356 | 1 |
| C | 0 | 13257 | 1 |
| D | 0 | 17229 | 1 |
| Mode SS | |||
|---|---|---|---|
| Quadrant | BADHDUFLAG | Total packets | Discarded packets |
| A | 0 | 130 | 0 |
| B | 0 | 130 | 0 |
| C | 0 | 130 | 0 |
| D | 0 | 130 | 0 |
| Quadrant | Total seconds | Saturated seconds | Saturation percentage |
|---|---|---|---|
| A | 6429 | 38 | 0.591072% |
| B | 6430 | 46 | 0.715397% |
| C | 6430 | 73 | 1.135303% |
| D | 6430 | 45 | 0.699844% |
Noise dominated data is calculated using 1-second bins in cleaned event files. If a bin has >2000 counts, and if more than 50% of those come from <1% of pixels, then it is considered to be noise-dominated and hence unusable.
| Quadrant | # 1 sec bins | Bins with >0 counts | Bins with >2000 counts | High rate bins dominated by noise | Noise dominated (total time) | Noise dominated (detector-on time) | Marked lightcurve |
|---|---|---|---|---|---|---|---|
| A | 7539 | 6430 | 0 | 0 | 0.00% | 0.00% | 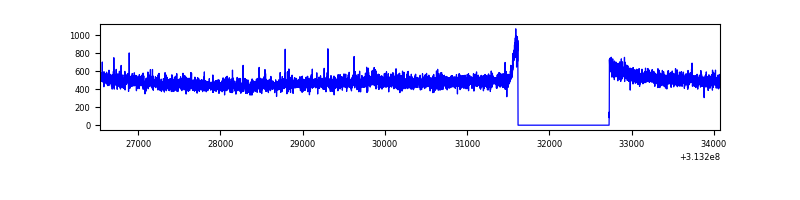 |
| B | 7540 | 6431 | 3 | 3 | 0.04% | 0.05% | 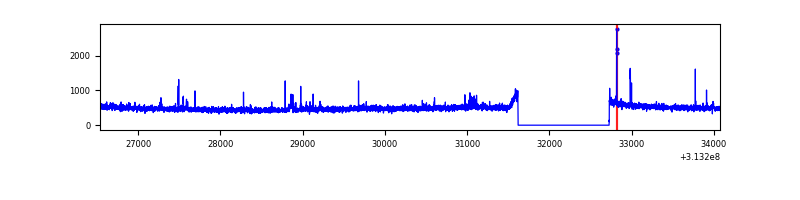 |
| C | 7540 | 6431 | 3 | 3 | 0.04% | 0.05% | 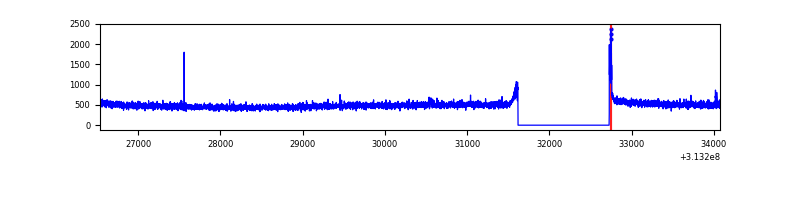 |
| D | 7540 | 6431 | 8 | 8 | 0.11% | 0.12% | 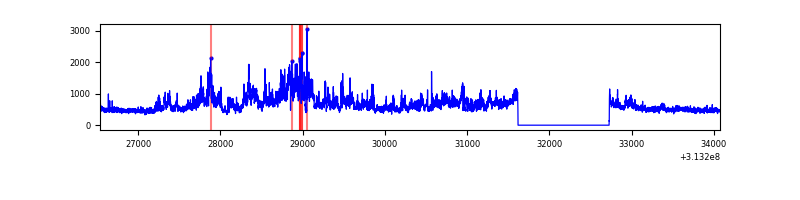 |
Top three noisy pixels from each quadrant. If the there are fewer than three noisy pixels in the level2.evt file, extra rows are filled as -1
| Pixel properties | Quadrant properties | ||||||
|---|---|---|---|---|---|---|---|
| Quadrant | DetID | PixID | Counts | Sigma | Mean | Median | Sigma |
| A | 11 | 47 | 25299 | 154.49 | 803 | 788 | 158.7 |
| A | 13 | 254 | 10005 | 58.09 | 803 | 788 | 158.7 |
| A | 0 | 226 | 7023 | 39.3 | 803 | 788 | 158.7 |
| B | 0 | 197 | 21623 | 139.46 | 794 | 776 | 149.5 |
| B | 12 | 111 | 18261 | 116.97 | 794 | 776 | 149.5 |
| B | 11 | 111 | 16278 | 103.71 | 794 | 776 | 149.5 |
| C | 14 | 238 | 122074 | 680.19 | 768 | 775 | 178.3 |
| C | 0 | 10 | 31697 | 173.4 | 768 | 775 | 178.3 |
| C | 13 | 61 | 5354 | 25.68 | 768 | 775 | 178.3 |
| D | 12 | 227 | 1310831 | 7010.84 | 778 | 757 | 186.9 |
| D | 2 | 234 | 25116 | 130.36 | 778 | 757 | 186.9 |
| D | 2 | 136 | 22462 | 116.15 | 778 | 757 | 186.9 |
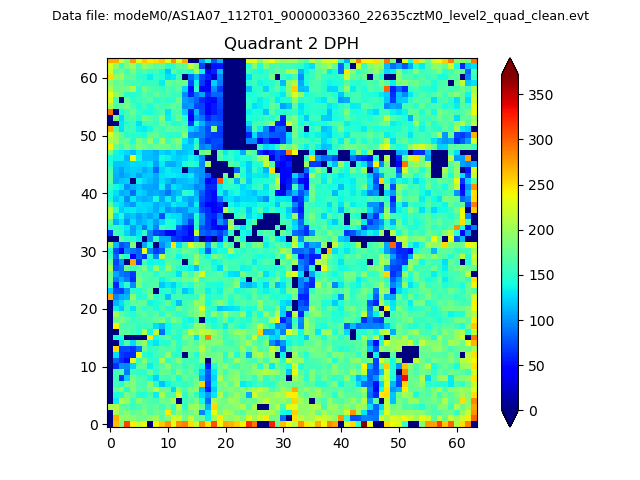
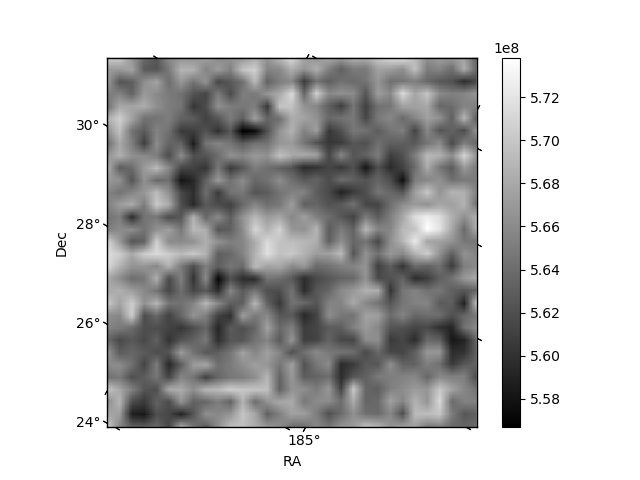
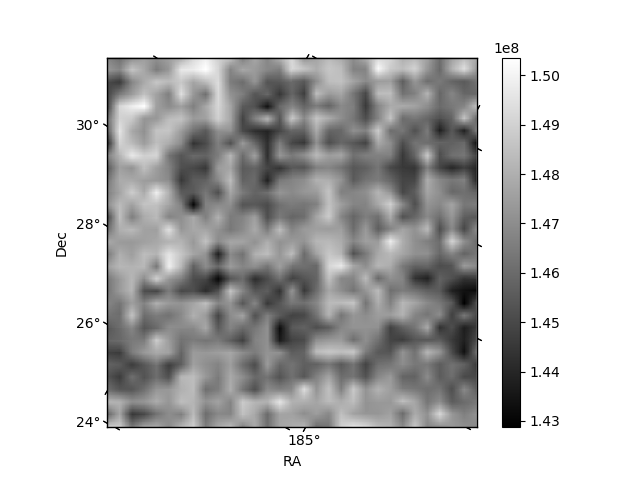
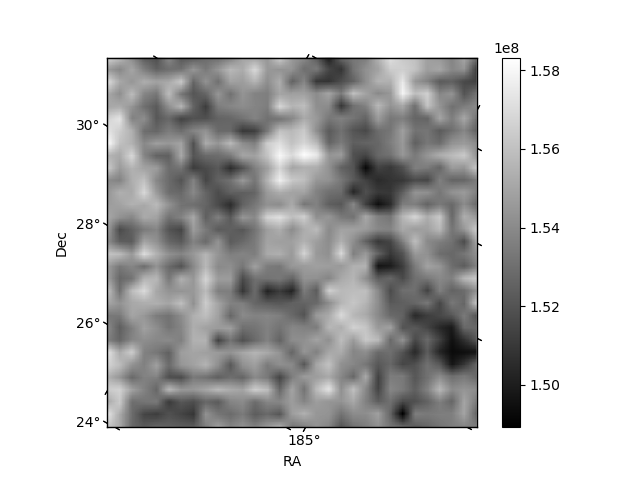
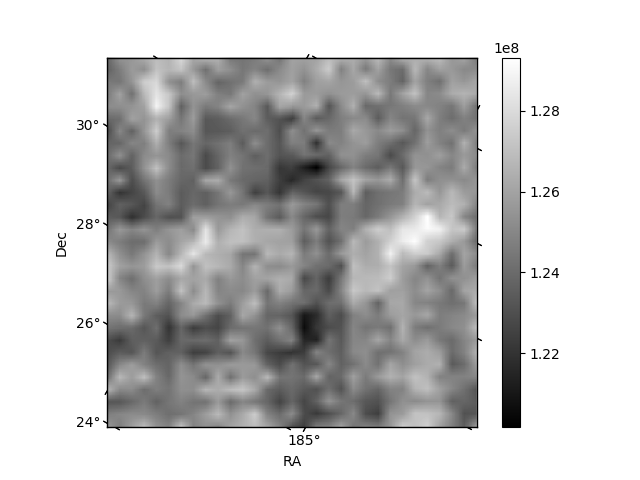
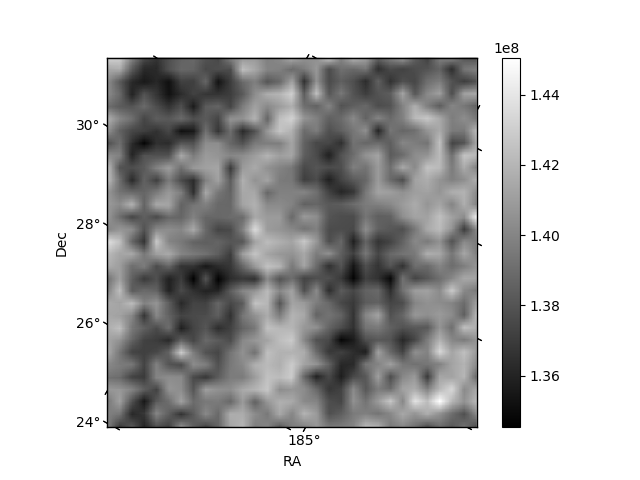
Histogram calculated using DETX and DETY for each event in the final _common_clean file
| Quadrant A | 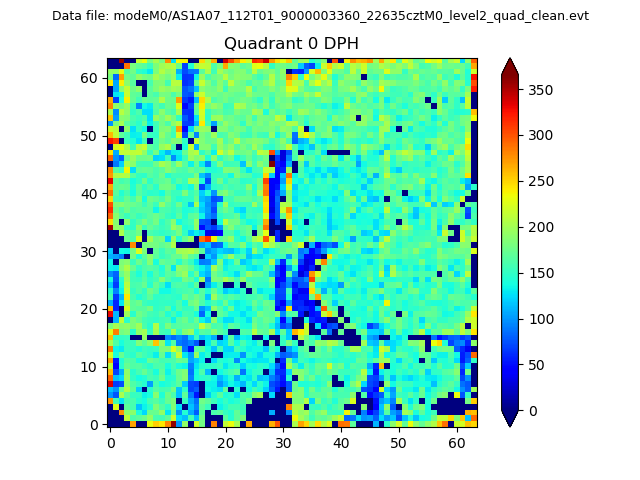 |
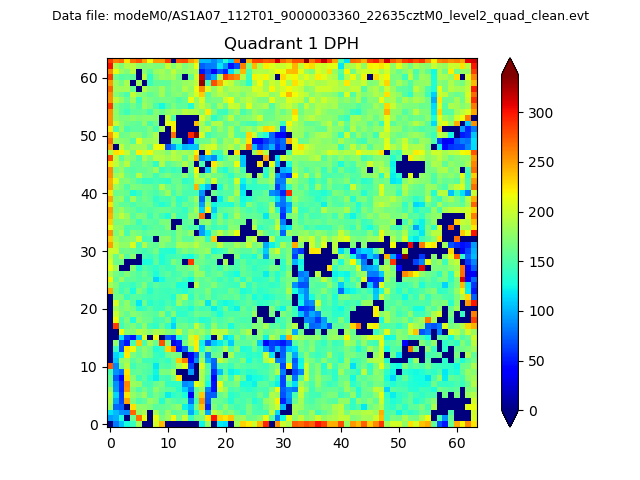 |
Quadrant B |
|---|---|---|---|
| Quadrant D | 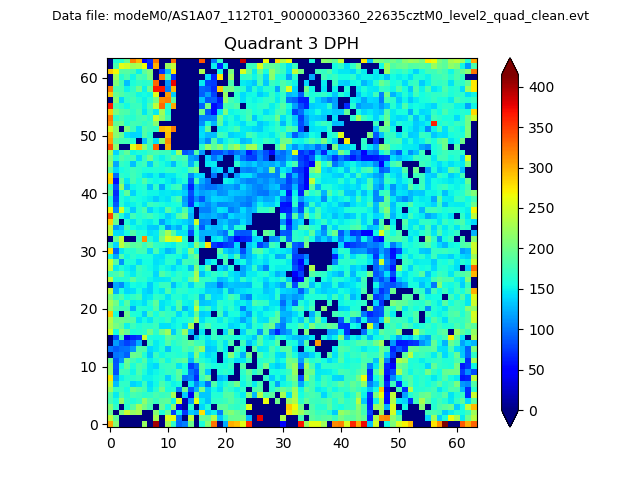 |
 |
Quadrant C |
| Plot type | Count rate plots | Images |
|---|---|---|
| Comparison with Poisson distribution Blue bars denote a histogram of data divided into 1 sec bins. Red curve is a Poisson curve with rate = median count rate of data. |
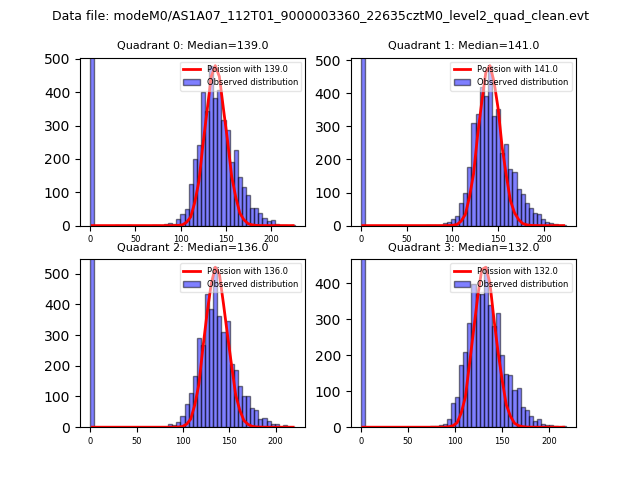 |
 |
| Quadrant-wise count rates Data is divided into 100 sec bins |
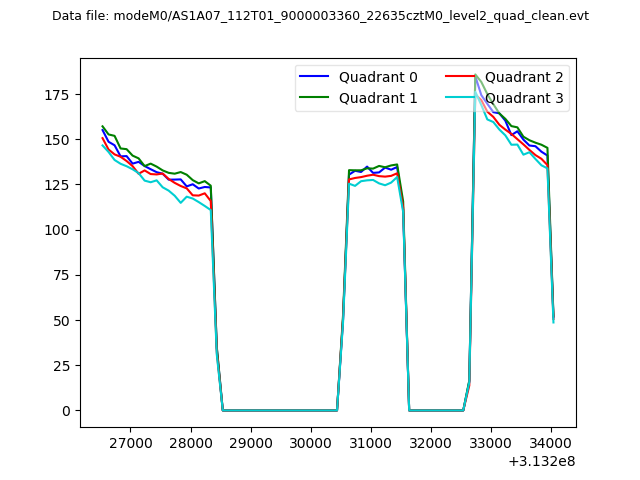 |
|
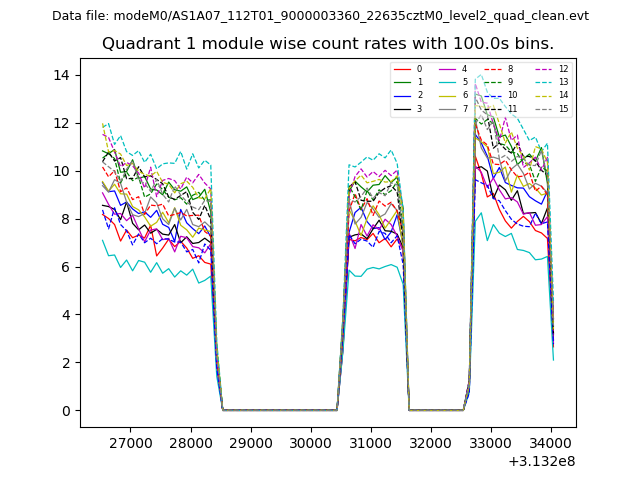
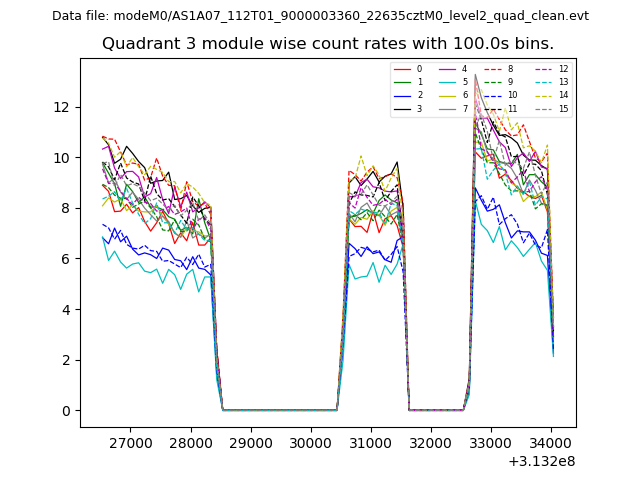
| Module-wise count rates for Quadrant A Data is divided into 100 sec bins |
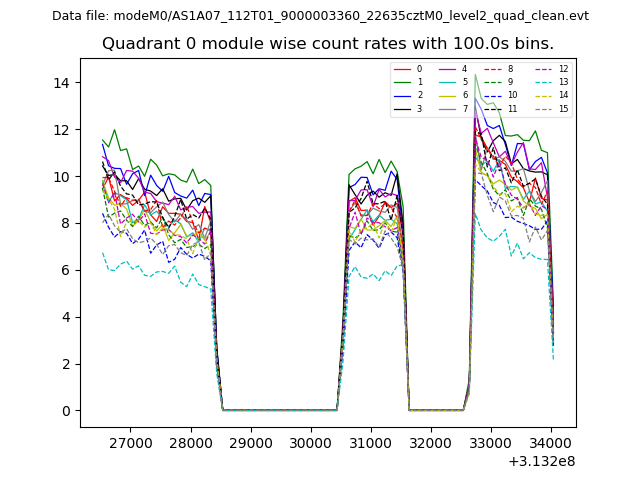 |
 |
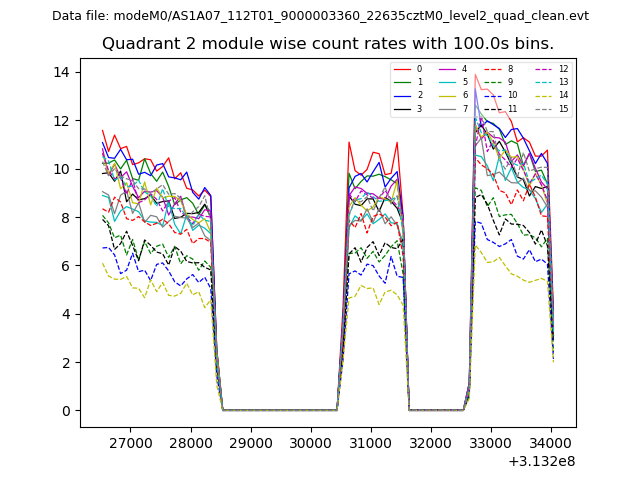
| Module-wise count rates for Quadrant B Data is divided into 100 sec bins |
 |
 |
| Module-wise count rates for Quadrant C Data is divided into 100 sec bins |
 |
 |
| Module-wise count rates for Quadrant D Data is divided into 100 sec bins |
 |
 |
| Parameter | Plot |
|---|---|
| CZT HV Monitor | 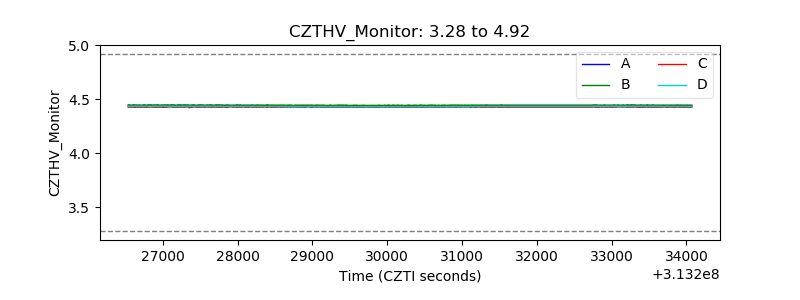 |
| D_VDD | 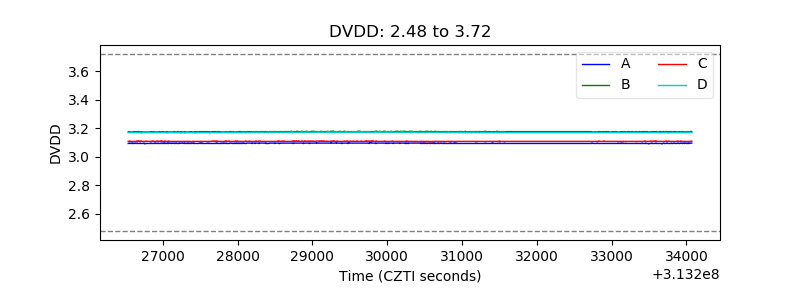 |
| Temperature 1 | 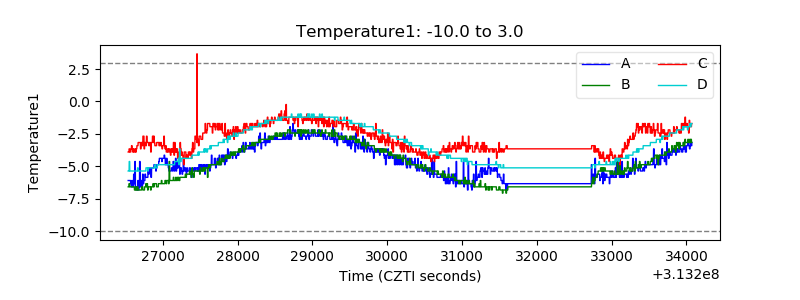 |
| Veto HV Monitor | 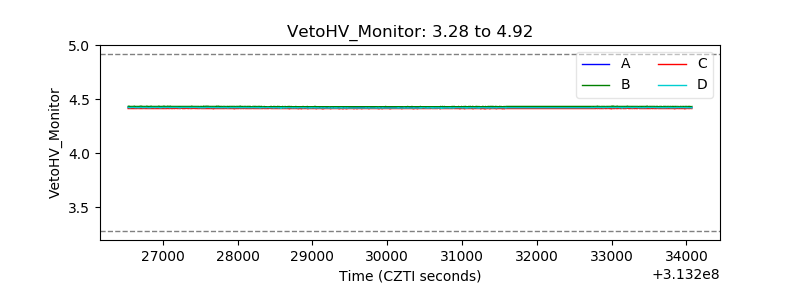 |
| Veto LLD |  |
| Alpha Counter | 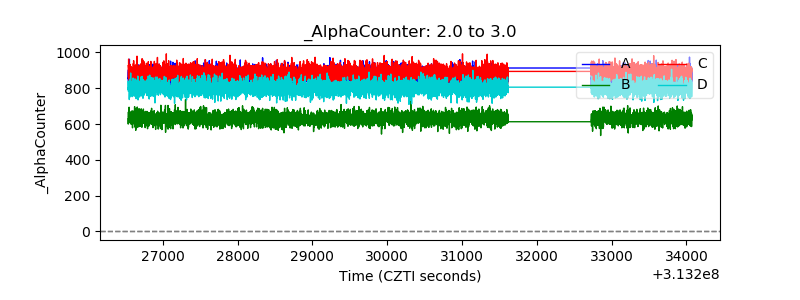 |
| _CPM_Rate | 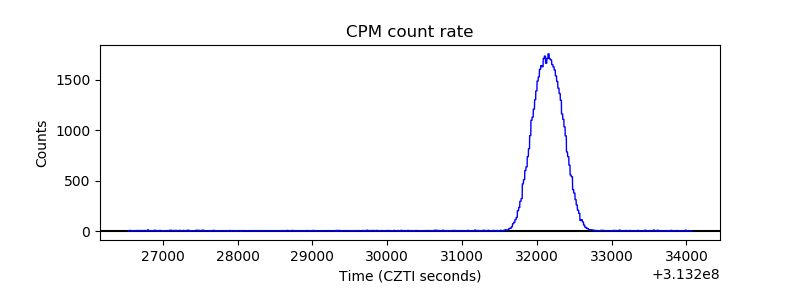 |
| CZT Counter | 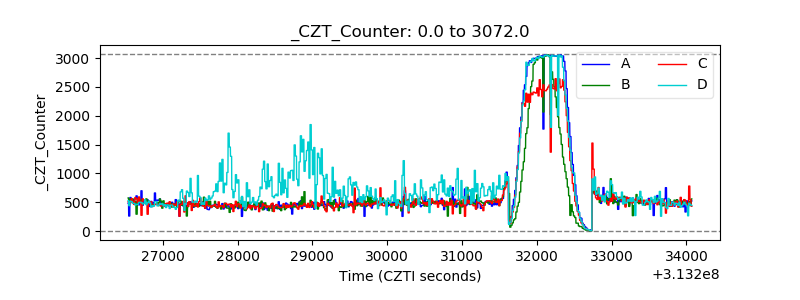 |
| +2.5 Volts monitor |  |
| +5 Volts monitor |  |
| _ROLL_ROT | 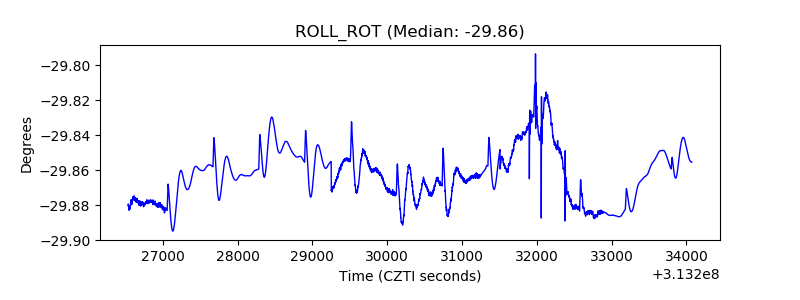 |
| _Roll_DEC | 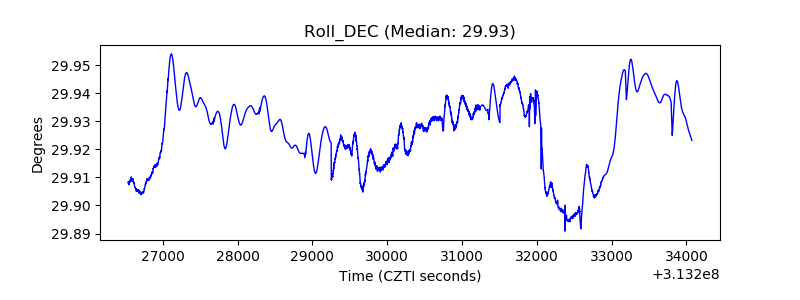 |
| _Roll_RA | 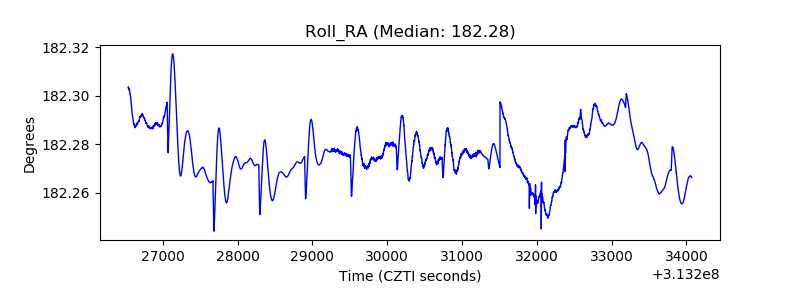 |
| Veto Counter | 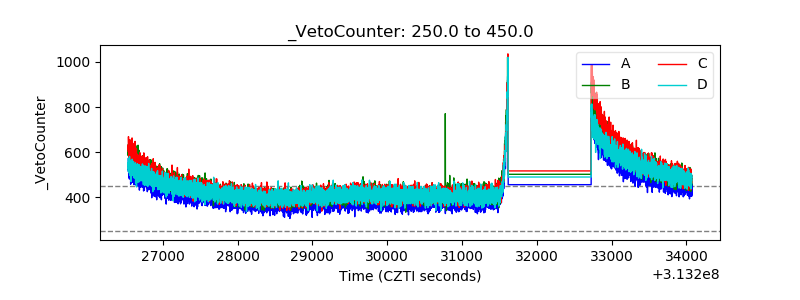 |