| Param | Original file | Final file |
|---|---|---|
| Filename | modeM0/AS1A07_112T01_9000003360_22636cztM0_level2.evt | modeM0/AS1A07_112T01_9000003360_22636cztM0_level2_quad_clean.evt |
| Size (bytes) | 437,676,480 | 94,495,680 |
| Size | 417.4 MB | 90.1 MB |
| Events in quadrant A | 3,145,517 | 615,331 |
| Events in quadrant B | 3,183,530 | 628,597 |
| Events in quadrant C | 3,192,643 | 600,935 |
| Events in quadrant D | 3,315,195 | 587,333 |
| Mode M9 | |||
|---|---|---|---|
| Quadrant | BADHDUFLAG | Total packets | Discarded packets |
| A | 0 | 12 | 0 |
| B | 0 | 12 | 0 |
| C | 0 | 12 | 0 |
| D | 0 | 12 | 0 |
| Mode M0 | |||
|---|---|---|---|
| Quadrant | BADHDUFLAG | Total packets | Discarded packets |
| A | 0 | 13003 | 1 |
| B | 0 | 13083 | 1 |
| C | 0 | 13120 | 1 |
| D | 0 | 13631 | 1 |
| Mode SS | |||
|---|---|---|---|
| Quadrant | BADHDUFLAG | Total packets | Discarded packets |
| A | 0 | 126 | 0 |
| B | 0 | 126 | 0 |
| C | 0 | 126 | 0 |
| D | 0 | 126 | 0 |
| Quadrant | Total seconds | Saturated seconds | Saturation percentage |
|---|---|---|---|
| A | 6151 | 57 | 0.926679% |
| B | 6152 | 64 | 1.040312% |
| C | 6152 | 88 | 1.430429% |
| D | 6152 | 90 | 1.462939% |
Noise dominated data is calculated using 1-second bins in cleaned event files. If a bin has >2000 counts, and if more than 50% of those come from <1% of pixels, then it is considered to be noise-dominated and hence unusable.
| Quadrant | # 1 sec bins | Bins with >0 counts | Bins with >2000 counts | High rate bins dominated by noise | Noise dominated (total time) | Noise dominated (detector-on time) | Marked lightcurve |
|---|---|---|---|---|---|---|---|
| A | 7346 | 6152 | 0 | 0 | 0.00% | 0.00% | 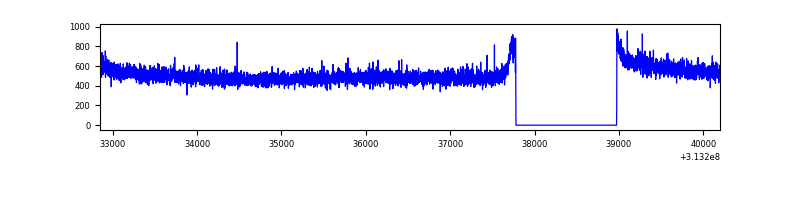 |
| B | 7347 | 6153 | 1 | 1 | 0.01% | 0.02% | 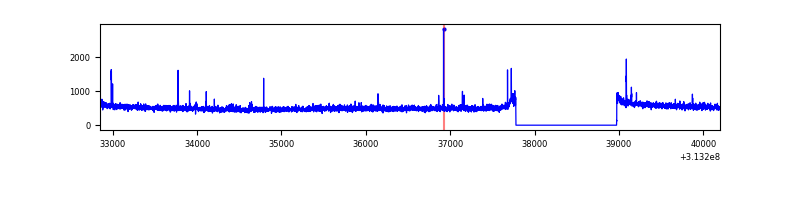 |
| C | 7347 | 6153 | 1 | 1 | 0.01% | 0.02% | 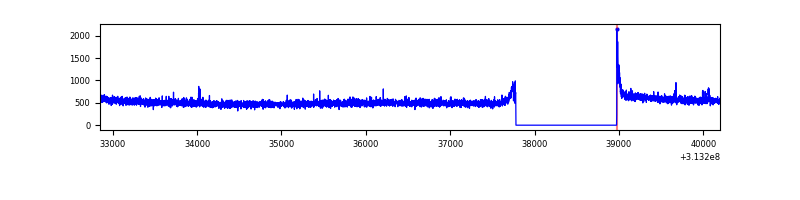 |
| D | 7347 | 6153 | 40 | 40 | 0.54% | 0.65% | 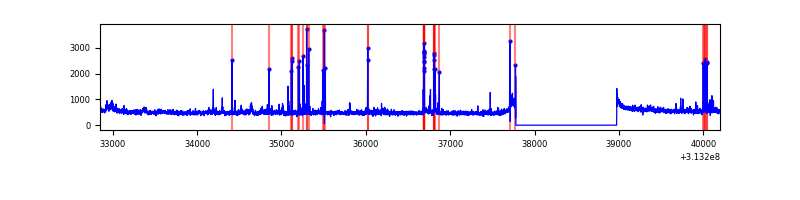 |
Top three noisy pixels from each quadrant. If the there are fewer than three noisy pixels in the level2.evt file, extra rows are filled as -1
| Pixel properties | Quadrant properties | ||||||
|---|---|---|---|---|---|---|---|
| Quadrant | DetID | PixID | Counts | Sigma | Mean | Median | Sigma |
| A | 13 | 254 | 9223 | 52.08 | 814 | 801 | 161.7 |
| A | 11 | 47 | 7680 | 42.54 | 814 | 801 | 161.7 |
| A | 0 | 226 | 6972 | 38.16 | 814 | 801 | 161.7 |
| B | 12 | 111 | 17699 | 112.61 | 801 | 783 | 150.2 |
| B | 11 | 111 | 15885 | 100.53 | 801 | 783 | 150.2 |
| B | 14 | 111 | 13662 | 85.73 | 801 | 783 | 150.2 |
| C | 14 | 238 | 124509 | 688.94 | 779 | 788 | 179.6 |
| C | 0 | 10 | 19959 | 106.75 | 779 | 788 | 179.6 |
| C | 10 | 22 | 8408 | 42.43 | 779 | 788 | 179.6 |
| D | 1 | 52 | 122260 | 640.27 | 791 | 770 | 189.7 |
| D | 12 | 227 | 84939 | 443.58 | 791 | 770 | 189.7 |
| D | 13 | 249 | 60898 | 316.88 | 791 | 770 | 189.7 |
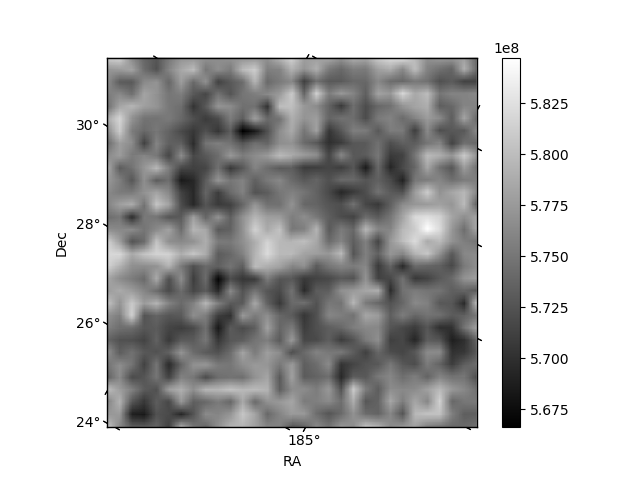
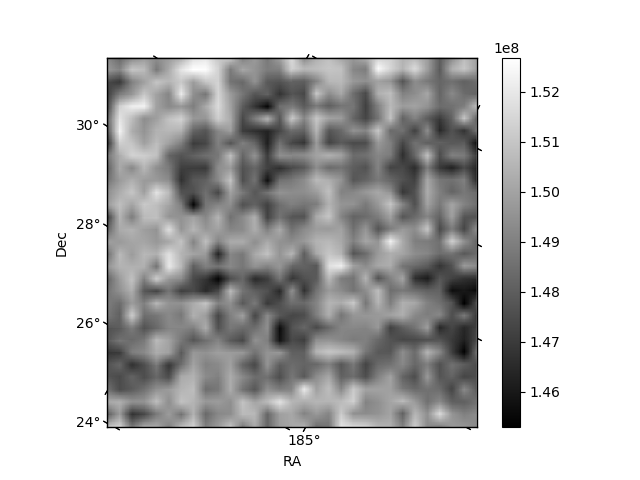
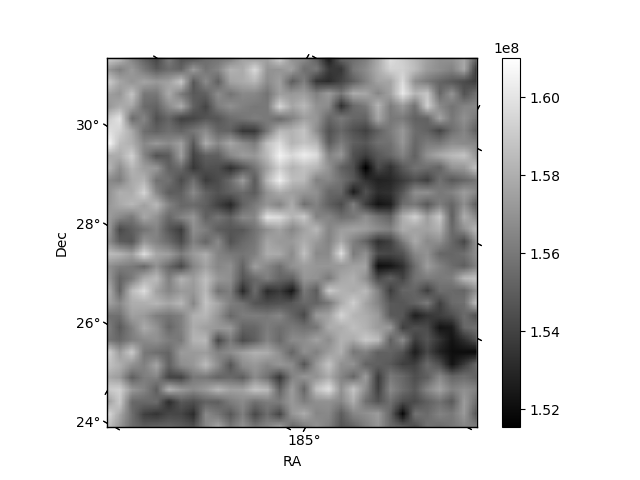
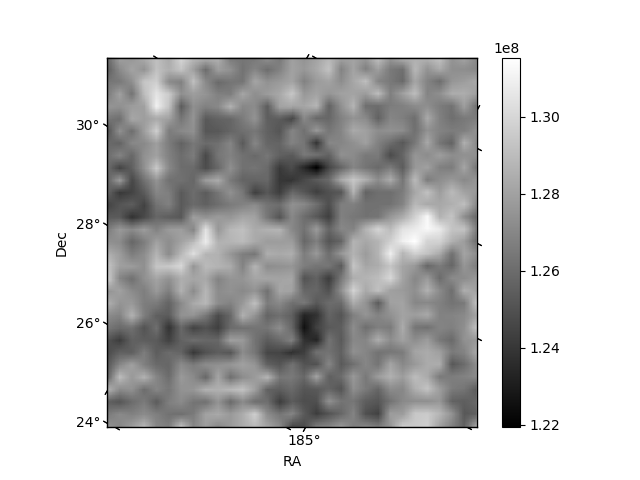
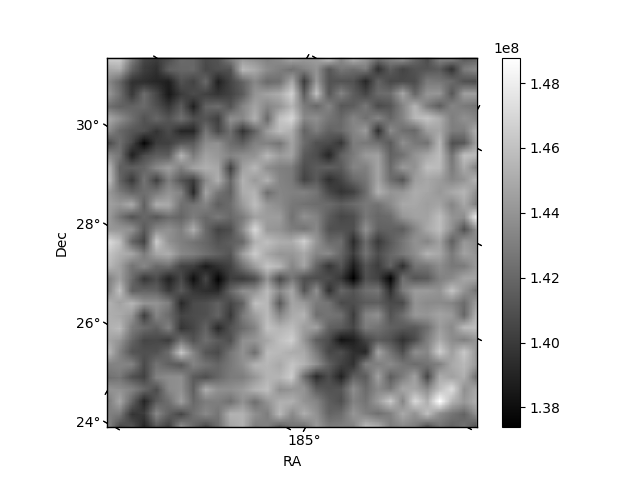
Histogram calculated using DETX and DETY for each event in the final _common_clean file
| Quadrant A | 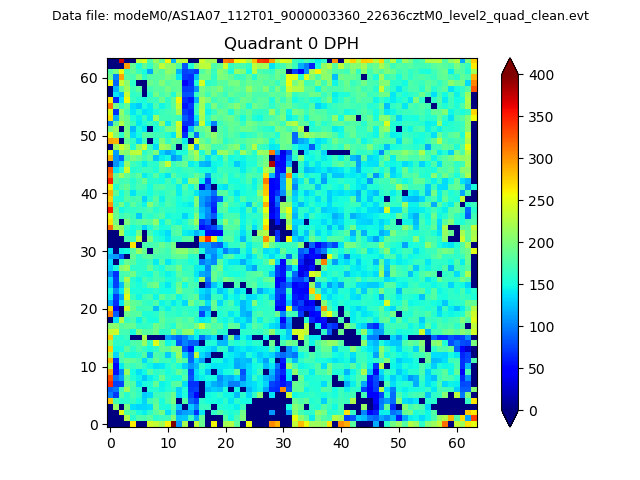 |
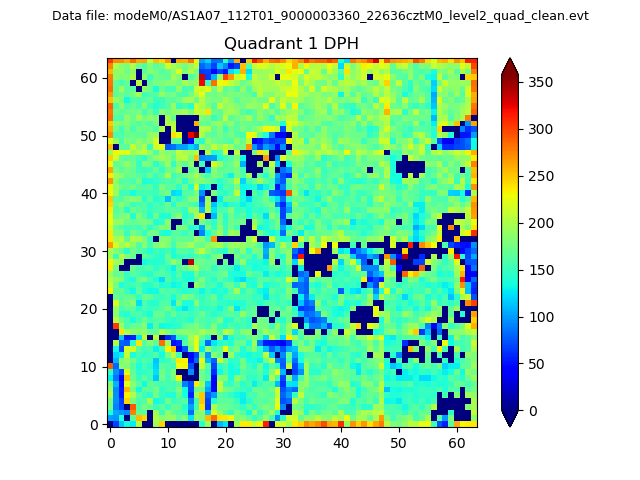 |
Quadrant B |
|---|---|---|---|
| Quadrant D | 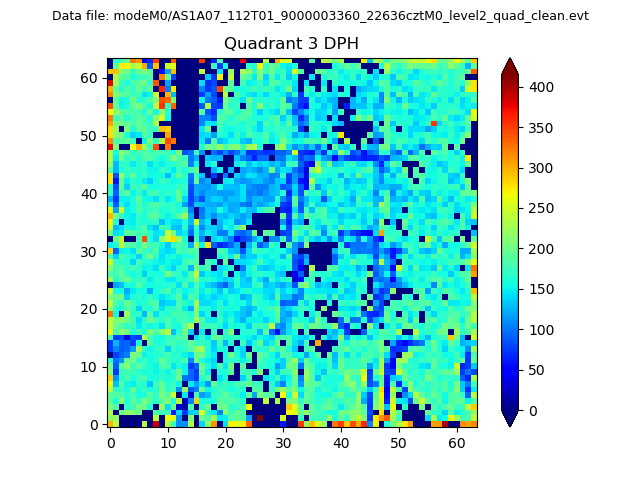 |
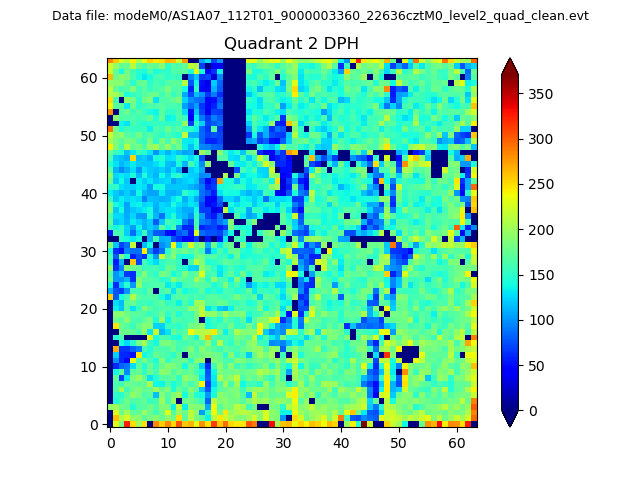 |
Quadrant C |
| Plot type | Count rate plots | Images |
|---|---|---|
| Comparison with Poisson distribution Blue bars denote a histogram of data divided into 1 sec bins. Red curve is a Poisson curve with rate = median count rate of data. |
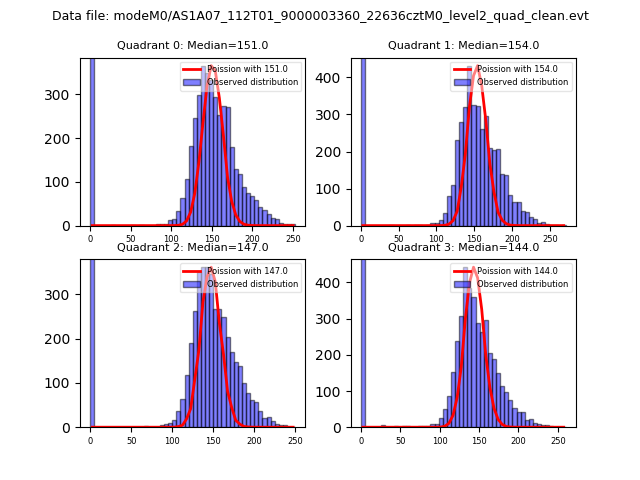 |
 |
| Quadrant-wise count rates Data is divided into 100 sec bins |
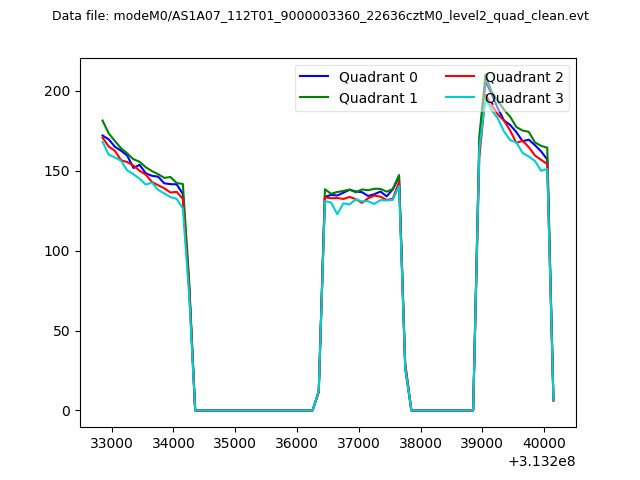 |
|
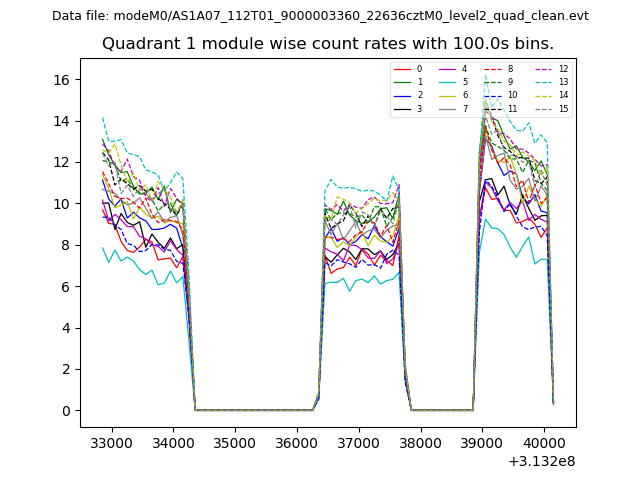
| Module-wise count rates for Quadrant A Data is divided into 100 sec bins |
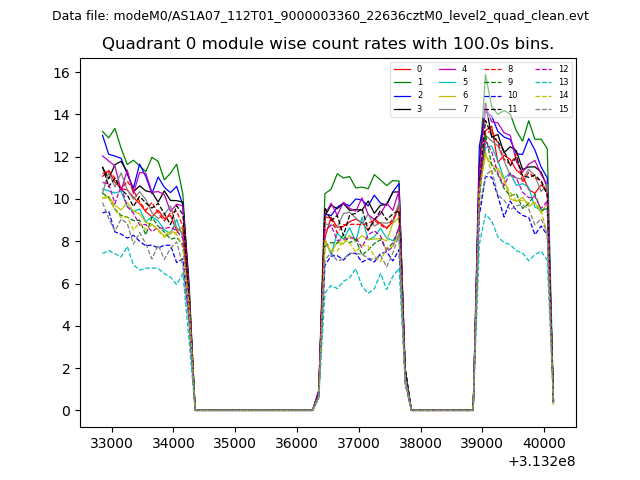 |
 |
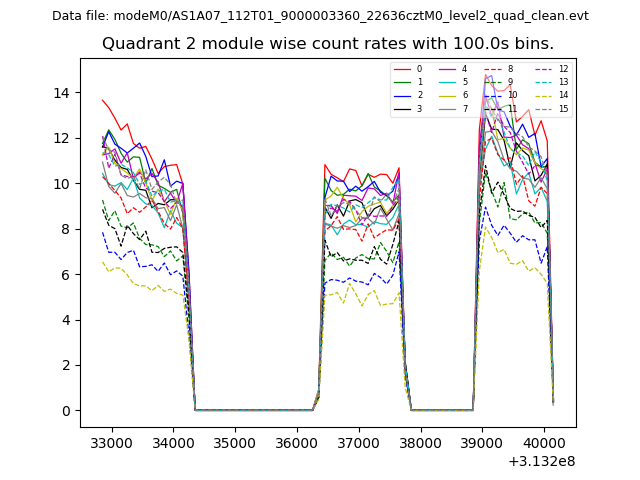
| Module-wise count rates for Quadrant B Data is divided into 100 sec bins |
 |
 |
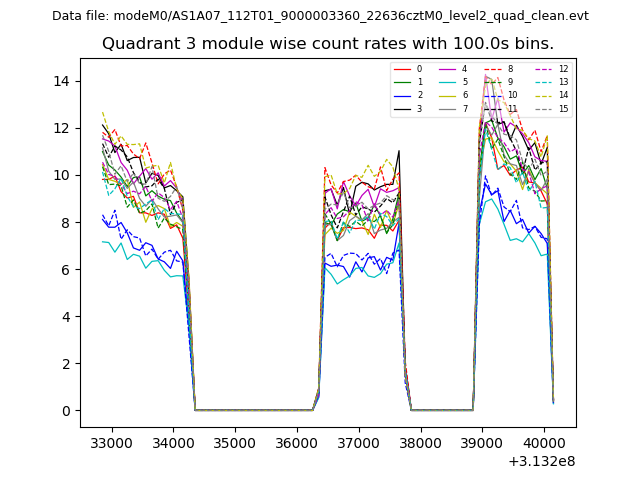
| Module-wise count rates for Quadrant C Data is divided into 100 sec bins |
 |
 |
| Module-wise count rates for Quadrant D Data is divided into 100 sec bins |
 |
 |
| Parameter | Plot |
|---|---|
| CZT HV Monitor | 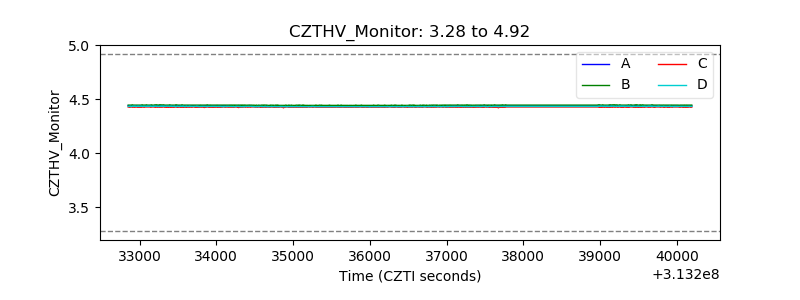 |
| D_VDD | 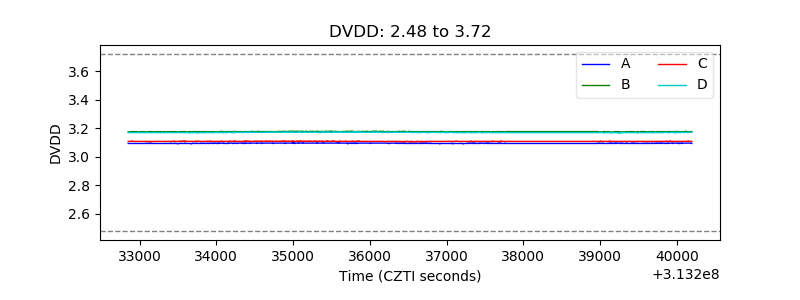 |
| Temperature 1 |  |
| Veto HV Monitor |  |
| Veto LLD | 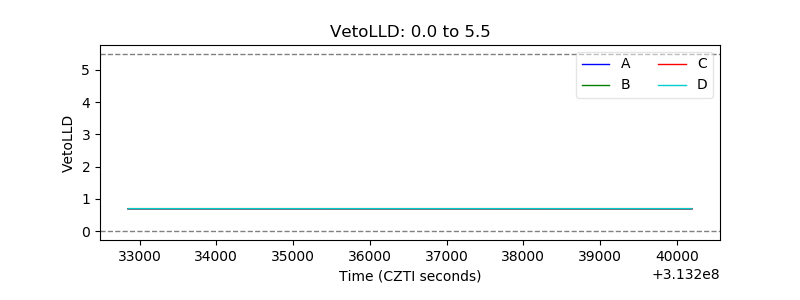 |
| Alpha Counter | 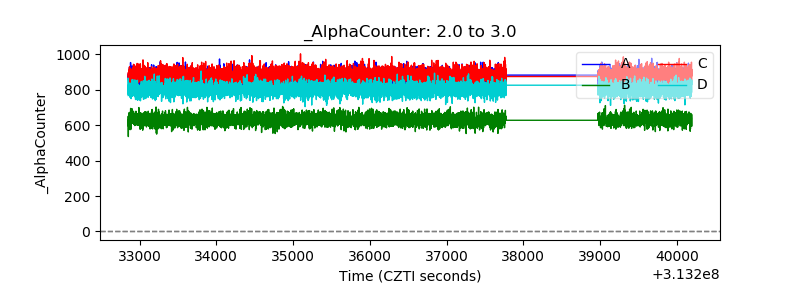 |
| _CPM_Rate |  |
| CZT Counter | 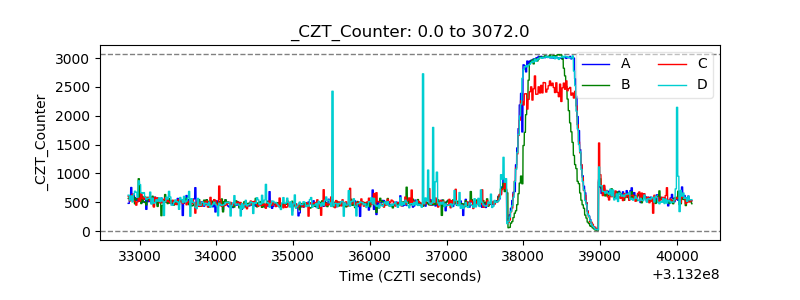 |
| +2.5 Volts monitor |  |
| +5 Volts monitor |  |
| _ROLL_ROT | 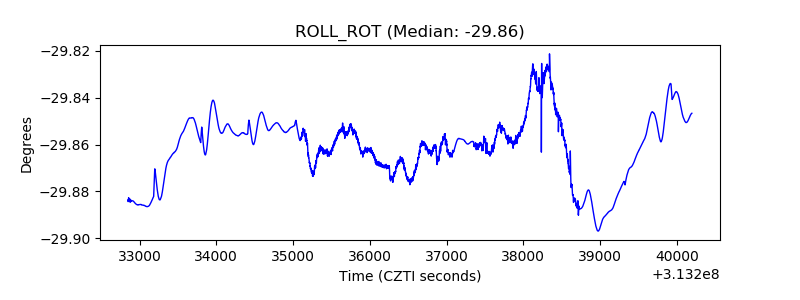 |
| _Roll_DEC |  |
| _Roll_RA | 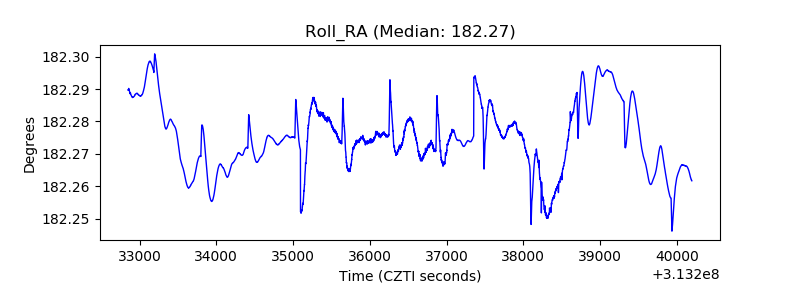 |
| Veto Counter | 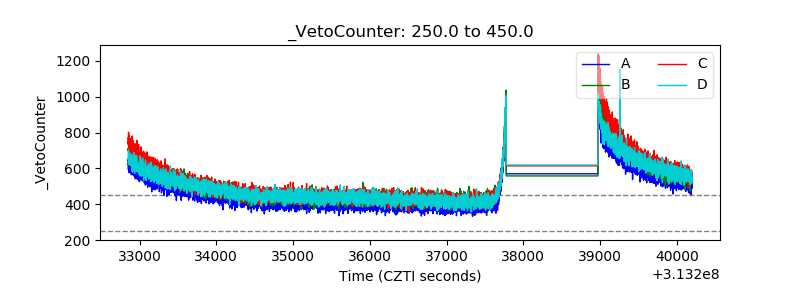 |