| Param | Original file | Final file |
|---|---|---|
| Filename | modeM0/AS1A07_112T01_9000003360_22637cztM0_level2.evt | modeM0/AS1A07_112T01_9000003360_22637cztM0_level2_quad_clean.evt |
| Size (bytes) | 504,259,200 | 82,713,600 |
| Size | 480.9 MB | 78.9 MB |
| Events in quadrant A | 3,242,621 | 540,914 |
| Events in quadrant B | 3,263,453 | 551,861 |
| Events in quadrant C | 3,297,296 | 528,779 |
| Events in quadrant D | 5,058,604 | 461,428 |
| Mode M9 | |||
|---|---|---|---|
| Quadrant | BADHDUFLAG | Total packets | Discarded packets |
| A | 0 | 13 | 0 |
| B | 0 | 13 | 0 |
| C | 0 | 13 | 0 |
| D | 0 | 13 | 0 |
| Mode M0 | |||
|---|---|---|---|
| Quadrant | BADHDUFLAG | Total packets | Discarded packets |
| A | 0 | 13267 | 1 |
| B | 0 | 13299 | 1 |
| C | 0 | 13421 | 1 |
| D | 0 | 18977 | 1 |
| Mode SS | |||
|---|---|---|---|
| Quadrant | BADHDUFLAG | Total packets | Discarded packets |
| A | 0 | 122 | 0 |
| B | 0 | 122 | 0 |
| C | 0 | 122 | 0 |
| D | 0 | 122 | 0 |
| Quadrant | Total seconds | Saturated seconds | Saturation percentage |
|---|---|---|---|
| A | 6038 | 97 | 1.606492% |
| B | 6038 | 95 | 1.573369% |
| C | 6039 | 132 | 2.185792% |
| D | 6039 | 633 | 10.481868% |
Noise dominated data is calculated using 1-second bins in cleaned event files. If a bin has >2000 counts, and if more than 50% of those come from <1% of pixels, then it is considered to be noise-dominated and hence unusable.
| Quadrant | # 1 sec bins | Bins with >0 counts | Bins with >2000 counts | High rate bins dominated by noise | Noise dominated (total time) | Noise dominated (detector-on time) | Marked lightcurve |
|---|---|---|---|---|---|---|---|
| A | 7293 | 6039 | 0 | 0 | 0.00% | 0.00% | 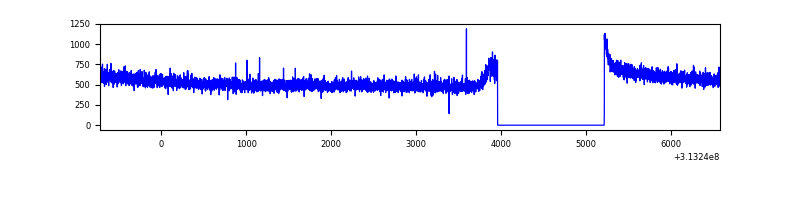 |
| B | 7293 | 6039 | 1 | 1 | 0.01% | 0.02% | 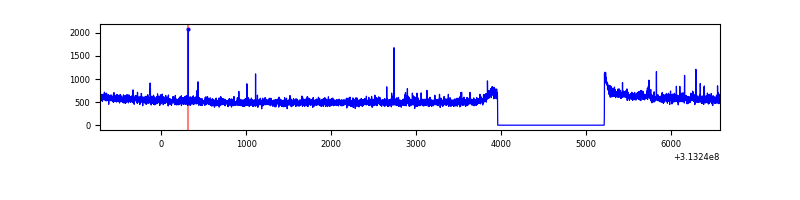 |
| C | 7294 | 6040 | 1 | 1 | 0.01% | 0.02% | 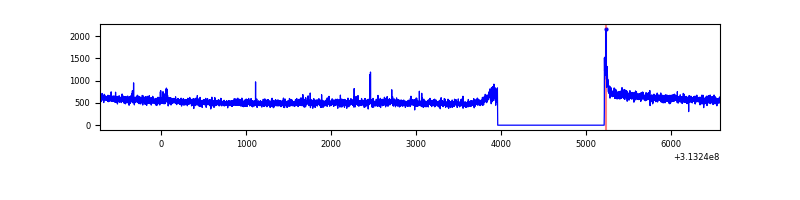 |
| D | 7294 | 6040 | 447 | 447 | 6.13% | 7.40% | 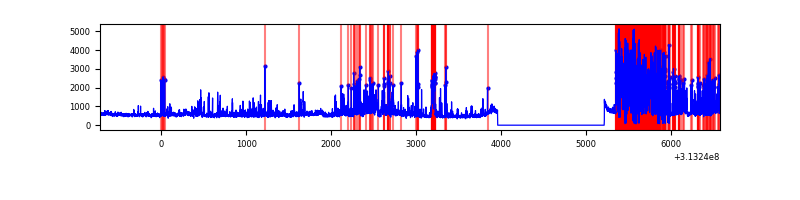 |
Top three noisy pixels from each quadrant. If the there are fewer than three noisy pixels in the level2.evt file, extra rows are filled as -1
| Pixel properties | Quadrant properties | ||||||
|---|---|---|---|---|---|---|---|
| Quadrant | DetID | PixID | Counts | Sigma | Mean | Median | Sigma |
| A | 11 | 47 | 9530 | 53.11 | 839 | 825 | 163.9 |
| A | 13 | 254 | 9473 | 52.76 | 839 | 825 | 163.9 |
| A | 0 | 226 | 7477 | 40.58 | 839 | 825 | 163.9 |
| B | 12 | 111 | 17660 | 110.86 | 825 | 808 | 152.0 |
| B | 11 | 111 | 15917 | 99.39 | 825 | 808 | 152.0 |
| B | 14 | 111 | 13936 | 86.36 | 825 | 808 | 152.0 |
| C | 14 | 238 | 129742 | 695.94 | 805 | 814 | 185.3 |
| C | 0 | 10 | 17667 | 90.97 | 805 | 814 | 185.3 |
| C | 10 | 22 | 10216 | 50.75 | 805 | 814 | 185.3 |
| D | 7 | 238 | 1008288 | 5404.08 | 778 | 758 | 186.4 |
| D | 1 | 52 | 979231 | 5248.23 | 778 | 758 | 186.4 |
| D | 13 | 249 | 97856 | 520.8 | 778 | 758 | 186.4 |
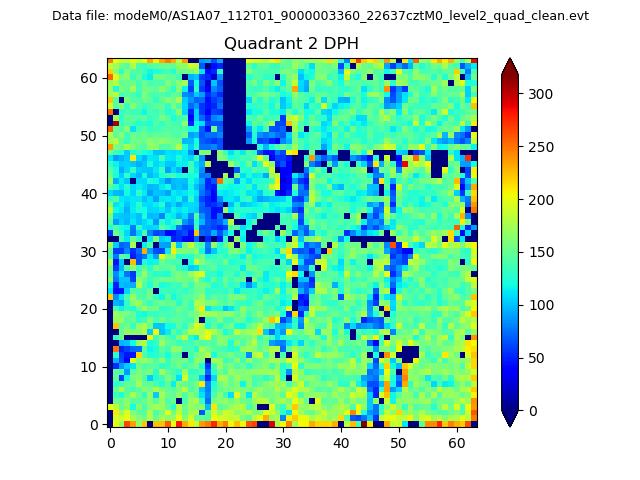
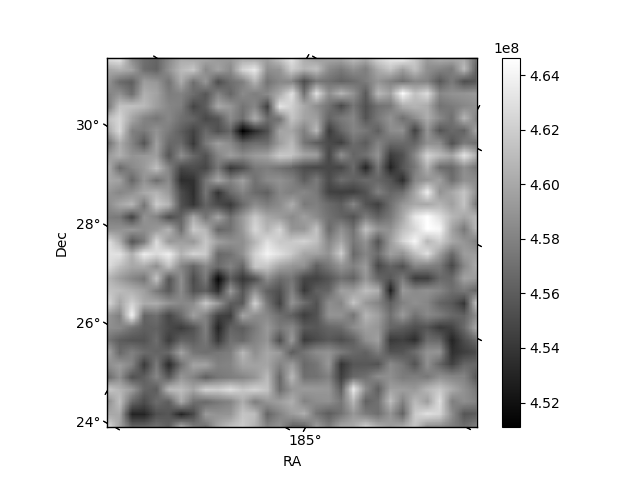
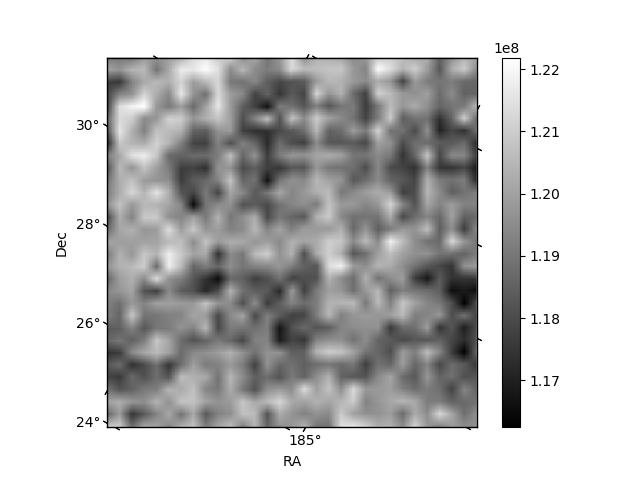
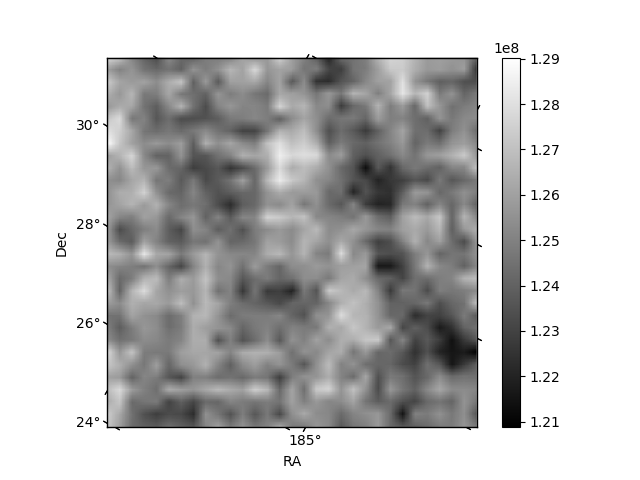
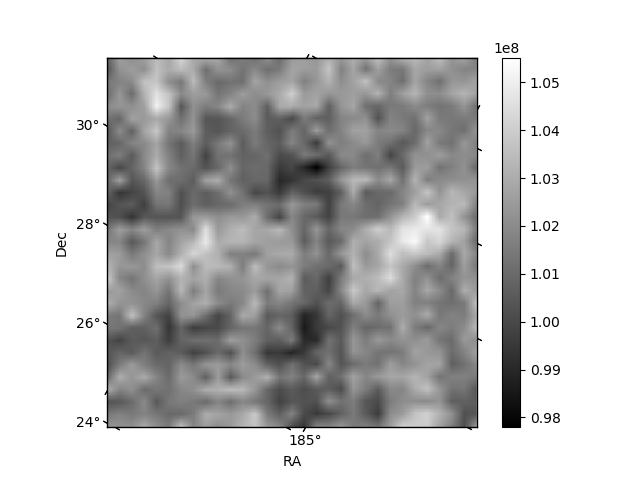
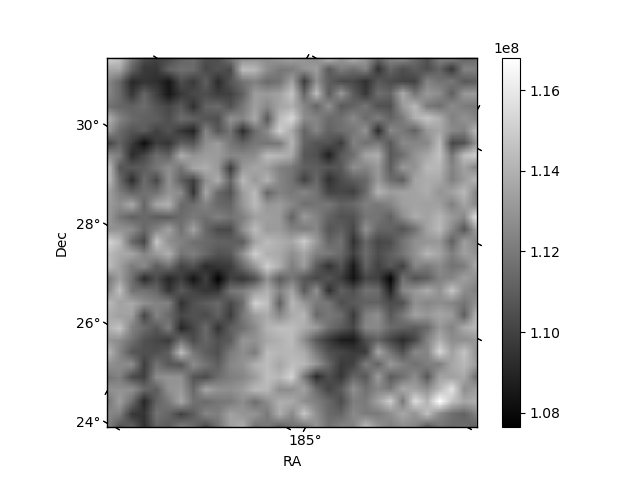
Histogram calculated using DETX and DETY for each event in the final _common_clean file
| Quadrant A | 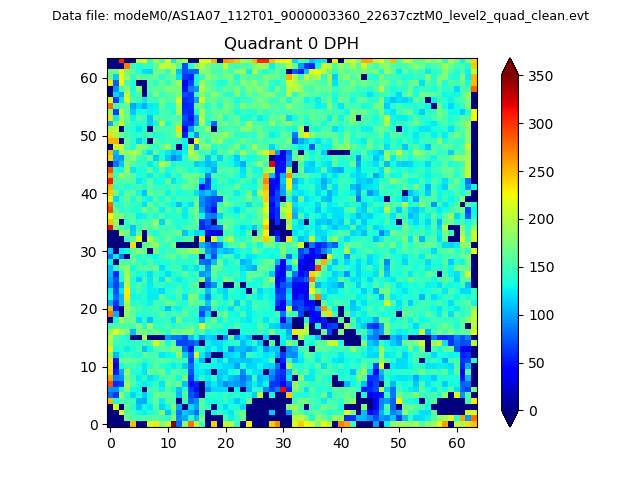 |
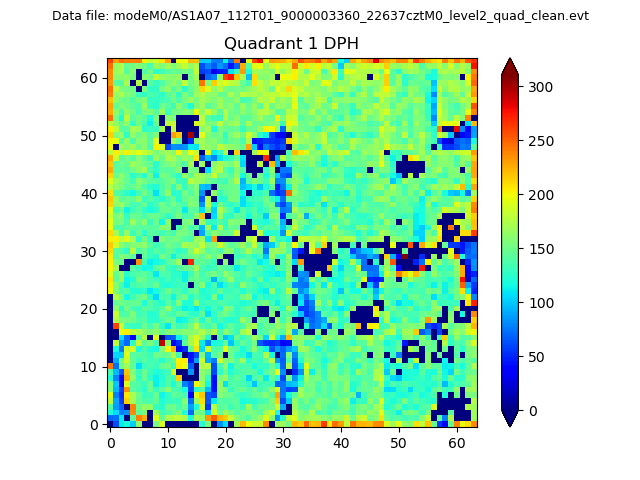 |
Quadrant B |
|---|---|---|---|
| Quadrant D | 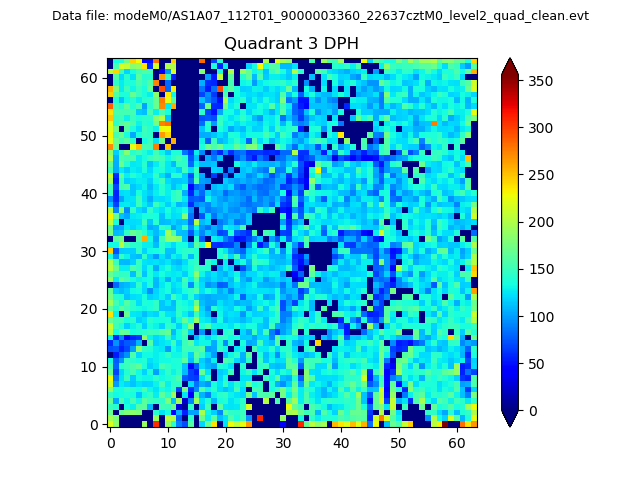 |
 |
Quadrant C |
| Plot type | Count rate plots | Images |
|---|---|---|
| Comparison with Poisson distribution Blue bars denote a histogram of data divided into 1 sec bins. Red curve is a Poisson curve with rate = median count rate of data. |
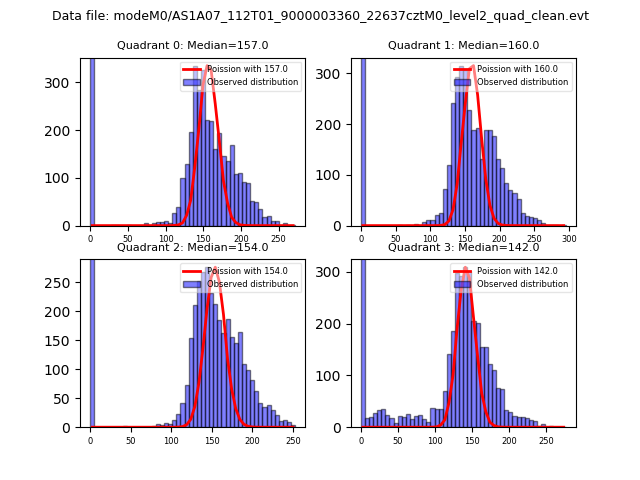 |
 |
| Quadrant-wise count rates Data is divided into 100 sec bins |
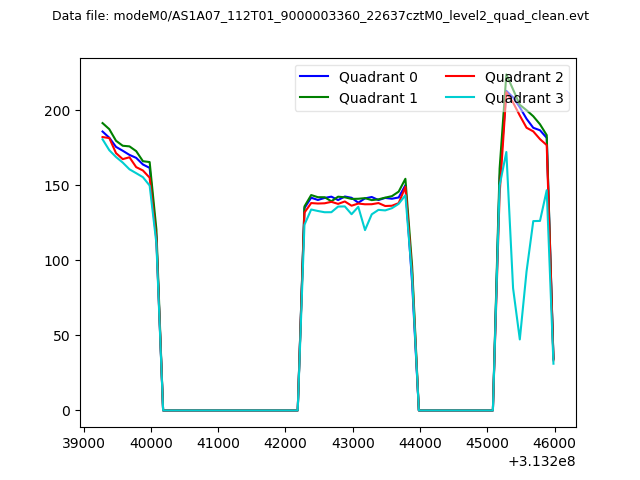 |
|
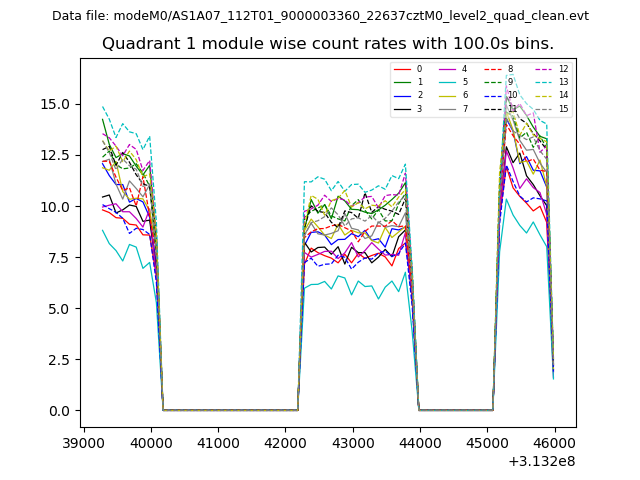
| Module-wise count rates for Quadrant A Data is divided into 100 sec bins |
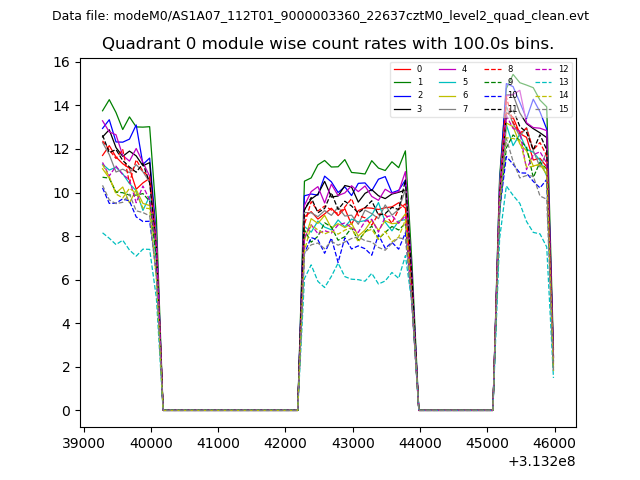 |
 |
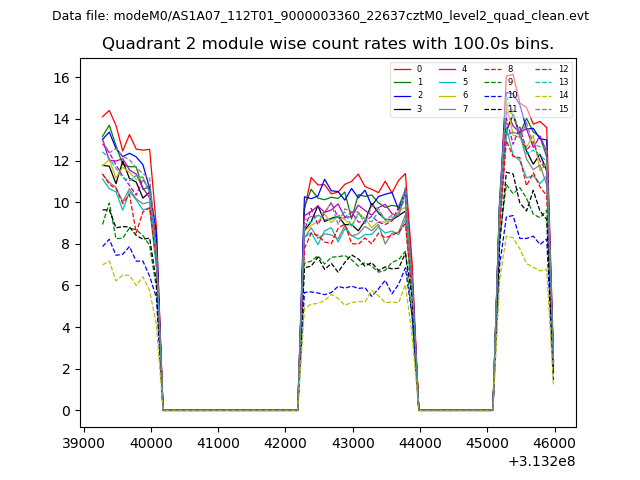
| Module-wise count rates for Quadrant B Data is divided into 100 sec bins |
 |
 |
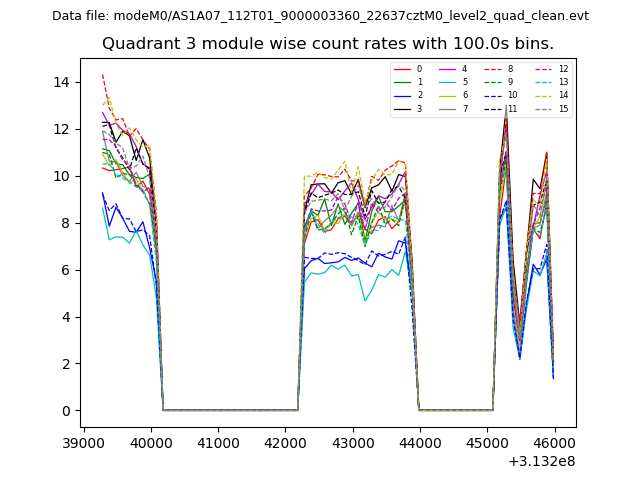
| Module-wise count rates for Quadrant C Data is divided into 100 sec bins |
 |
 |
| Module-wise count rates for Quadrant D Data is divided into 100 sec bins |
 |
 |
| Parameter | Plot |
|---|---|
| CZT HV Monitor | 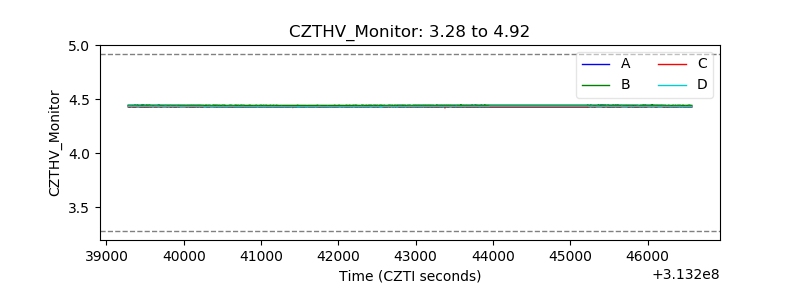 |
| D_VDD | 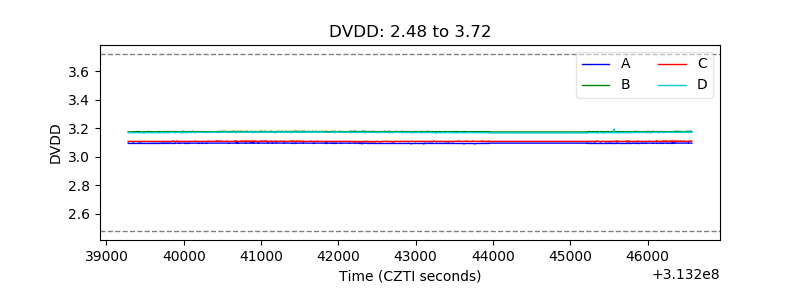 |
| Temperature 1 | 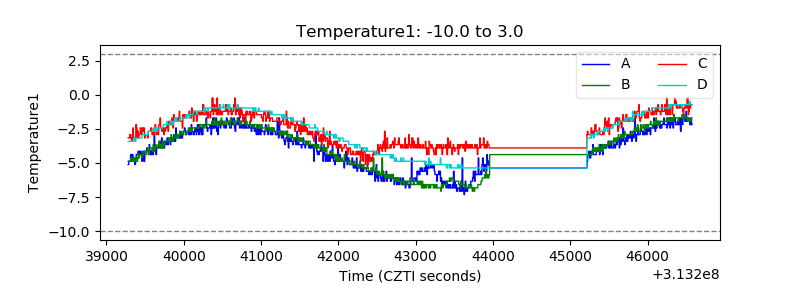 |
| Veto HV Monitor | 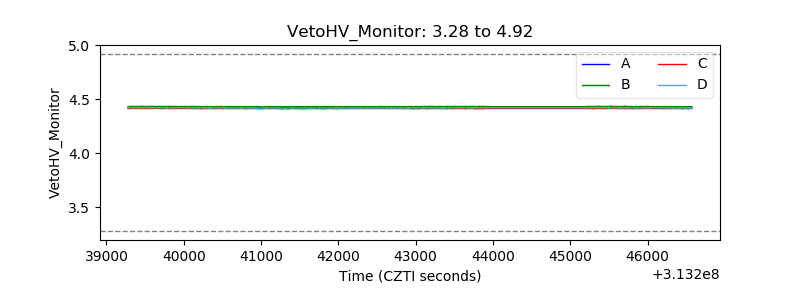 |
| Veto LLD | 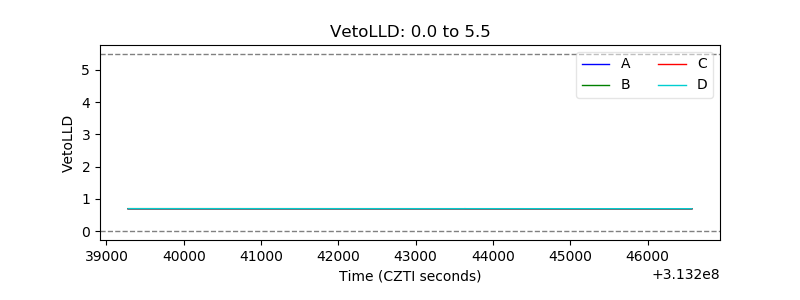 |
| Alpha Counter | 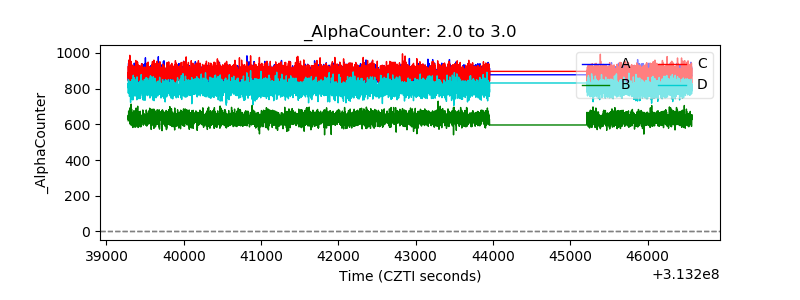 |
| _CPM_Rate | 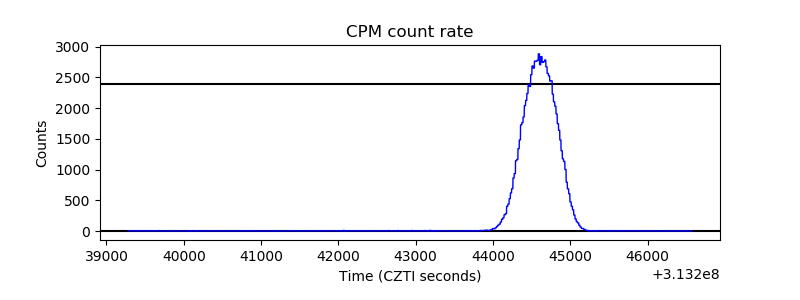 |
| CZT Counter | 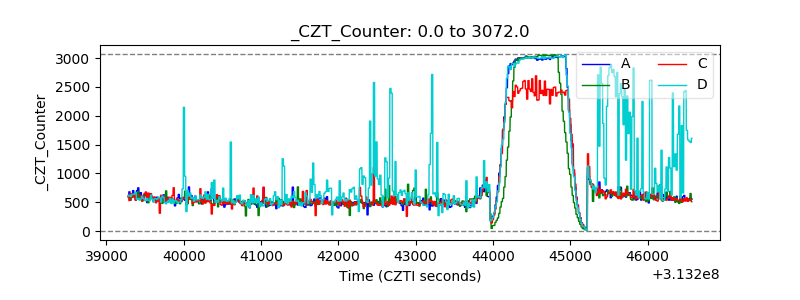 |
| +2.5 Volts monitor |  |
| +5 Volts monitor |  |
| _ROLL_ROT | 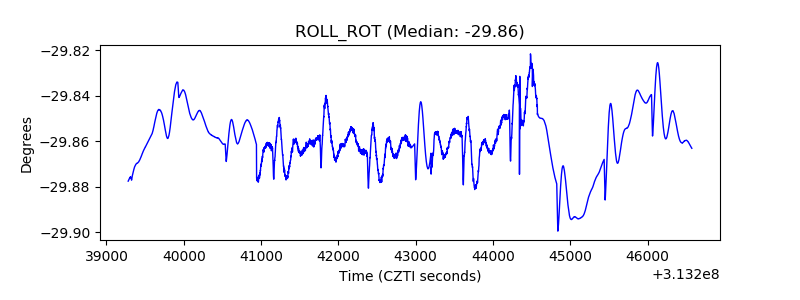 |
| _Roll_DEC | 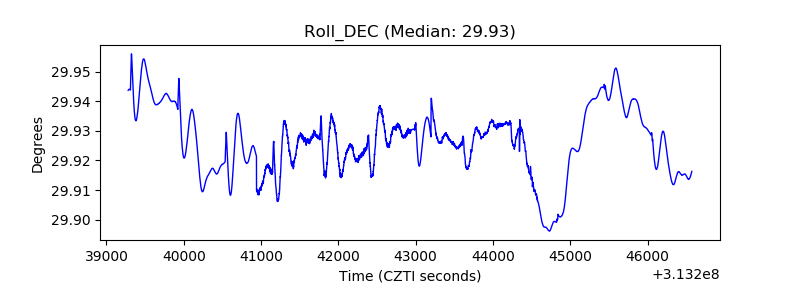 |
| _Roll_RA | 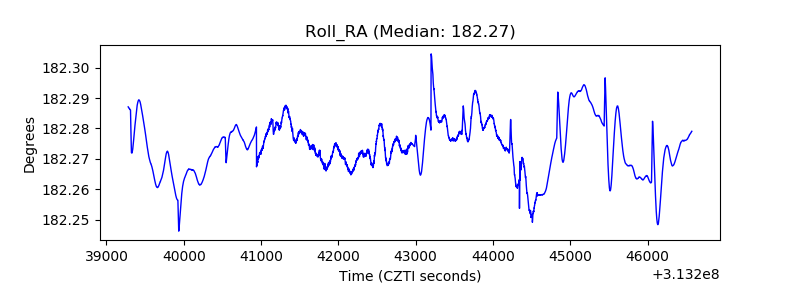 |
| Veto Counter | 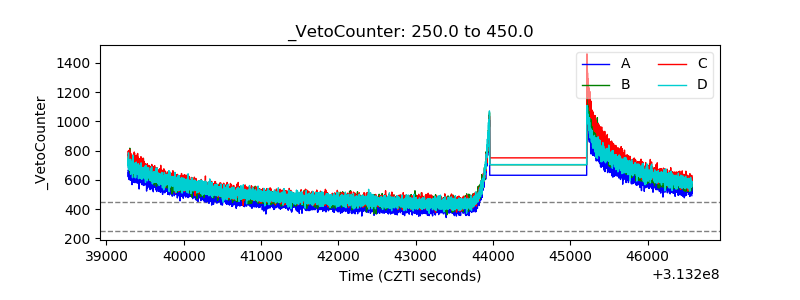 |