| Param | Original file | Final file |
|---|---|---|
| Filename | modeM0/AS1A07_112T01_9000003360_22638cztM0_level2.evt | modeM0/AS1A07_112T01_9000003360_22638cztM0_level2_quad_clean.evt |
| Size (bytes) | 521,902,080 | 71,562,240 |
| Size | 497.7 MB | 68.2 MB |
| Events in quadrant A | 3,343,564 | 446,798 |
| Events in quadrant B | 3,392,769 | 452,646 |
| Events in quadrant C | 3,421,732 | 437,273 |
| Events in quadrant D | 5,234,336 | 404,122 |
| Mode M9 | |||
|---|---|---|---|
| Quadrant | BADHDUFLAG | Total packets | Discarded packets |
| A | 0 | 13 | 0 |
| B | 0 | 13 | 0 |
| C | 0 | 13 | 0 |
| D | 0 | 13 | 0 |
| Mode M0 | |||
|---|---|---|---|
| Quadrant | BADHDUFLAG | Total packets | Discarded packets |
| A | 0 | 13617 | 1 |
| B | 0 | 13749 | 1 |
| C | 0 | 13857 | 1 |
| D | 0 | 19851 | 1 |
| Mode SS | |||
|---|---|---|---|
| Quadrant | BADHDUFLAG | Total packets | Discarded packets |
| A | 0 | 124 | 0 |
| B | 0 | 124 | 0 |
| C | 0 | 124 | 0 |
| D | 0 | 124 | 0 |
| Quadrant | Total seconds | Saturated seconds | Saturation percentage |
|---|---|---|---|
| A | 6099 | 103 | 1.688801% |
| B | 6099 | 125 | 2.049516% |
| C | 6099 | 150 | 2.459420% |
| D | 6100 | 459 | 7.524590% |
Noise dominated data is calculated using 1-second bins in cleaned event files. If a bin has >2000 counts, and if more than 50% of those come from <1% of pixels, then it is considered to be noise-dominated and hence unusable.
| Quadrant | # 1 sec bins | Bins with >0 counts | Bins with >2000 counts | High rate bins dominated by noise | Noise dominated (total time) | Noise dominated (detector-on time) | Marked lightcurve |
|---|---|---|---|---|---|---|---|
| A | 7404 | 6100 | 0 | 0 | 0.00% | 0.00% | 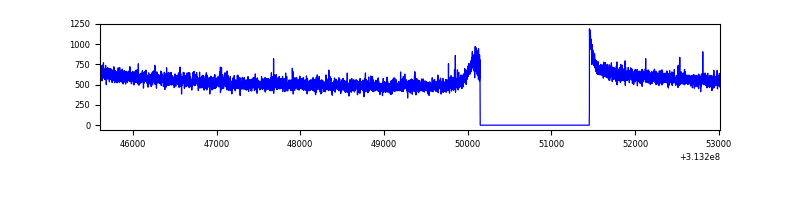 |
| B | 7404 | 6100 | 1 | 1 | 0.01% | 0.02% | 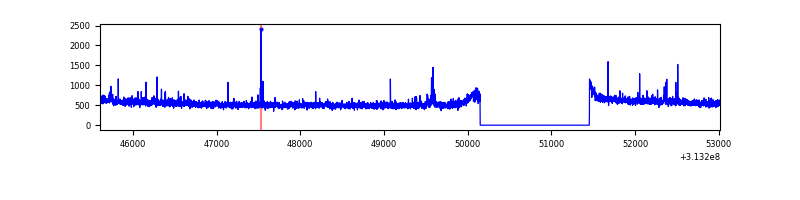 |
| C | 7404 | 6100 | 2 | 2 | 0.03% | 0.03% | 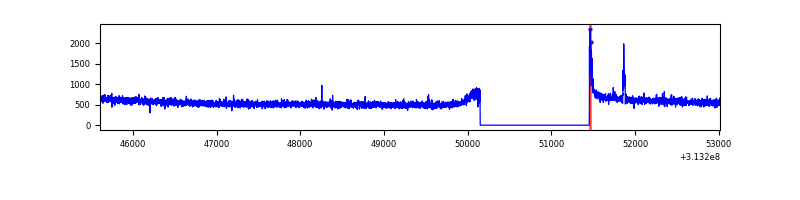 |
| D | 7405 | 6101 | 313 | 313 | 4.23% | 5.13% | 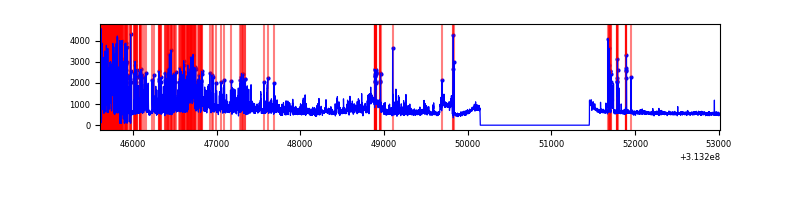 |
Top three noisy pixels from each quadrant. If the there are fewer than three noisy pixels in the level2.evt file, extra rows are filled as -1
| Pixel properties | Quadrant properties | ||||||
|---|---|---|---|---|---|---|---|
| Quadrant | DetID | PixID | Counts | Sigma | Mean | Median | Sigma |
| A | 11 | 47 | 10478 | 56.31 | 865 | 849 | 171.0 |
| A | 13 | 254 | 9834 | 52.55 | 865 | 849 | 171.0 |
| A | 0 | 226 | 7700 | 40.07 | 865 | 849 | 171.0 |
| B | 0 | 229 | 25134 | 153.46 | 851 | 831 | 158.4 |
| B | 12 | 111 | 17917 | 107.89 | 851 | 831 | 158.4 |
| B | 11 | 111 | 15964 | 95.56 | 851 | 831 | 158.4 |
| C | 14 | 238 | 134451 | 696.91 | 830 | 836 | 191.7 |
| C | 0 | 10 | 31477 | 159.82 | 830 | 836 | 191.7 |
| C | 10 | 22 | 22114 | 110.98 | 830 | 836 | 191.7 |
| D | 1 | 52 | 1482205 | 7463.72 | 828 | 808 | 198.5 |
| D | 7 | 238 | 575800 | 2896.98 | 828 | 808 | 198.5 |
| D | 12 | 227 | 26088 | 127.37 | 828 | 808 | 198.5 |
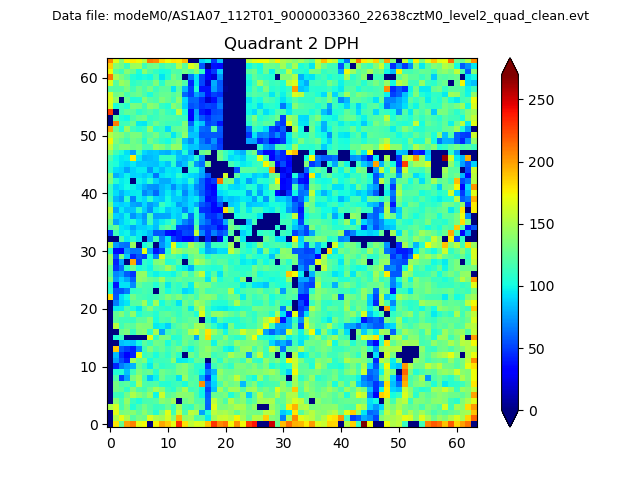
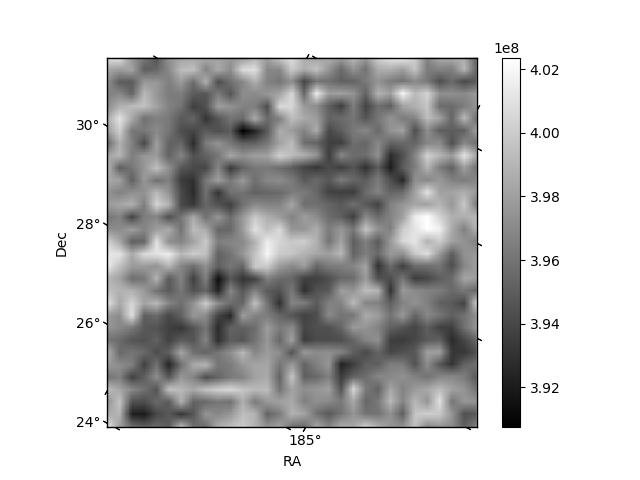
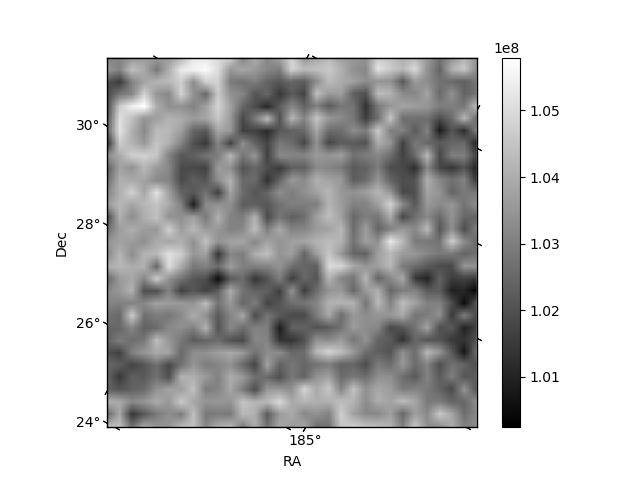
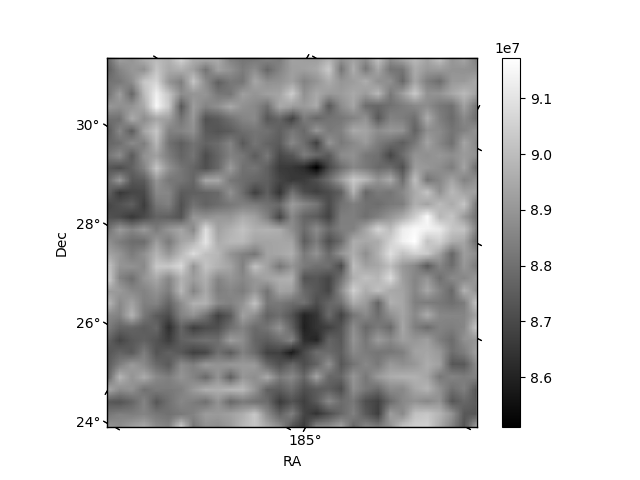
Histogram calculated using DETX and DETY for each event in the final _common_clean file
| Quadrant A | 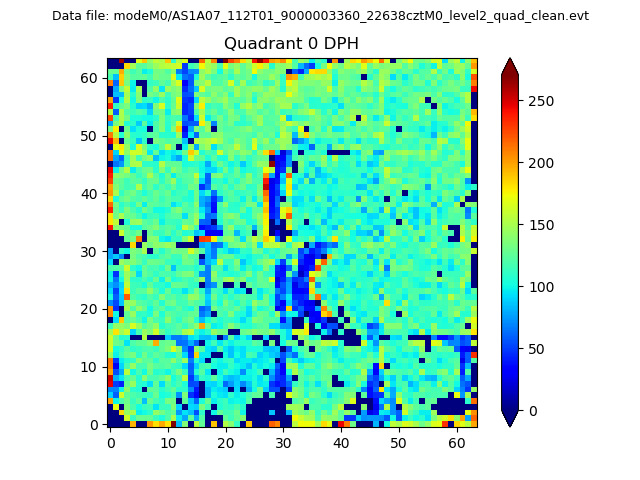 |
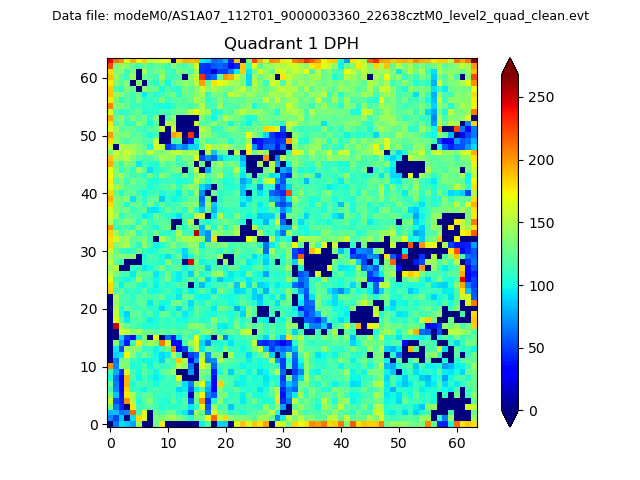 |
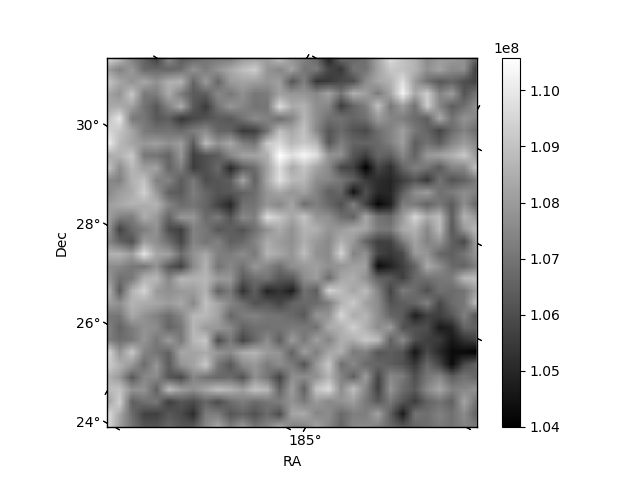
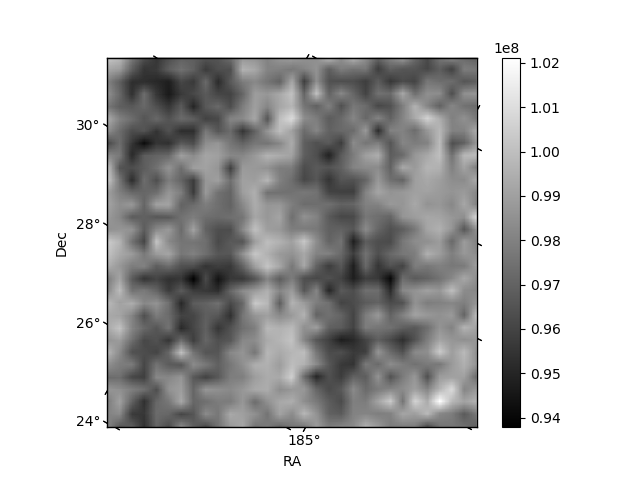
Quadrant B |
|---|---|---|---|
| Quadrant D | 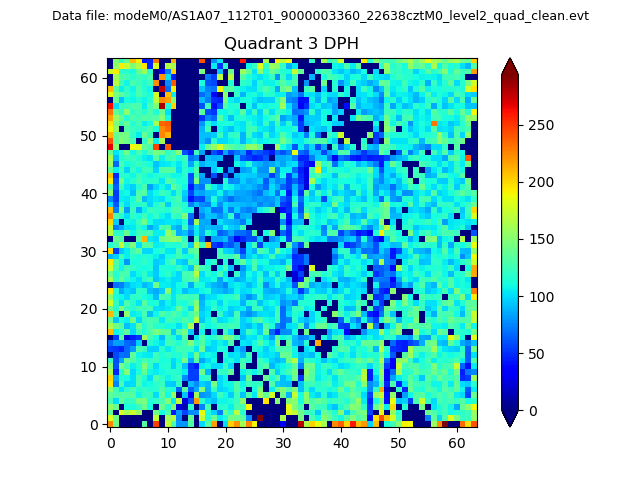 |
 |
Quadrant C |
| Plot type | Count rate plots | Images |
|---|---|---|
| Comparison with Poisson distribution Blue bars denote a histogram of data divided into 1 sec bins. Red curve is a Poisson curve with rate = median count rate of data. |
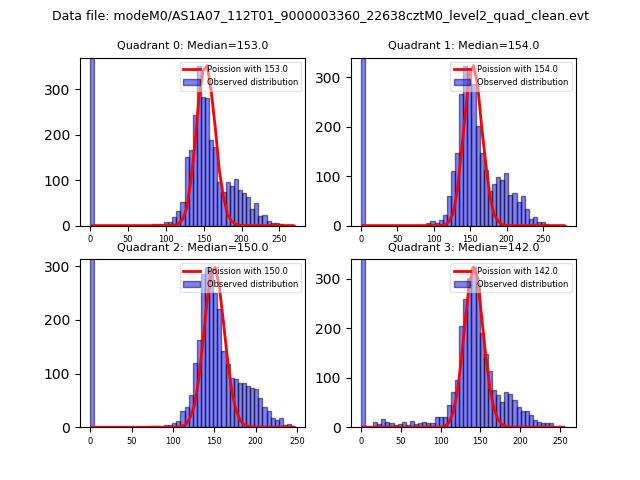 |
 |
| Quadrant-wise count rates Data is divided into 100 sec bins |
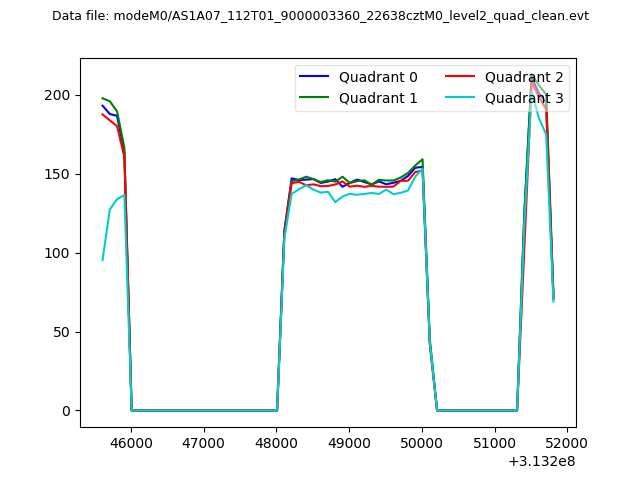 |
|
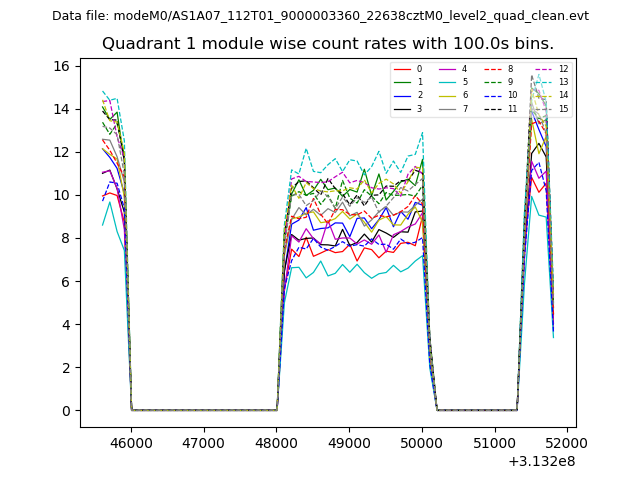
| Module-wise count rates for Quadrant A Data is divided into 100 sec bins |
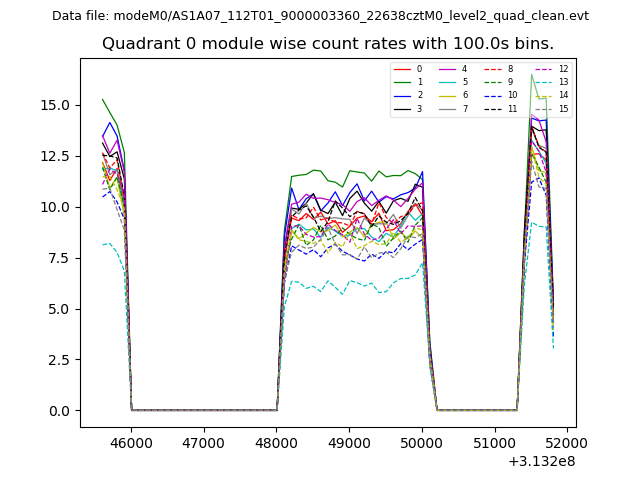 |
 |
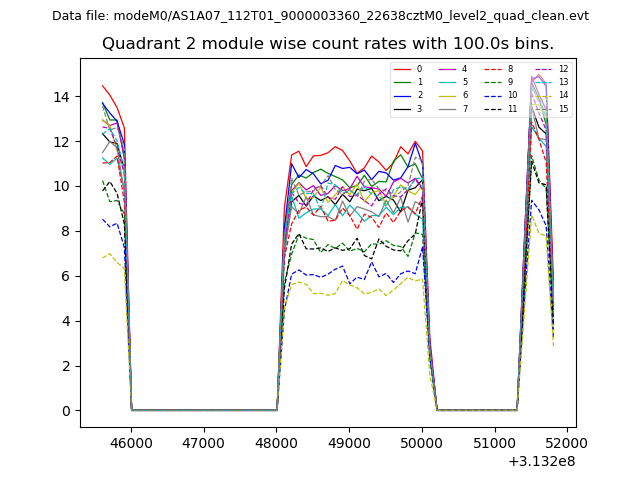
| Module-wise count rates for Quadrant B Data is divided into 100 sec bins |
 |
 |
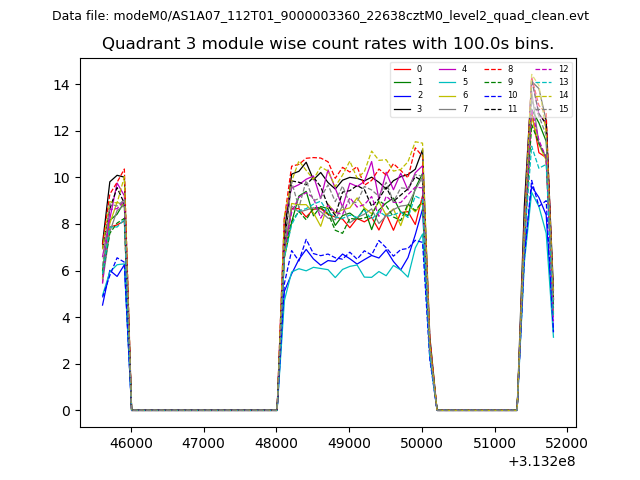
| Module-wise count rates for Quadrant C Data is divided into 100 sec bins |
 |
 |
| Module-wise count rates for Quadrant D Data is divided into 100 sec bins |
 |
 |
| Parameter | Plot |
|---|---|
| CZT HV Monitor | 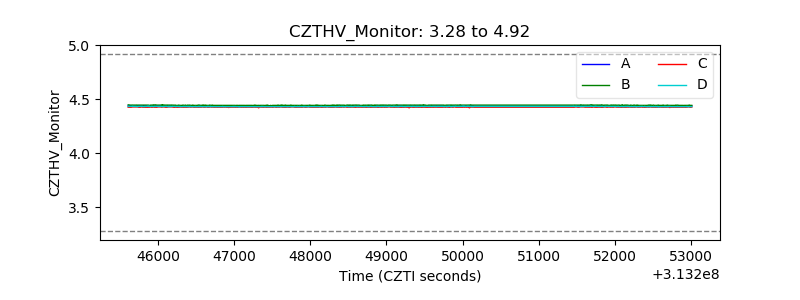 |
| D_VDD | 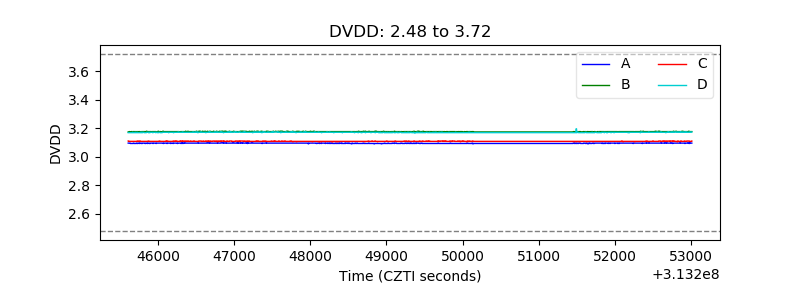 |
| Temperature 1 | 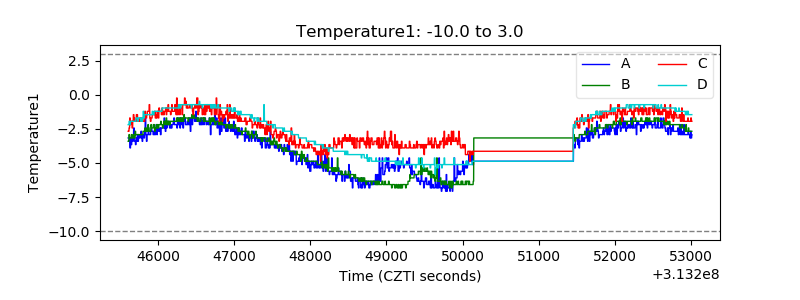 |
| Veto HV Monitor | 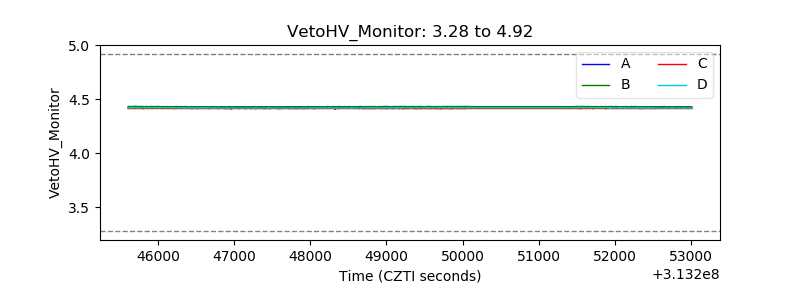 |
| Veto LLD | 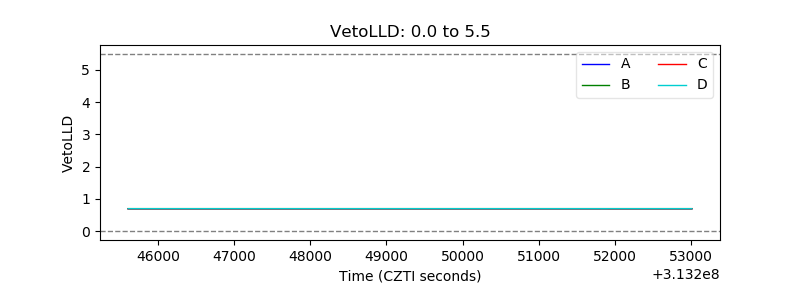 |
| Alpha Counter | 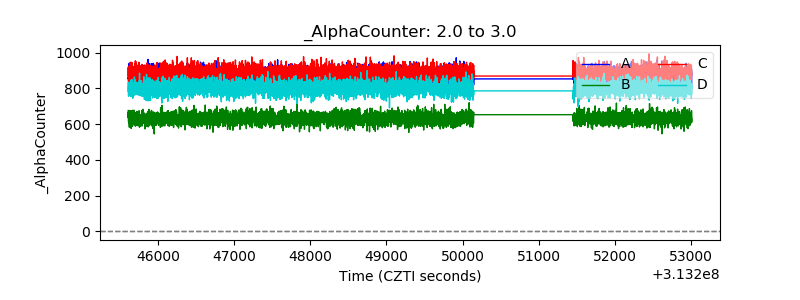 |
| _CPM_Rate | 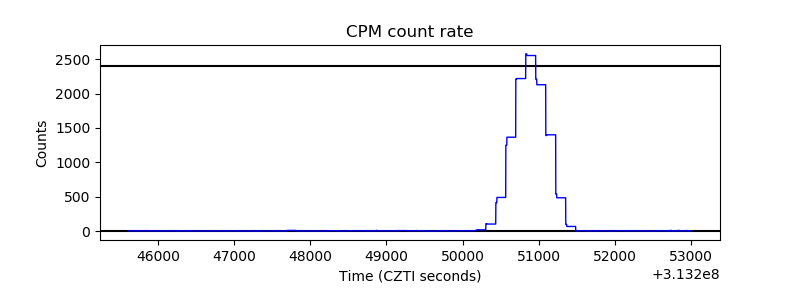 |
| CZT Counter | 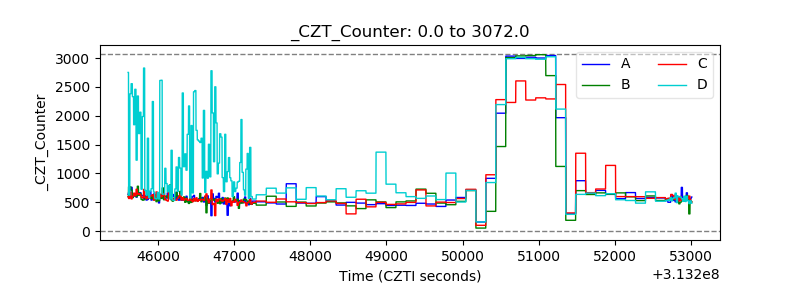 |
| +2.5 Volts monitor |  |
| +5 Volts monitor | 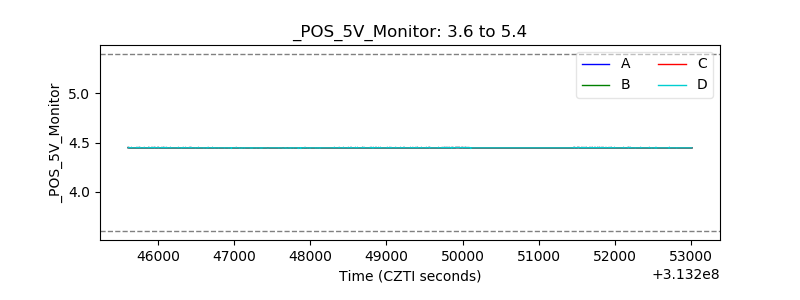 |
| _ROLL_ROT | 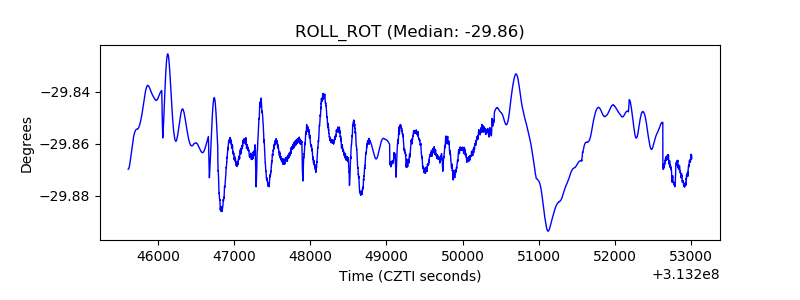 |
| _Roll_DEC | 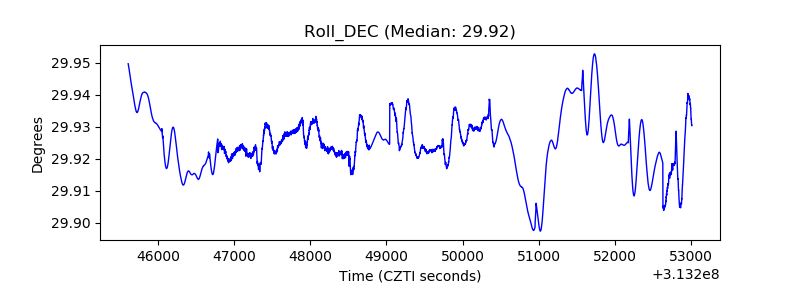 |
| _Roll_RA | 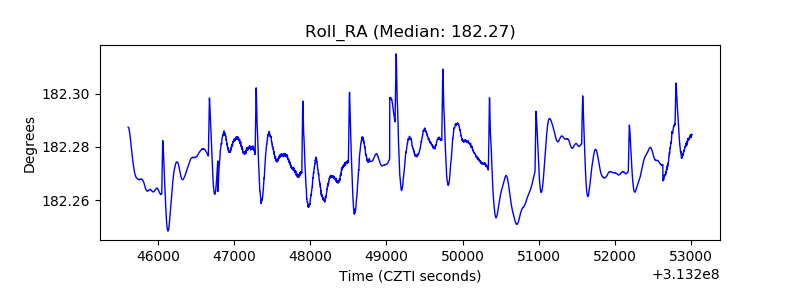 |
| Veto Counter | 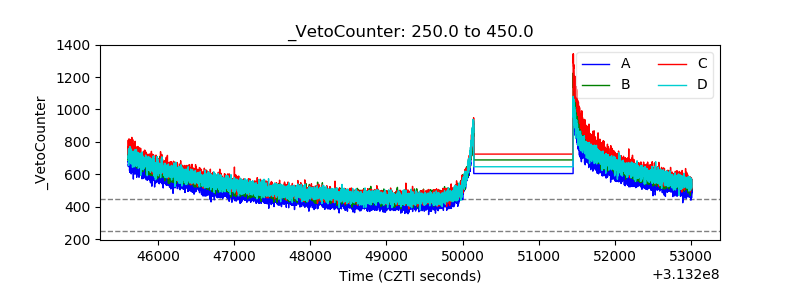 |