| Param | Original file | Final file |
|---|---|---|
| Filename | modeM0/AS1A07_112T01_9000003360_22639cztM0_level2.evt | modeM0/AS1A07_112T01_9000003360_22639cztM0_level2_quad_clean.evt |
| Size (bytes) | 223,015,680 | 25,459,200 |
| Size | 212.7 MB | 24.3 MB |
| Events in quadrant A | 1,608,248 | 138,621 |
| Events in quadrant B | 1,640,914 | 139,832 |
| Events in quadrant C | 1,671,567 | 136,895 |
| Events in quadrant D | 1,622,148 | 135,603 |
| Mode M0 | |||
|---|---|---|---|
| Quadrant | BADHDUFLAG | Total packets | Discarded packets |
| A | 0 | 6587 | 0 |
| B | 0 | 6681 | 0 |
| C | 0 | 6771 | 0 |
| D | 0 | 6648 | 0 |
| Mode SS | |||
|---|---|---|---|
| Quadrant | BADHDUFLAG | Total packets | Discarded packets |
| A | 0 | 62 | 0 |
| B | 0 | 62 | 0 |
| C | 0 | 62 | 0 |
| D | 0 | 62 | 0 |
| Quadrant | Total seconds | Saturated seconds | Saturation percentage |
|---|---|---|---|
| A | 3077 | 3 | 0.097498% |
| B | 3078 | 6 | 0.194932% |
| C | 3078 | 22 | 0.714750% |
| D | 3078 | 8 | 0.259909% |
Noise dominated data is calculated using 1-second bins in cleaned event files. If a bin has >2000 counts, and if more than 50% of those come from <1% of pixels, then it is considered to be noise-dominated and hence unusable.
| Quadrant | # 1 sec bins | Bins with >0 counts | Bins with >2000 counts | High rate bins dominated by noise | Noise dominated (total time) | Noise dominated (detector-on time) | Marked lightcurve |
|---|---|---|---|---|---|---|---|
| A | 3077 | 3077 | 0 | 0 | 0.00% | 0.00% | 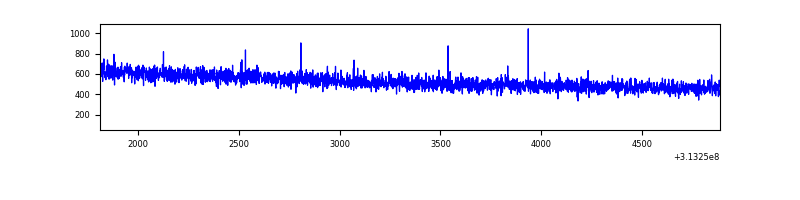 |
| B | 3078 | 3078 | 2 | 2 | 0.06% | 0.06% | 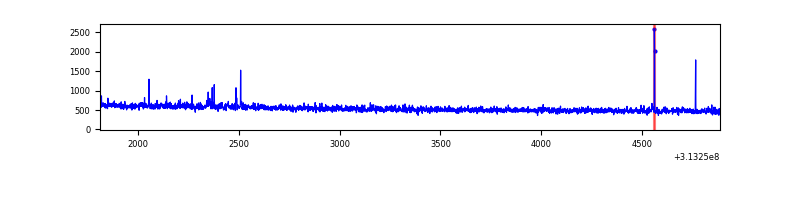 |
| C | 3078 | 3078 | 0 | 0 | 0.00% | 0.00% | 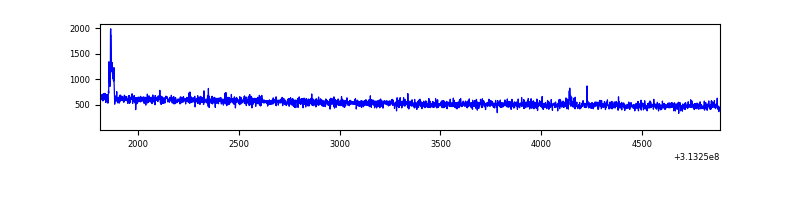 |
| D | 3078 | 3078 | 6 | 6 | 0.19% | 0.19% | 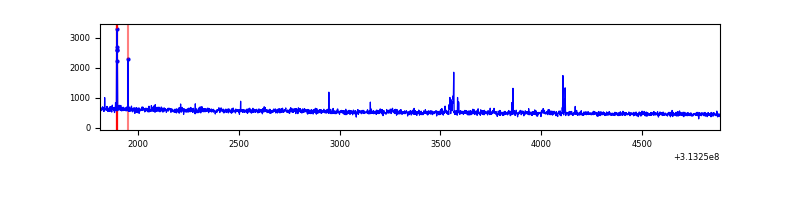 |
Top three noisy pixels from each quadrant. If the there are fewer than three noisy pixels in the level2.evt file, extra rows are filled as -1
| Pixel properties | Quadrant properties | ||||||
|---|---|---|---|---|---|---|---|
| Quadrant | DetID | PixID | Counts | Sigma | Mean | Median | Sigma |
| A | 13 | 254 | 4985 | 55.18 | 416 | 409 | 82.9 |
| A | 0 | 226 | 3646 | 39.03 | 416 | 409 | 82.9 |
| A | 3 | 137 | 3270 | 34.5 | 416 | 409 | 82.9 |
| B | 0 | 190 | 9022 | 110.79 | 413 | 405 | 77.8 |
| B | 12 | 111 | 8429 | 103.16 | 413 | 405 | 77.8 |
| B | 11 | 111 | 7474 | 90.89 | 413 | 405 | 77.8 |
| C | 14 | 238 | 66645 | 697.68 | 406 | 410 | 94.9 |
| C | 10 | 22 | 22269 | 230.25 | 406 | 410 | 94.9 |
| C | 13 | 61 | 2898 | 26.21 | 406 | 410 | 94.9 |
| D | 1 | 52 | 18796 | 183.77 | 413 | 402 | 100.1 |
| D | 12 | 233 | 13385 | 129.71 | 413 | 402 | 100.1 |
| D | 2 | 234 | 12983 | 125.7 | 413 | 402 | 100.1 |
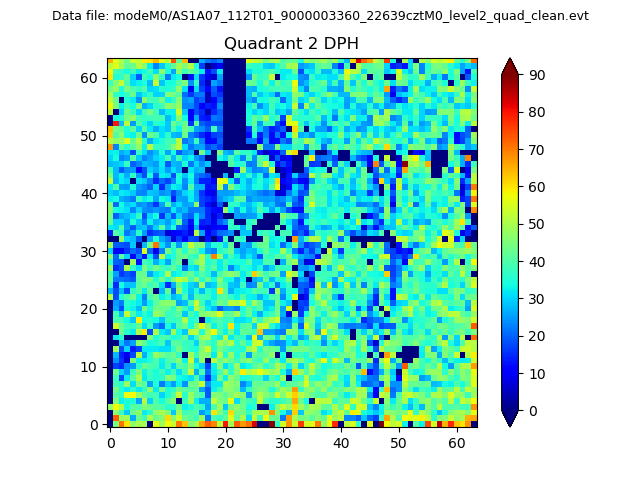
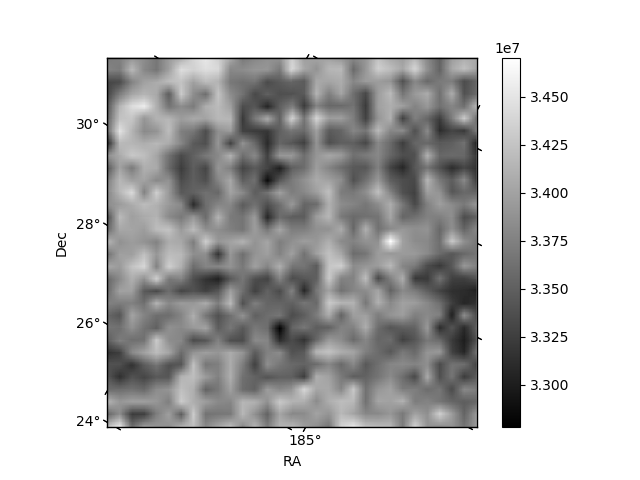
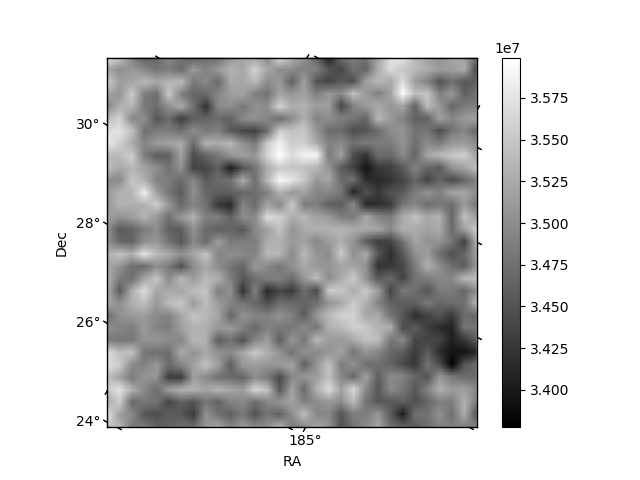
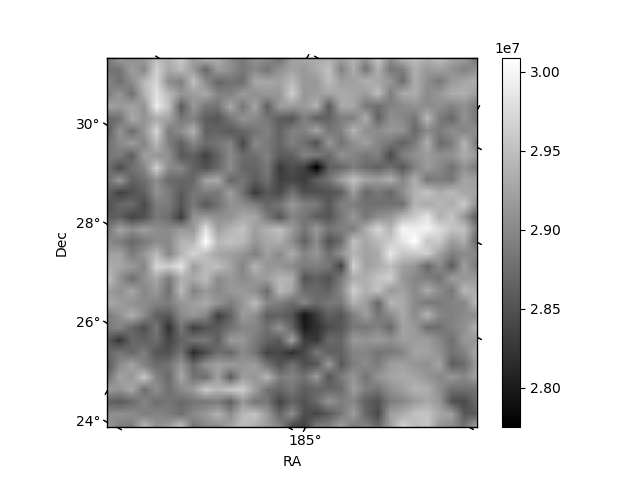
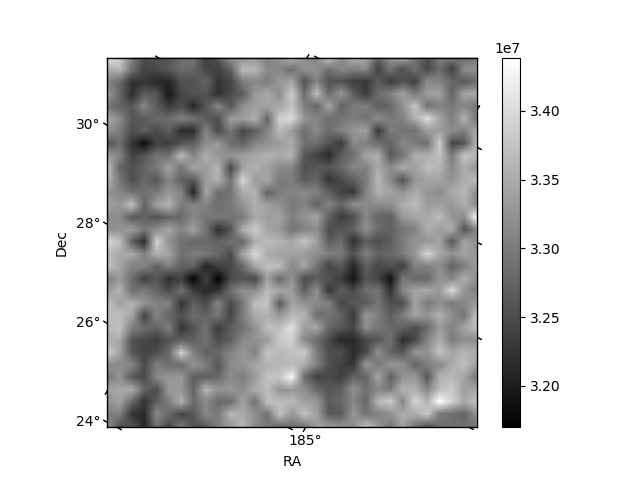
Histogram calculated using DETX and DETY for each event in the final _common_clean file
| Quadrant A | 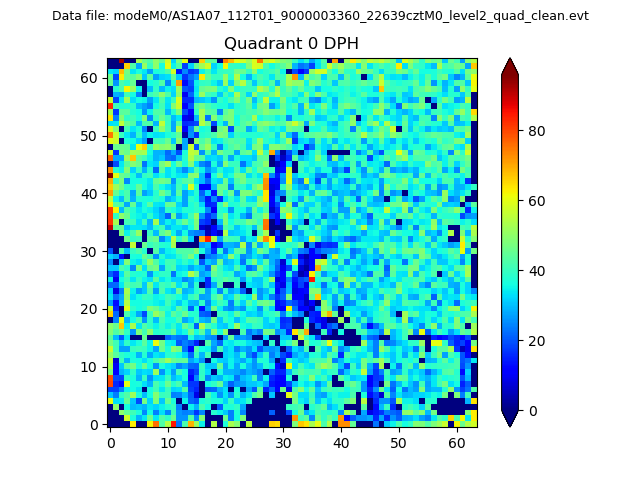 |
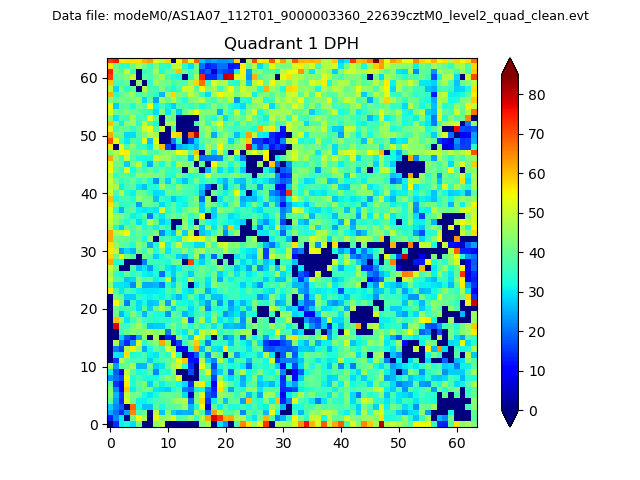 |
Quadrant B |
|---|---|---|---|
| Quadrant D | 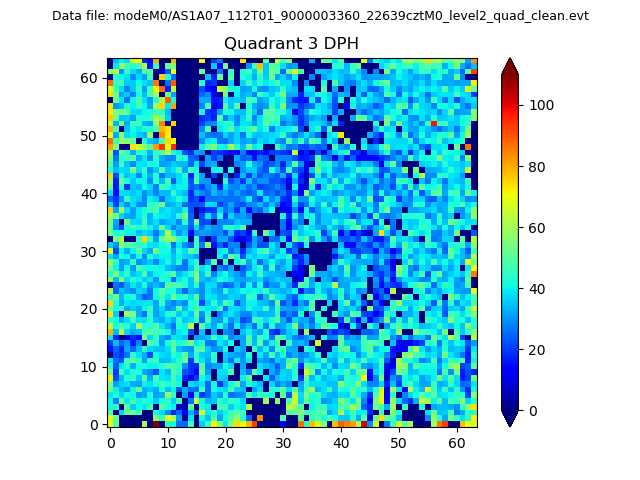 |
 |
Quadrant C |
| Plot type | Count rate plots | Images |
|---|---|---|
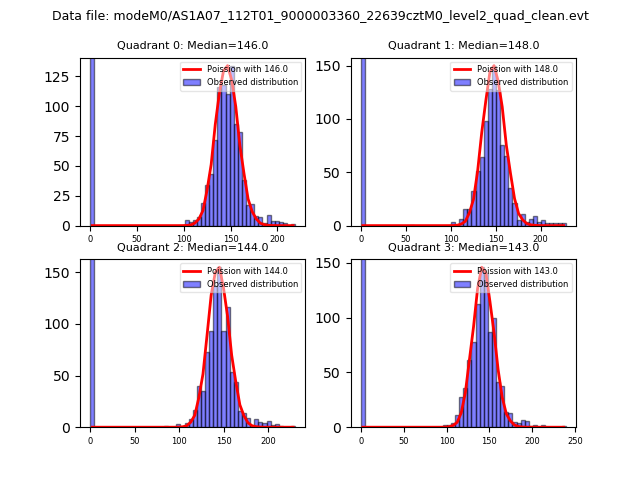
| Comparison with Poisson distribution Blue bars denote a histogram of data divided into 1 sec bins. Red curve is a Poisson curve with rate = median count rate of data. |
 |
 |
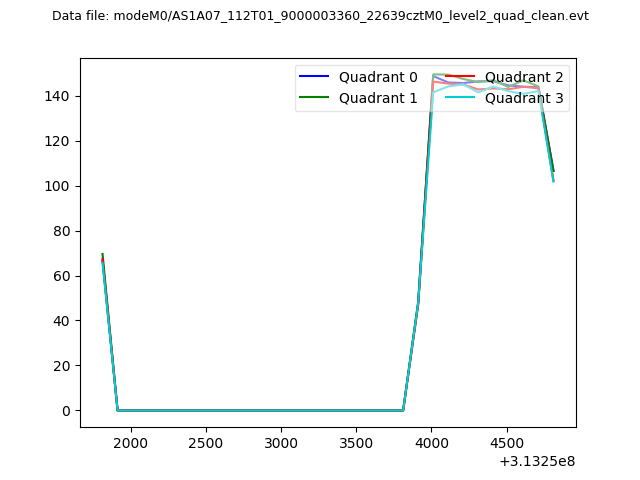
| Quadrant-wise count rates Data is divided into 100 sec bins |
 |
|
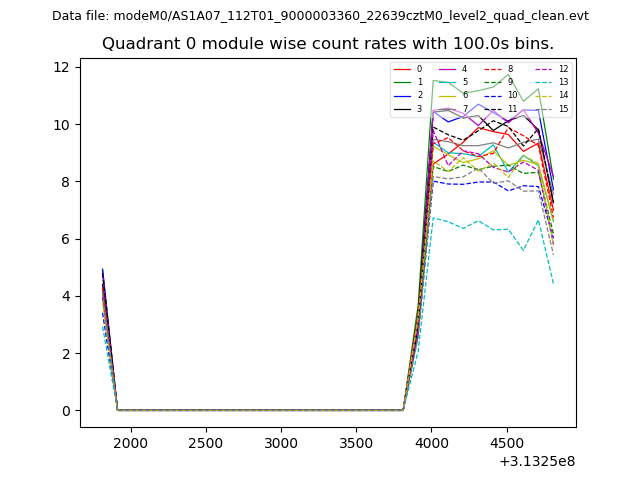
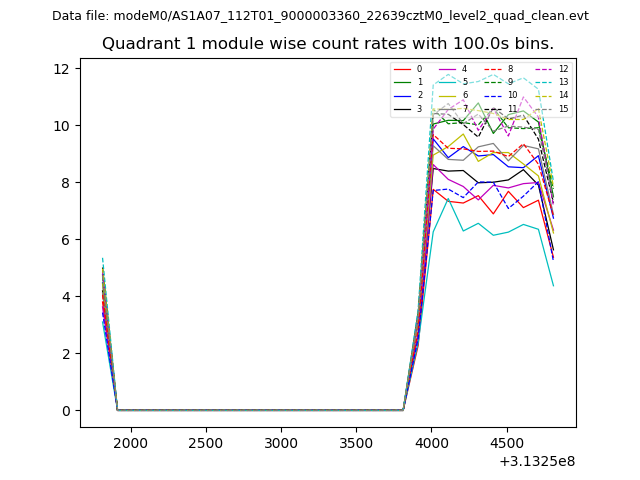
| Module-wise count rates for Quadrant A Data is divided into 100 sec bins |
 |
 |
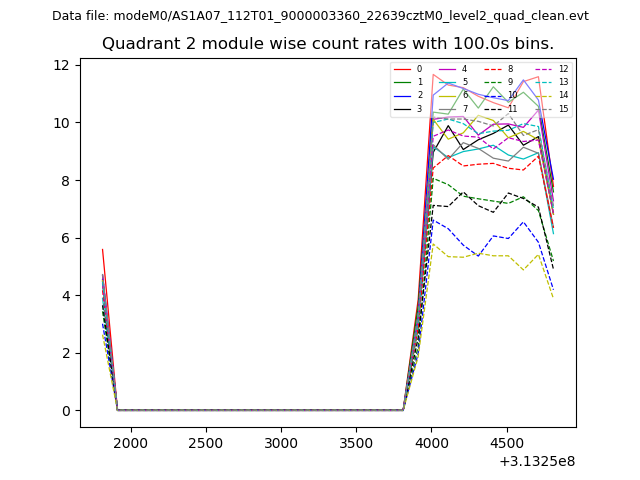
| Module-wise count rates for Quadrant B Data is divided into 100 sec bins |
 |
 |
| Module-wise count rates for Quadrant C Data is divided into 100 sec bins |
 |
 |
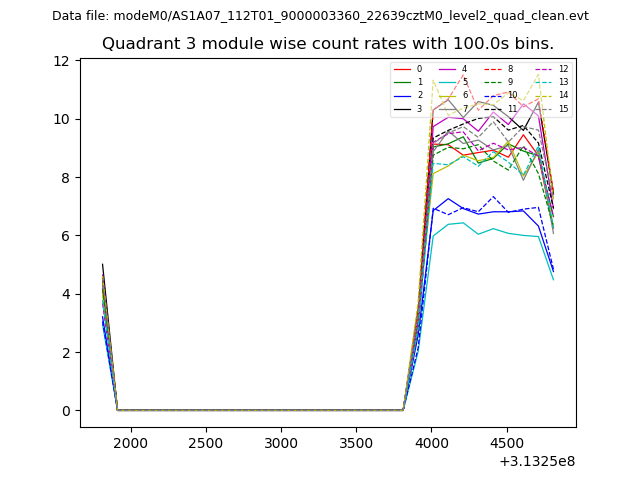
| Module-wise count rates for Quadrant D Data is divided into 100 sec bins |
 |
 |
| Parameter | Plot |
|---|---|
| CZT HV Monitor | 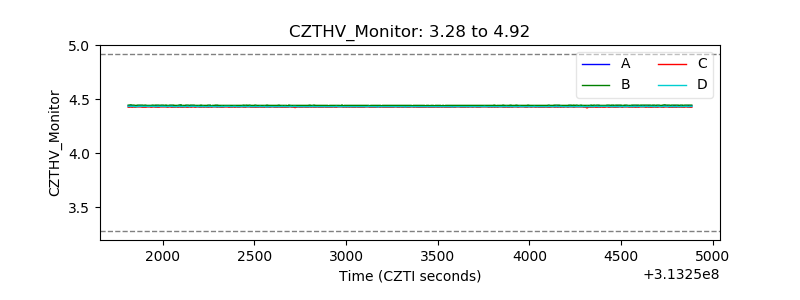 |
| D_VDD | 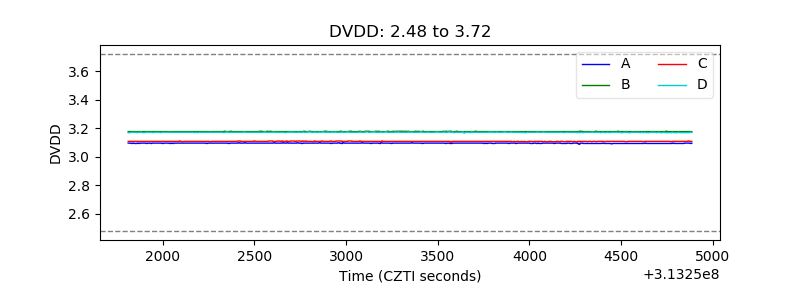 |
| Temperature 1 |  |
| Veto HV Monitor |  |
| Veto LLD | 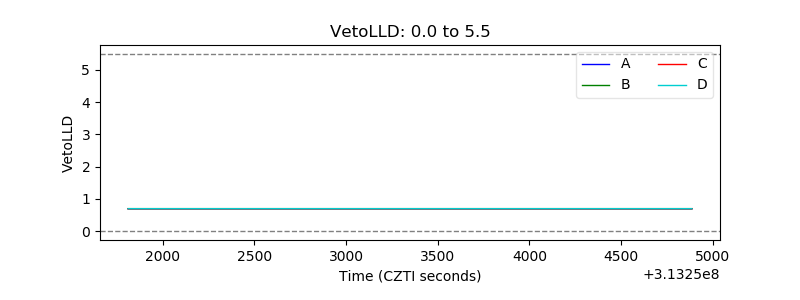 |
| Alpha Counter | 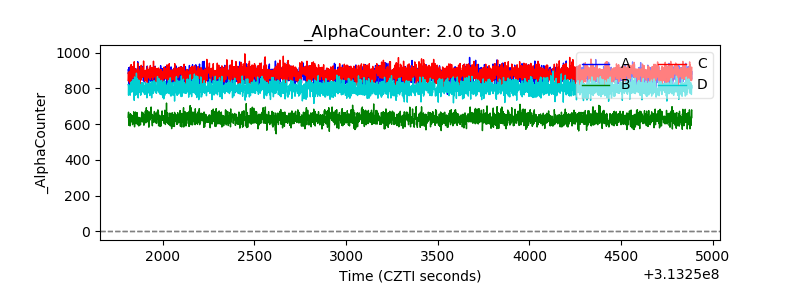 |
| _CPM_Rate | 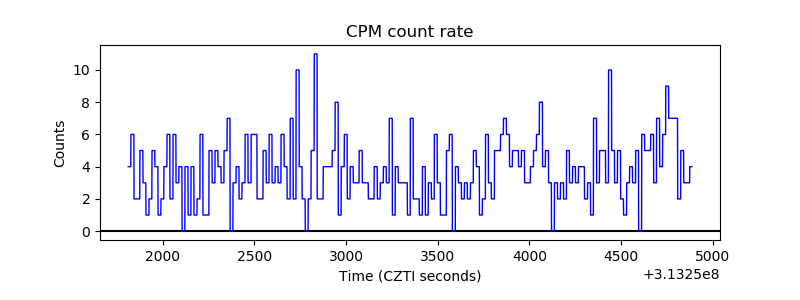 |
| CZT Counter | 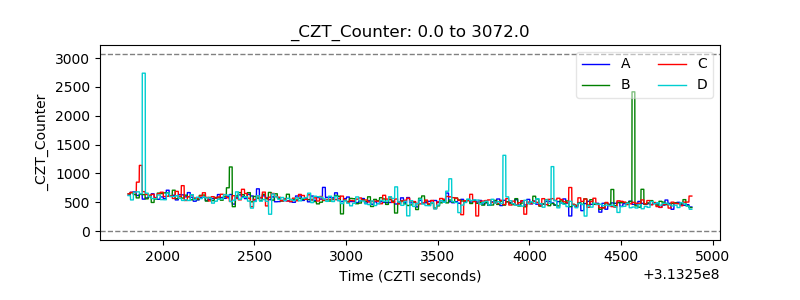 |
| +2.5 Volts monitor |  |
| +5 Volts monitor |  |
| _ROLL_ROT | 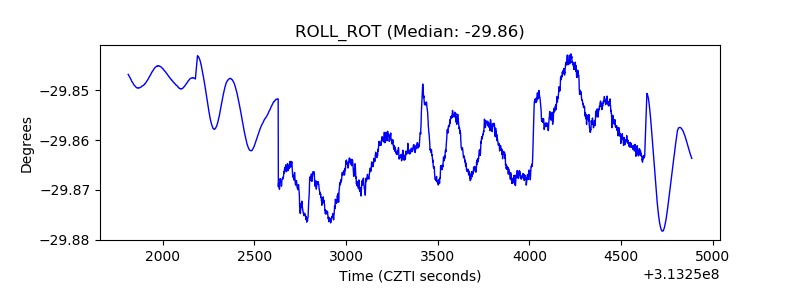 |
| _Roll_DEC | 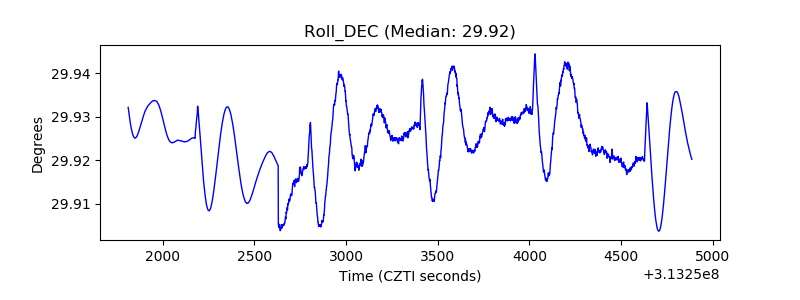 |
| _Roll_RA | 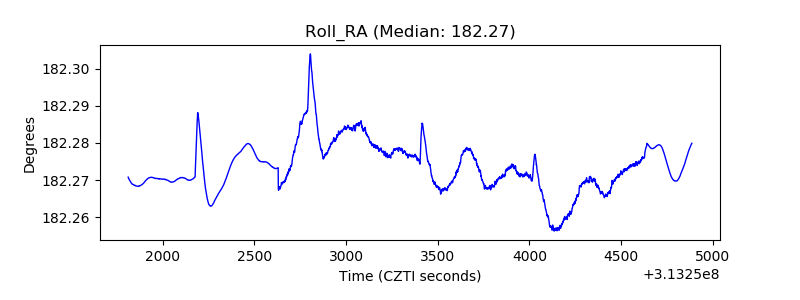 |
| Veto Counter | 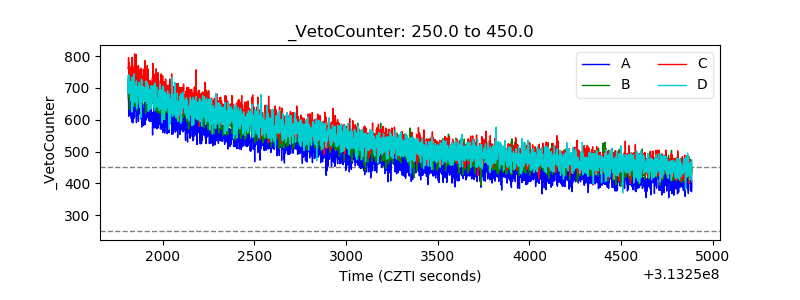 |