| Param | Original file | Final file |
|---|---|---|
| Filename | modeM0/AS1A08_007T01_9000003362cztM0_level2.fits | modeM0/AS1A08_007T01_9000003362cztM0_level2_quad_clean.evt |
| Size (bytes) | 1,976,817,600 | 1,732,544,640 |
| Size | 1.8 GB | 1.6 GB |
| Events in quadrant A | 12,428,474 | 10,329,790 |
| Events in quadrant B | 11,746,275 | 10,281,422 |
| Events in quadrant C | 11,929,540 | 9,753,904 |
| Events in quadrant D | 10,107,012 | 8,452,034 |
| Mode SS | |||
|---|---|---|---|
| Quadrant | BADHDUFLAG | Total packets | Discarded packets |
| A | 0 | 4058 | 0 |
| B | 0 | 4064 | 0 |
| C | 0 | 4058 | 0 |
| D | 0 | 4058 | 0 |
| Mode M0 | |||
|---|---|---|---|
| Quadrant | BADHDUFLAG | Total packets | Discarded packets |
| A | 0 | 415110 | 0 |
| B | 0 | 438613 | 0 |
| C | 0 | 417159 | 0 |
| D | 0 | 588332 | 0 |
| Mode M9 | |||
|---|---|---|---|
| Quadrant | BADHDUFLAG | Total packets | Discarded packets |
| A | 0 | 458 | 0 |
| B | 0 | 458 | 0 |
| C | 0 | 458 | 0 |
| D | 0 | 458 | 0 |
| Quadrant | Total seconds | Saturated seconds | Saturation percentage |
|---|---|---|---|
| A | 199327 | 1731 | 0.868422% |
| B | 199288 | 2704 | 1.356830% |
| C | 199300 | 2919 | 1.464626% |
| D | 199254 | 15432 | 7.744888% |
Noise dominated data is calculated using 1-second bins in cleaned event files. If a bin has >2000 counts, and if more than 50% of those come from <1% of pixels, then it is considered to be noise-dominated and hence unusable.
| Quadrant | # 1 sec bins | Bins with >0 counts | Bins with >2000 counts | High rate bins dominated by noise | Noise dominated (total time) | Noise dominated (detector-on time) | Marked lightcurve |
|---|---|---|---|---|---|---|---|
| A | 302715 | 199471 | 0 | 0 | 0.00% | 0.00% | 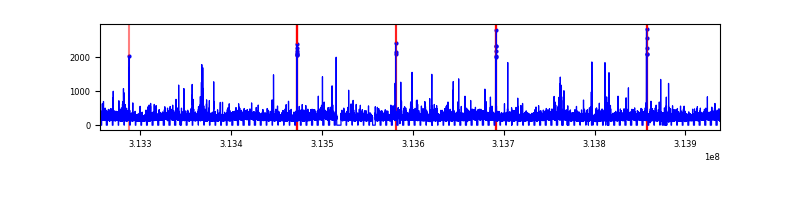 |
| B | 302715 | 199437 | 0 | 0 | 0.00% | 0.00% |  |
| C | 302715 | 199431 | 0 | 0 | 0.00% | 0.00% |  |
| D | 302715 | 199241 | 0 | 0 | 0.00% | 0.00% |  |
Top three noisy pixels from each quadrant. If the there are fewer than three noisy pixels in the level2.evt file, extra rows are filled as -1
| Pixel properties | Quadrant properties | ||||||
|---|---|---|---|---|---|---|---|
| Quadrant | DetID | PixID | Counts | Sigma | Mean | Median | Sigma |
| A | 0 | 29 | 11951 | 11.46 | 3237 | 3050 | 776.8 |
| A | 7 | 110 | 10030 | 8.98 | 3237 | 3050 | 776.8 |
| A | 0 | 30 | 9359 | 8.12 | 3237 | 3050 | 776.8 |
| B | 2 | 9 | 9478 | 10.84 | 3119 | 2989 | 598.6 |
| B | 2 | 8 | 7932 | 8.26 | 3119 | 2989 | 598.6 |
| B | 5 | 128 | 7658 | 7.8 | 3119 | 2989 | 598.6 |
| C | 12 | 241 | 8256 | 6.66 | 3158 | 2960 | 795.0 |
| C | 3 | 126 | 8078 | 6.44 | 3158 | 2960 | 795.0 |
| C | 2 | 191 | 8013 | 6.36 | 3158 | 2960 | 795.0 |
| D | 3 | 14 | 7281 | 6.07 | 2898 | 2658 | 761.7 |
| D | 10 | 189 | 7140 | 5.88 | 2898 | 2658 | 761.7 |
| D | 6 | 231 | 7136 | 5.88 | 2898 | 2658 | 761.7 |
Histogram calculated using DETX and DETY for each event in the final _common_clean file
| Quadrant A | 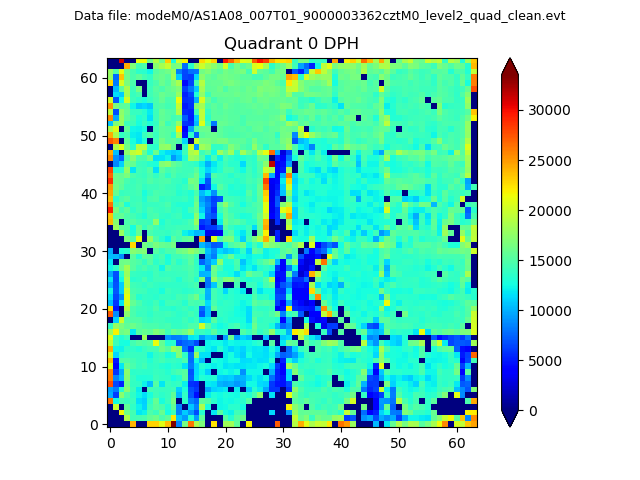 |
 |
Quadrant B |
|---|---|---|---|
| Quadrant D |  |
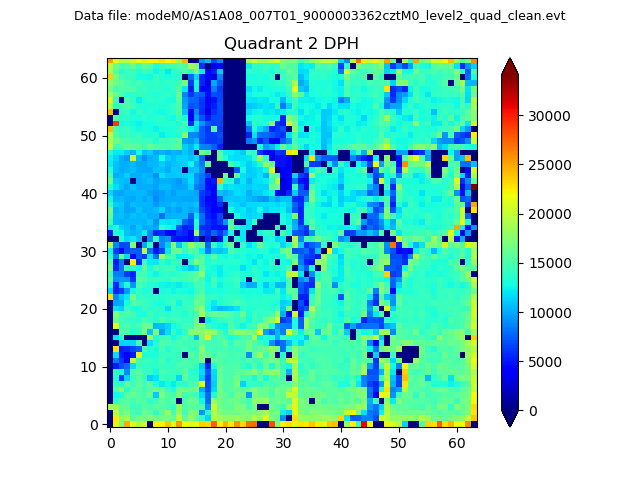 |
Quadrant C |
| Plot type | Count rate plots | Images |
|---|---|---|
| Comparison with Poisson distribution Blue bars denote a histogram of data divided into 1 sec bins. Red curve is a Poisson curve with rate = median count rate of data. |
 |
 |
| Quadrant-wise count rates Data is divided into 100 sec bins |
 |
|
| Module-wise count rates for Quadrant A Data is divided into 100 sec bins |
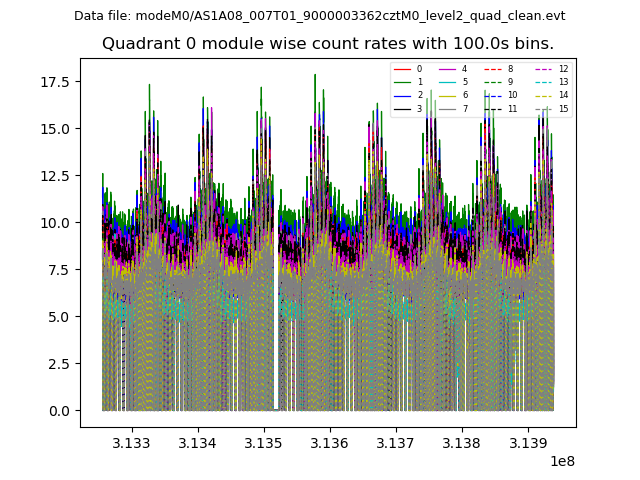 |
 |
| Module-wise count rates for Quadrant B Data is divided into 100 sec bins |
 |
 |
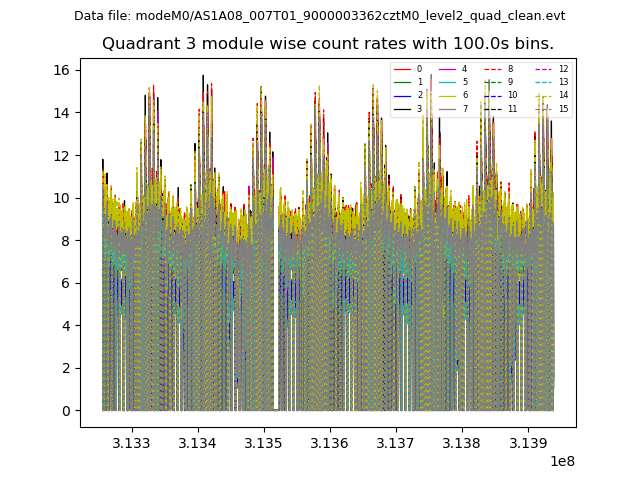
| Module-wise count rates for Quadrant C Data is divided into 100 sec bins |
 |
 |
| Module-wise count rates for Quadrant D Data is divided into 100 sec bins |
 |
 |
| Parameter | Plot |
|---|---|
| CZT HV Monitor | 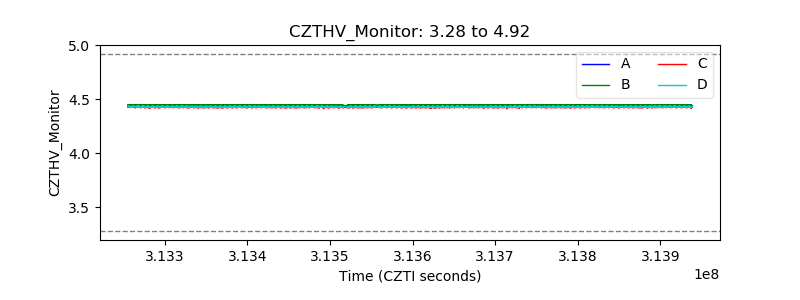 |
| D_VDD |  |
| Temperature 1 |  |
| Veto HV Monitor |  |
| Veto LLD | 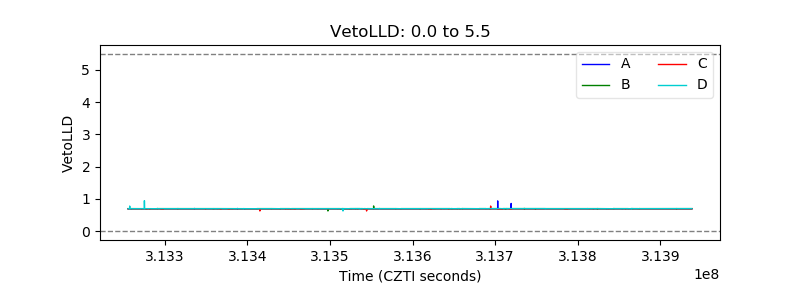 |
| Alpha Counter |  |
| _CPM_Rate | 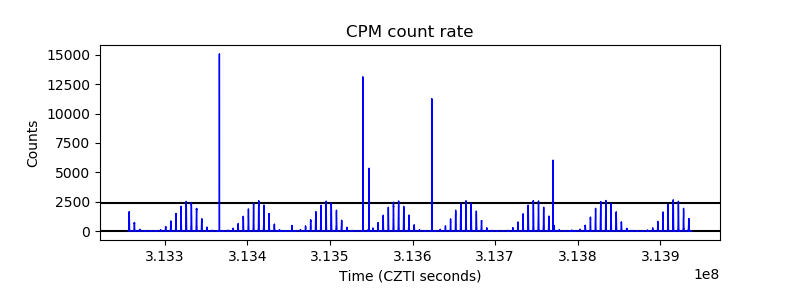 |
| CZT Counter |  |
| +2.5 Volts monitor |  |
| +5 Volts monitor |  |
| _ROLL_ROT | 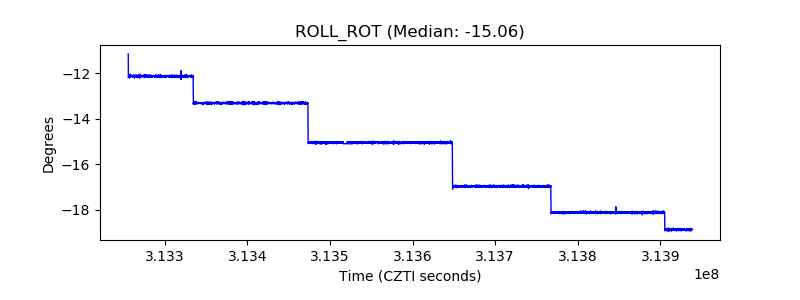 |
| _Roll_DEC | 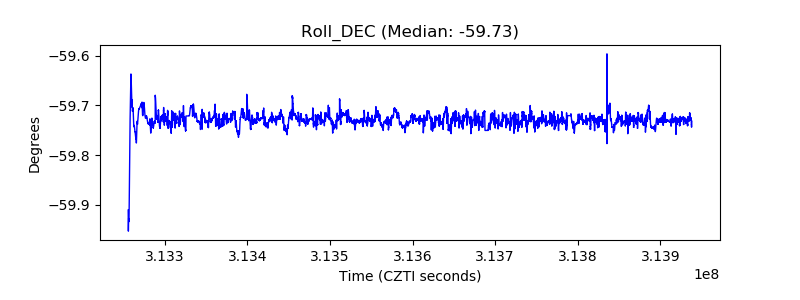 |
| _Roll_RA | 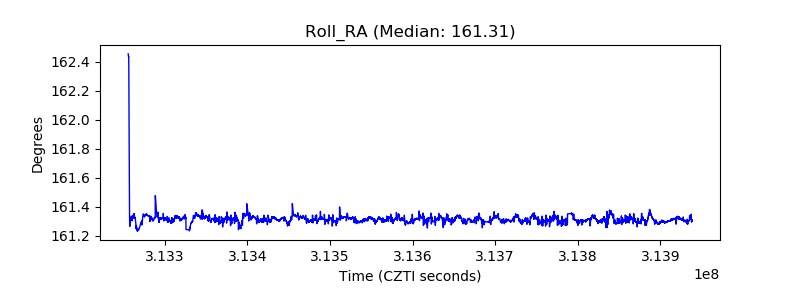 |
| Veto Counter |  |