| Param | Original file | Final file |
|---|---|---|
| Filename | modeM0/AS1A08_007T01_9000003362_22639cztM0_level2.evt | modeM0/AS1A08_007T01_9000003362_22639cztM0_level2_quad_clean.evt |
| Size (bytes) | 181,238,400 | 14,820,480 |
| Size | 172.8 MB | 14.1 MB |
| Events in quadrant A | 1,123,059 | 76,568 |
| Events in quadrant B | 1,253,901 | 77,518 |
| Events in quadrant C | 1,126,775 | 75,147 |
| Events in quadrant D | 1,849,549 | 75,830 |
| Mode SS | |||
|---|---|---|---|
| Quadrant | BADHDUFLAG | Total packets | Discarded packets |
| A | 0 | 42 | 0 |
| B | 0 | 42 | 0 |
| C | 0 | 42 | 0 |
| D | 0 | 42 | 0 |
| Mode M0 | |||
|---|---|---|---|
| Quadrant | BADHDUFLAG | Total packets | Discarded packets |
| A | 0 | 4517 | 1 |
| B | 0 | 5079 | 1 |
| C | 0 | 4512 | 1 |
| D | 0 | 6735 | 1 |
| Mode M9 | |||
|---|---|---|---|
| Quadrant | BADHDUFLAG | Total packets | Discarded packets |
| A | 0 | 13 | 0 |
| B | 0 | 13 | 0 |
| C | 0 | 13 | 0 |
| D | 0 | 13 | 0 |
| Quadrant | Total seconds | Saturated seconds | Saturation percentage |
|---|---|---|---|
| A | 1961 | 85 | 4.334523% |
| B | 1961 | 98 | 4.997450% |
| C | 1961 | 112 | 5.711372% |
| D | 1961 | 270 | 13.768485% |
Noise dominated data is calculated using 1-second bins in cleaned event files. If a bin has >2000 counts, and if more than 50% of those come from <1% of pixels, then it is considered to be noise-dominated and hence unusable.
| Quadrant | # 1 sec bins | Bins with >0 counts | Bins with >2000 counts | High rate bins dominated by noise | Noise dominated (total time) | Noise dominated (detector-on time) | Marked lightcurve |
|---|---|---|---|---|---|---|---|
| A | 3281 | 1962 | 0 | 0 | 0.00% | 0.00% |  |
| B | 3281 | 1962 | 0 | 0 | 0.00% | 0.00% | 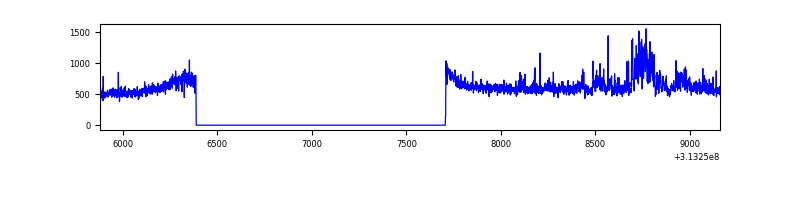 |
| C | 3281 | 1962 | 0 | 0 | 0.00% | 0.00% | 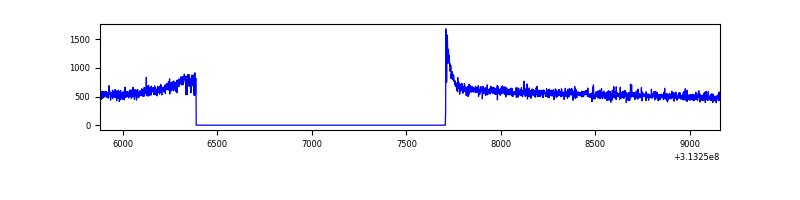 |
| D | 3281 | 1962 | 180 | 180 | 5.49% | 9.17% | 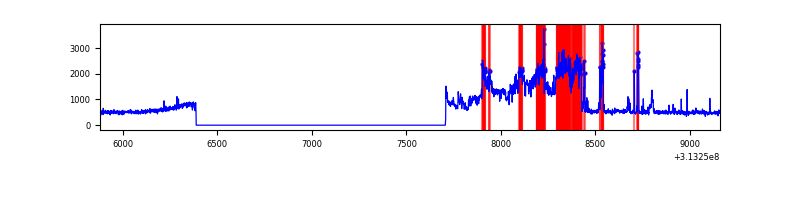 |
Top three noisy pixels from each quadrant. If the there are fewer than three noisy pixels in the level2.evt file, extra rows are filled as -1
| Pixel properties | Quadrant properties | ||||||
|---|---|---|---|---|---|---|---|
| Quadrant | DetID | PixID | Counts | Sigma | Mean | Median | Sigma |
| A | 11 | 47 | 4754 | 76.63 | 289 | 283 | 58.3 |
| A | 13 | 254 | 3251 | 50.87 | 289 | 283 | 58.3 |
| A | 0 | 226 | 2612 | 39.92 | 289 | 283 | 58.3 |
| B | 0 | 190 | 65057 | 1183.11 | 284 | 278 | 54.8 |
| B | 0 | 229 | 27585 | 498.73 | 284 | 278 | 54.8 |
| B | 0 | 228 | 23407 | 422.42 | 284 | 278 | 54.8 |
| C | 14 | 238 | 44423 | 687.31 | 274 | 275 | 64.2 |
| C | 0 | 10 | 12834 | 195.52 | 274 | 275 | 64.2 |
| C | 13 | 61 | 1891 | 25.16 | 274 | 275 | 64.2 |
| D | 7 | 238 | 650110 | 9646.81 | 275 | 267 | 67.4 |
| D | 12 | 233 | 85334 | 1262.81 | 275 | 267 | 67.4 |
| D | 1 | 52 | 62526 | 924.22 | 275 | 267 | 67.4 |
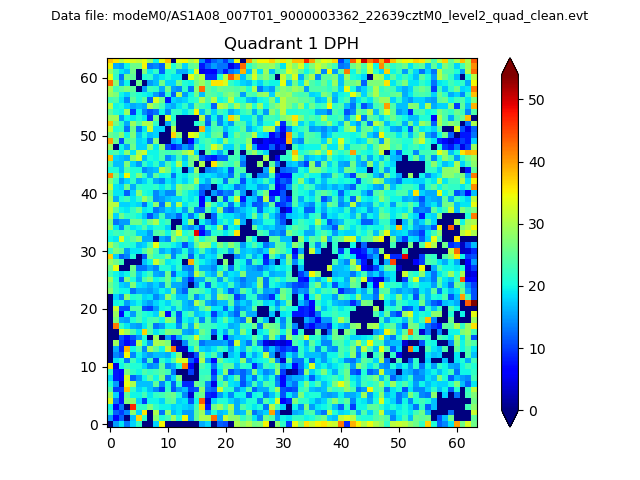
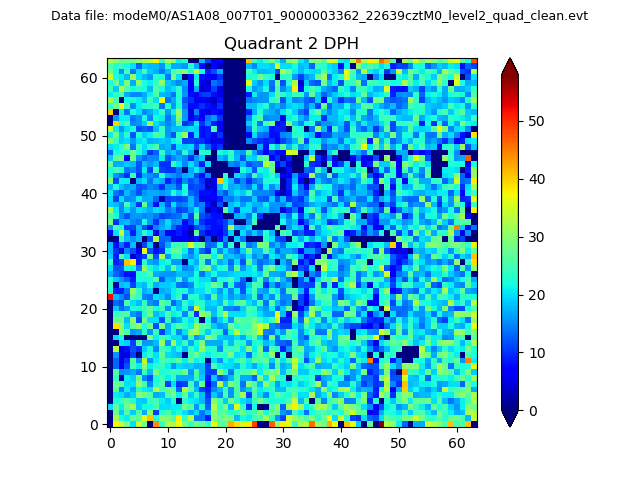
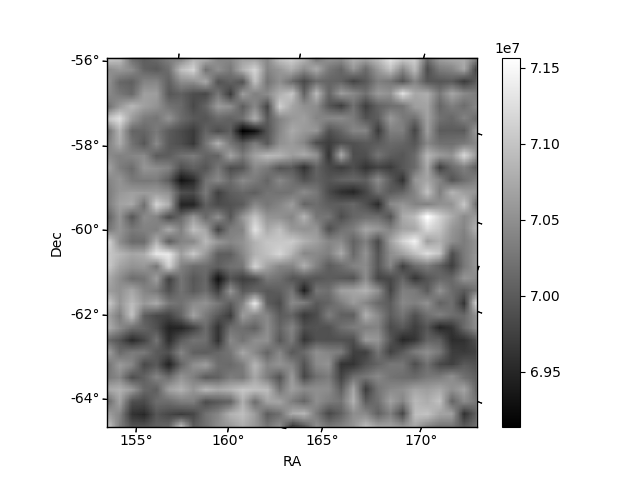
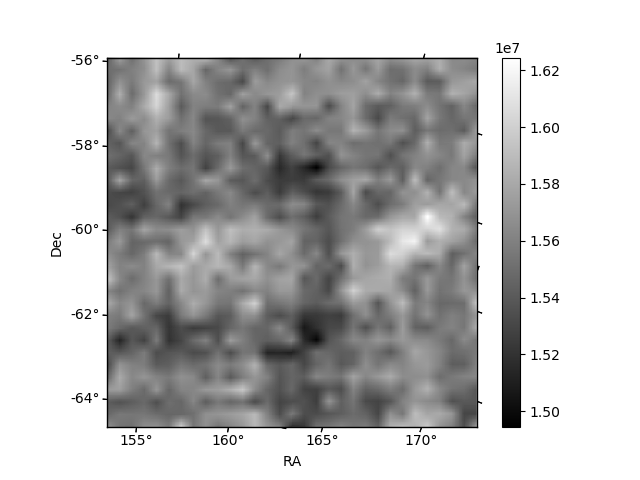
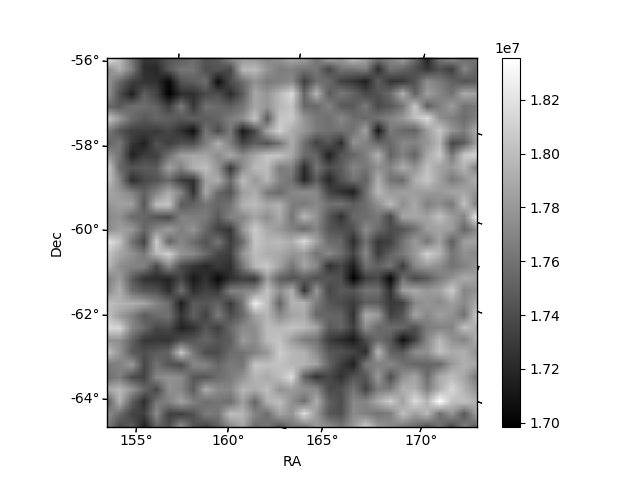
Histogram calculated using DETX and DETY for each event in the final _common_clean file
| Quadrant A | 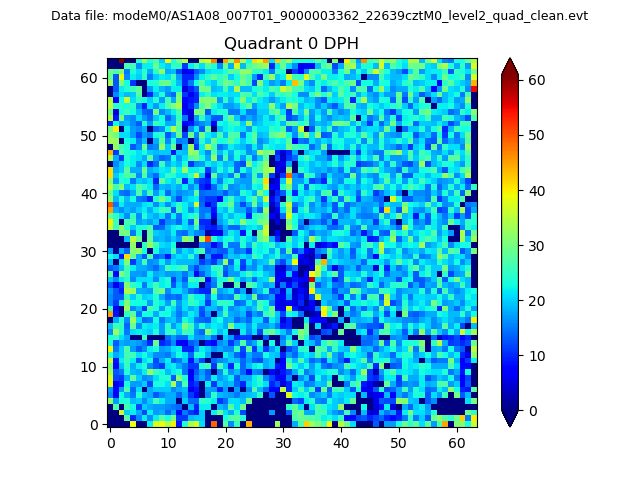 |
 |
Quadrant B |
|---|---|---|---|
| Quadrant D | 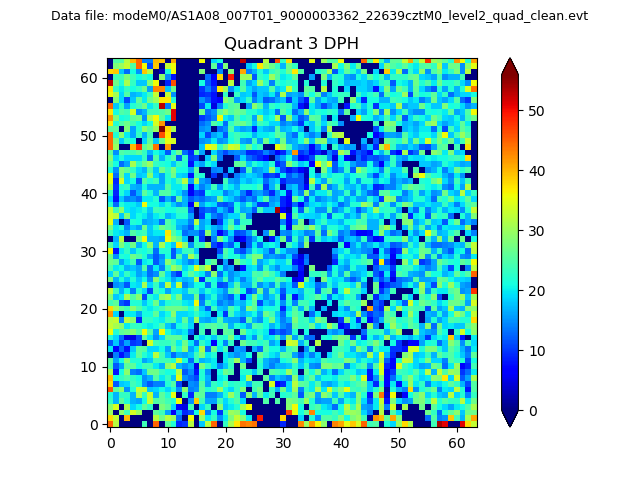 |
 |
Quadrant C |
| Plot type | Count rate plots | Images |
|---|---|---|
| Comparison with Poisson distribution Blue bars denote a histogram of data divided into 1 sec bins. Red curve is a Poisson curve with rate = median count rate of data. |
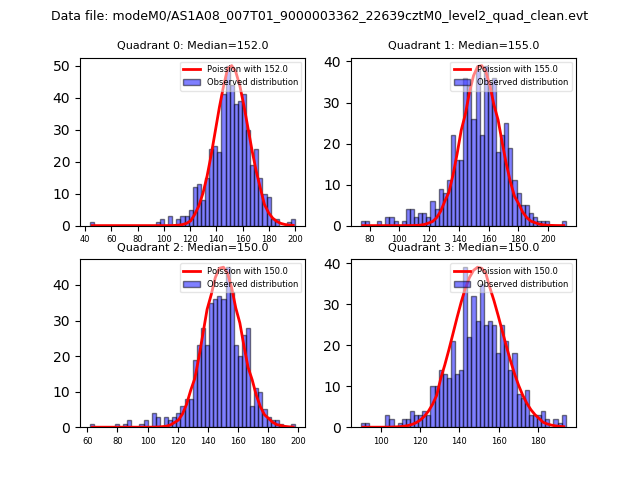 |
 |
| Quadrant-wise count rates Data is divided into 100 sec bins |
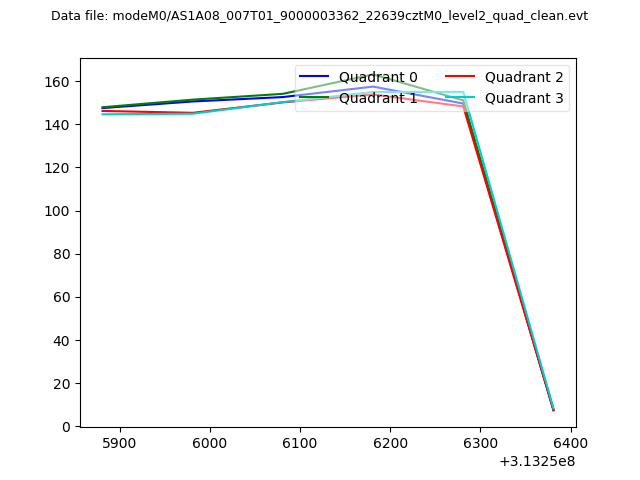 |
|
| Module-wise count rates for Quadrant A Data is divided into 100 sec bins |
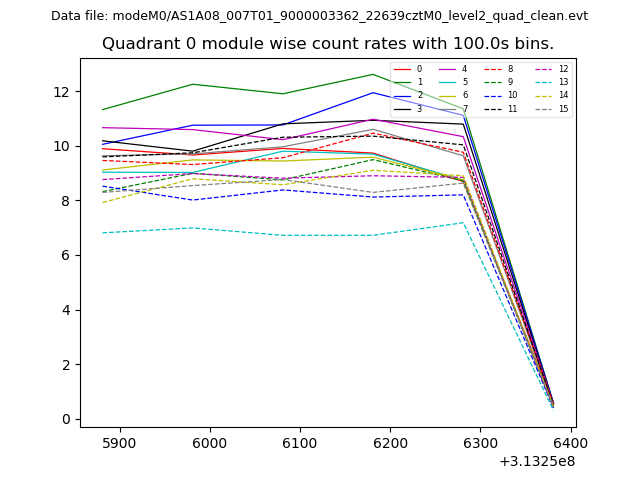 |
 |
| Module-wise count rates for Quadrant B Data is divided into 100 sec bins |
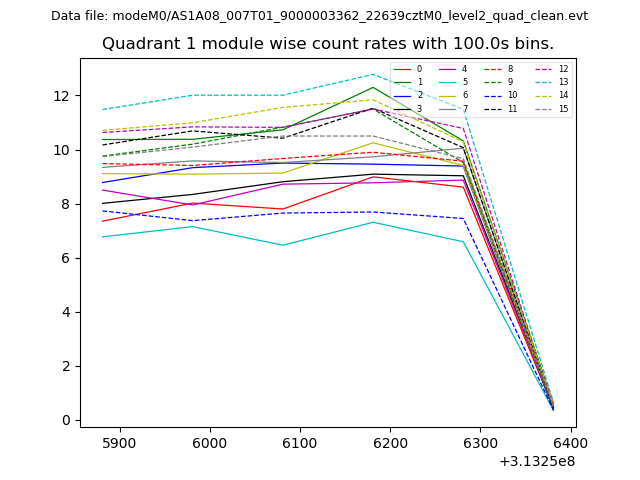 |
 |
| Module-wise count rates for Quadrant C Data is divided into 100 sec bins |
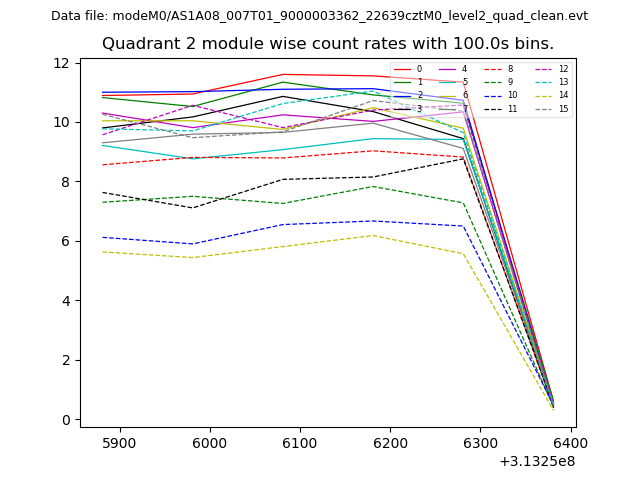 |
 |
| Module-wise count rates for Quadrant D Data is divided into 100 sec bins |
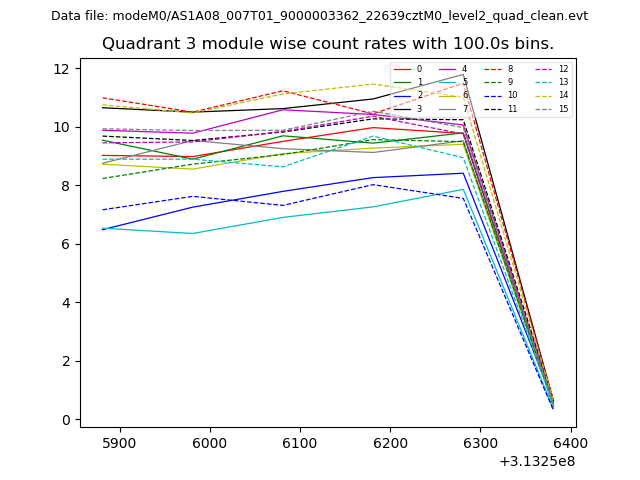 |
 |
| Parameter | Plot |
|---|---|
| CZT HV Monitor | 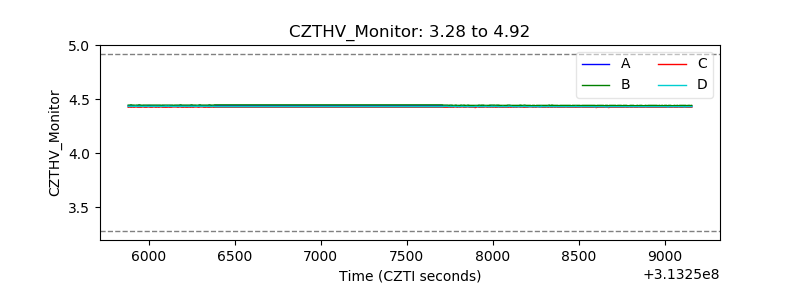 |
| D_VDD |  |
| Temperature 1 | 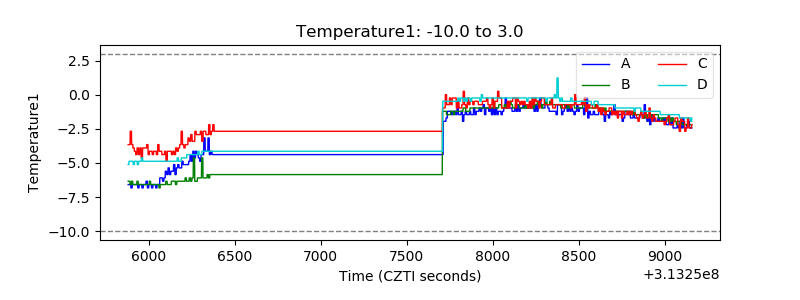 |
| Veto HV Monitor | 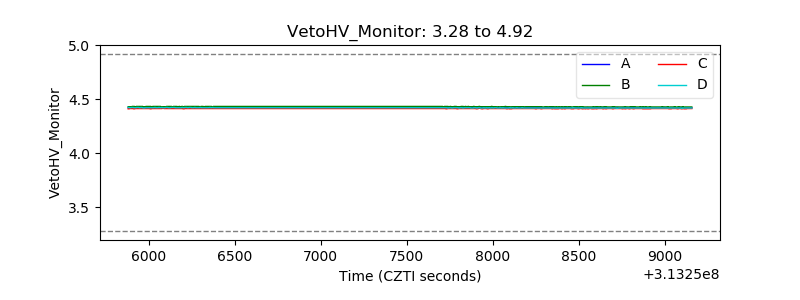 |
| Veto LLD | 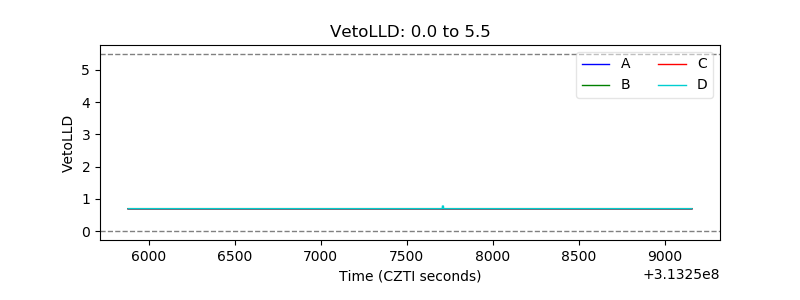 |
| Alpha Counter | 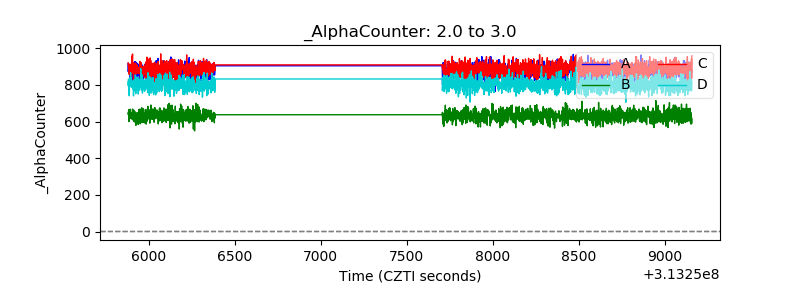 |
| _CPM_Rate | 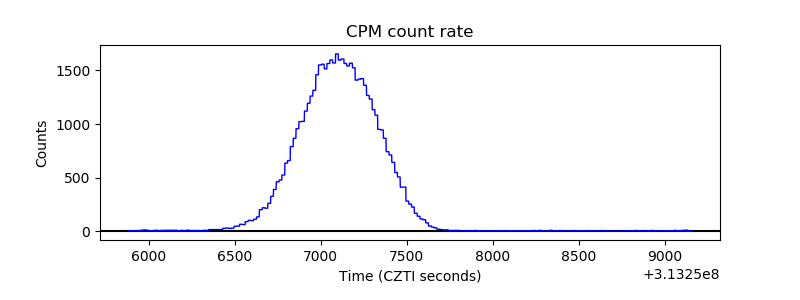 |
| CZT Counter | 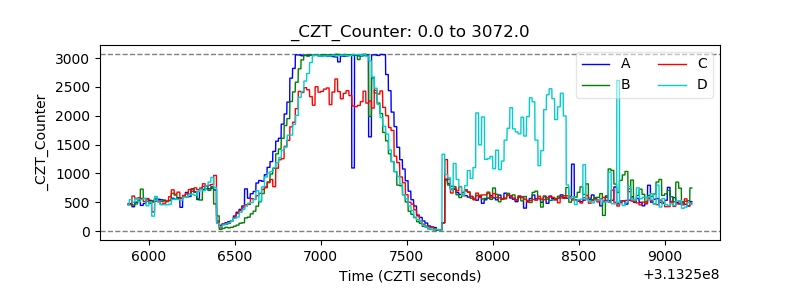 |
| +2.5 Volts monitor |  |
| +5 Volts monitor |  |
| _ROLL_ROT | 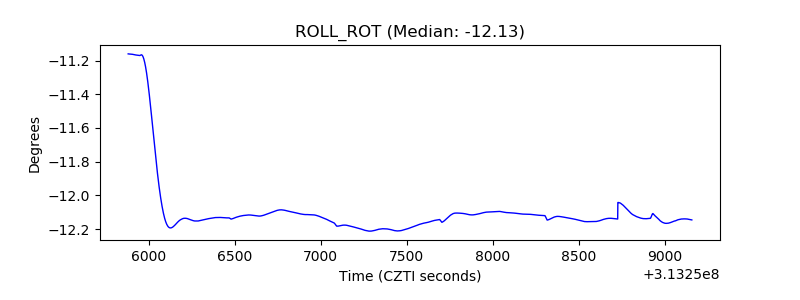 |
| _Roll_DEC | 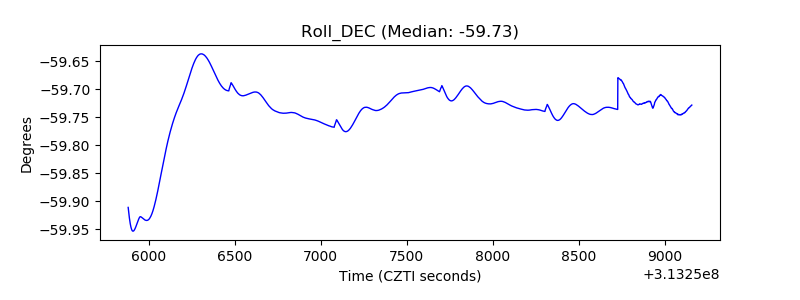 |
| _Roll_RA | 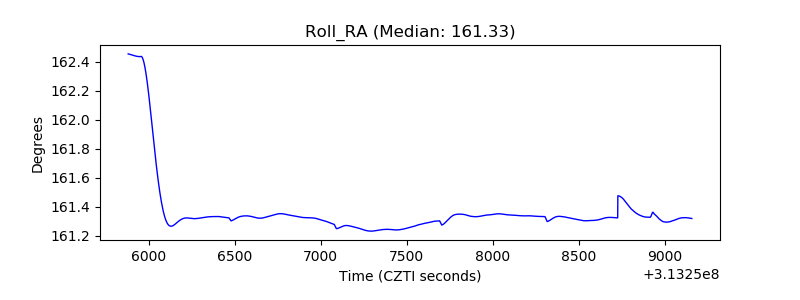 |
| Veto Counter | 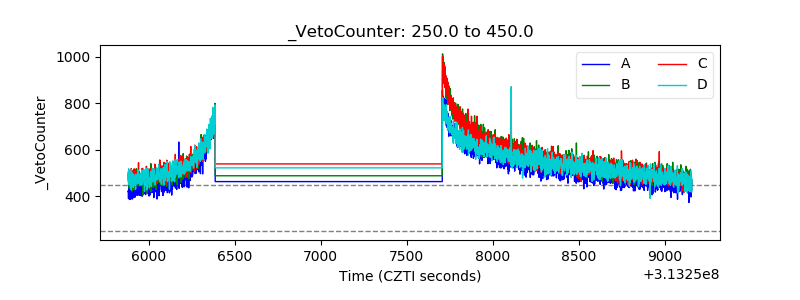 |