| Param | Original file | Final file |
|---|---|---|
| Filename | modeM0/AS1A08_007T01_9000003362_22642cztM0_level2.evt | modeM0/AS1A08_007T01_9000003362_22642cztM0_level2_quad_clean.evt |
| Size (bytes) | 483,952,320 | 97,989,120 |
| Size | 461.5 MB | 93.4 MB |
| Events in quadrant A | 3,446,854 | 625,555 |
| Events in quadrant B | 3,715,215 | 632,658 |
| Events in quadrant C | 3,426,135 | 606,458 |
| Events in quadrant D | 3,580,992 | 603,416 |
| Mode SS | |||
|---|---|---|---|
| Quadrant | BADHDUFLAG | Total packets | Discarded packets |
| A | 0 | 146 | 0 |
| B | 0 | 146 | 0 |
| C | 0 | 146 | 0 |
| D | 0 | 146 | 0 |
| Mode M0 | |||
|---|---|---|---|
| Quadrant | BADHDUFLAG | Total packets | Discarded packets |
| A | 0 | 14958 | 1 |
| B | 0 | 15617 | 1 |
| C | 0 | 14796 | 1 |
| D | 0 | 15544 | 2 |
| Mode M9 | |||
|---|---|---|---|
| Quadrant | BADHDUFLAG | Total packets | Discarded packets |
| A | 0 | 3 | 0 |
| B | 0 | 3 | 0 |
| C | 0 | 3 | 0 |
| D | 0 | 3 | 0 |
| Quadrant | Total seconds | Saturated seconds | Saturation percentage |
|---|---|---|---|
| A | 7170 | 45 | 0.627615% |
| B | 7170 | 109 | 1.520223% |
| C | 7171 | 72 | 1.004044% |
| D | 7170 | 55 | 0.767085% |
Noise dominated data is calculated using 1-second bins in cleaned event files. If a bin has >2000 counts, and if more than 50% of those come from <1% of pixels, then it is considered to be noise-dominated and hence unusable.
| Quadrant | # 1 sec bins | Bins with >0 counts | Bins with >2000 counts | High rate bins dominated by noise | Noise dominated (total time) | Noise dominated (detector-on time) | Marked lightcurve |
|---|---|---|---|---|---|---|---|
| A | 7555 | 7171 | 0 | 0 | 0.00% | 0.00% | 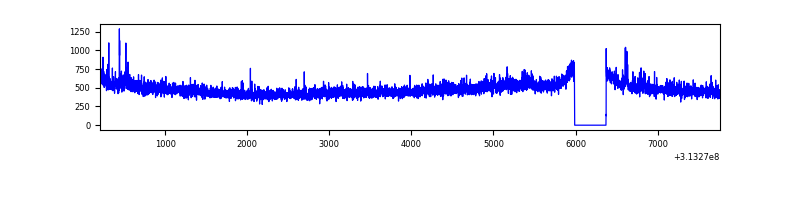 |
| B | 7555 | 7171 | 30 | 30 | 0.40% | 0.42% | 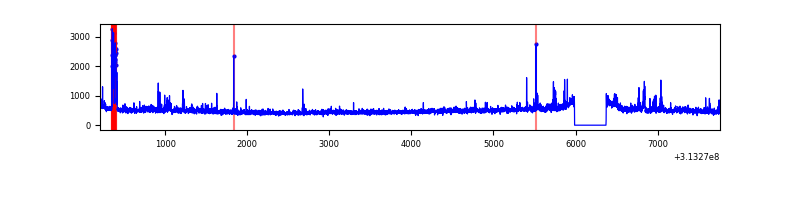 |
| C | 7556 | 7172 | 5 | 5 | 0.07% | 0.07% | 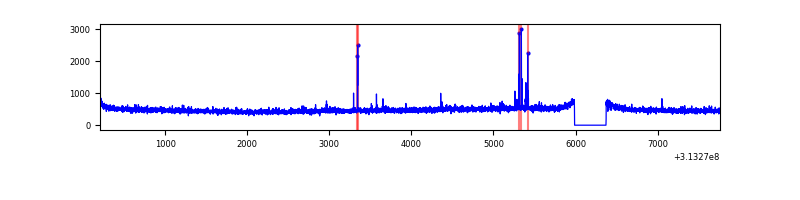 |
| D | 7555 | 7171 | 27 | 27 | 0.36% | 0.38% | 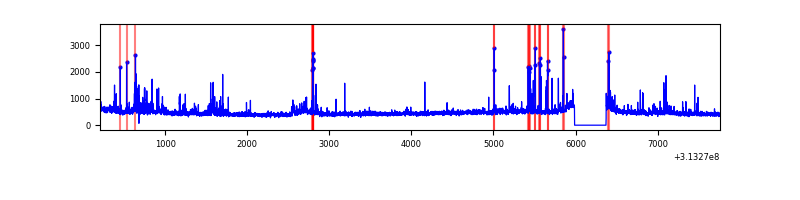 |
Top three noisy pixels from each quadrant. If the there are fewer than three noisy pixels in the level2.evt file, extra rows are filled as -1
| Pixel properties | Quadrant properties | ||||||
|---|---|---|---|---|---|---|---|
| Quadrant | DetID | PixID | Counts | Sigma | Mean | Median | Sigma |
| A | 11 | 47 | 93539 | 531.11 | 865 | 845 | 174.5 |
| A | 13 | 254 | 12500 | 66.78 | 865 | 845 | 174.5 |
| A | 4 | 2 | 7782 | 39.75 | 865 | 845 | 174.5 |
| B | 15 | 33 | 117989 | 721.61 | 860 | 839 | 162.3 |
| B | 0 | 190 | 102773 | 627.89 | 860 | 839 | 162.3 |
| B | 0 | 219 | 51277 | 310.68 | 860 | 839 | 162.3 |
| C | 14 | 238 | 131815 | 673.25 | 831 | 835 | 194.6 |
| C | 0 | 207 | 20324 | 100.17 | 831 | 835 | 194.6 |
| C | 9 | 54 | 12821 | 61.61 | 831 | 835 | 194.6 |
| D | 12 | 233 | 157738 | 769.56 | 841 | 817 | 203.9 |
| D | 7 | 238 | 92061 | 447.47 | 841 | 817 | 203.9 |
| D | 2 | 136 | 48945 | 236.02 | 841 | 817 | 203.9 |
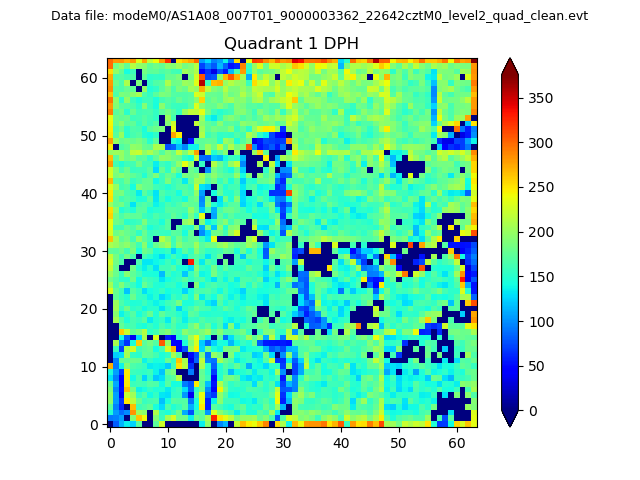
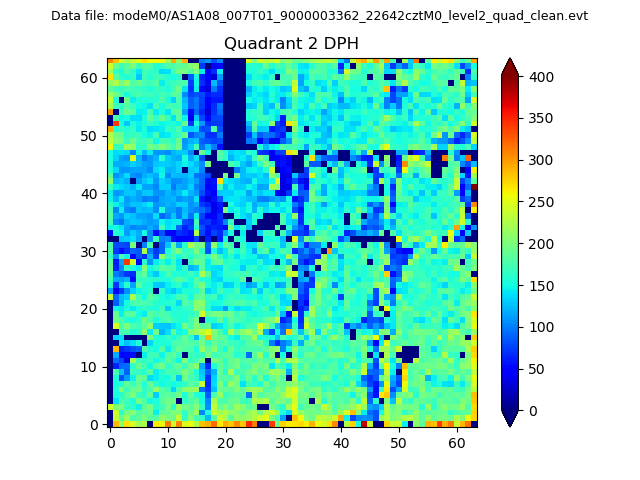
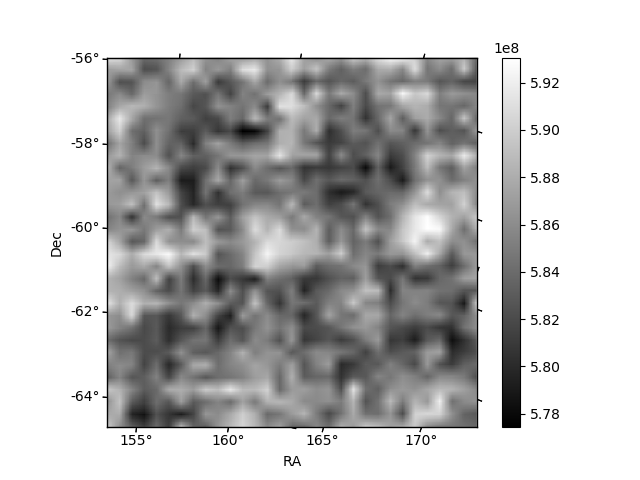
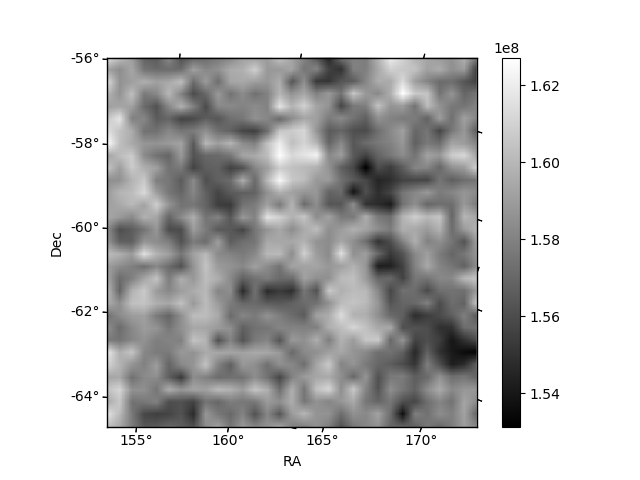
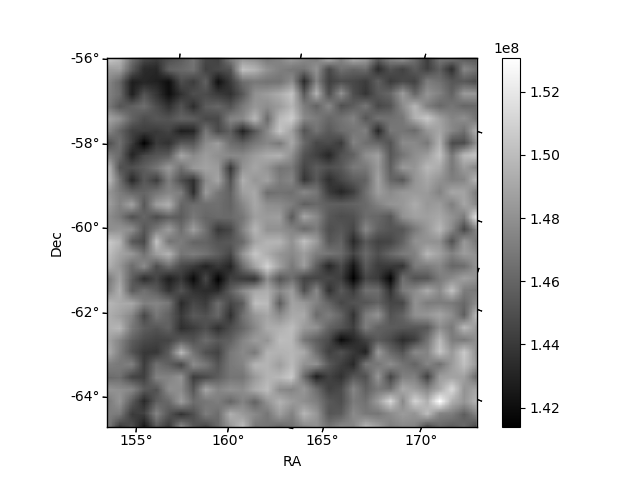
Histogram calculated using DETX and DETY for each event in the final _common_clean file
| Quadrant A |  |
 |
Quadrant B |
|---|---|---|---|
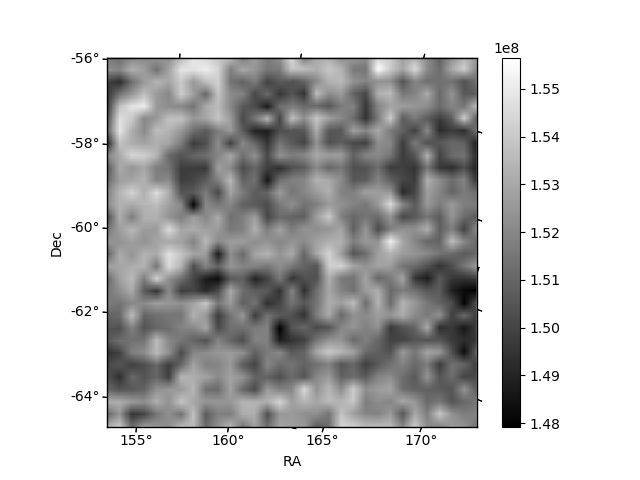
| Quadrant D | 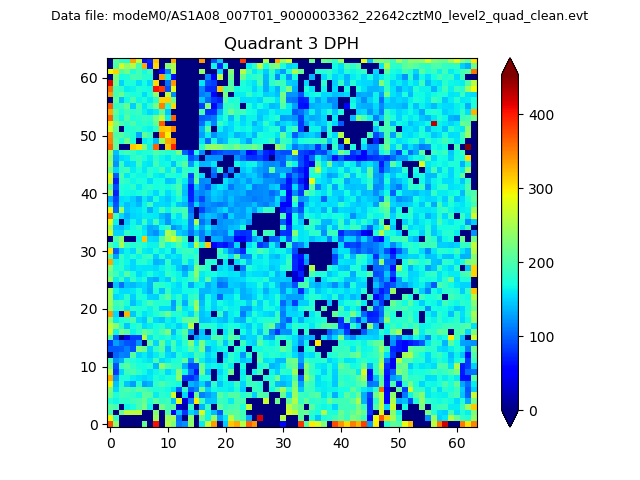 |
 |
Quadrant C |
| Plot type | Count rate plots | Images |
|---|---|---|
| Comparison with Poisson distribution Blue bars denote a histogram of data divided into 1 sec bins. Red curve is a Poisson curve with rate = median count rate of data. |
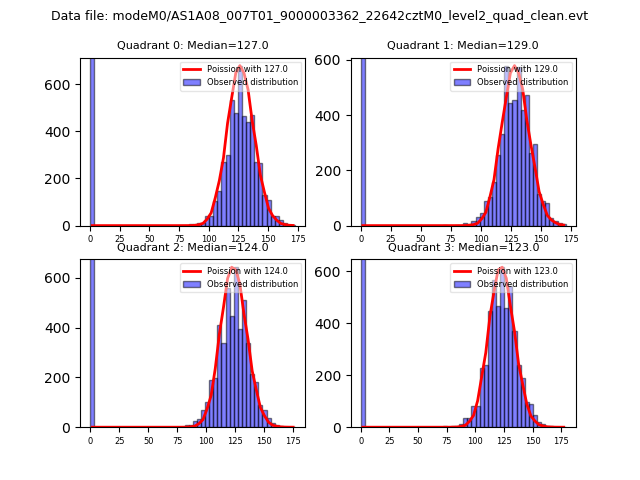 |
 |
| Quadrant-wise count rates Data is divided into 100 sec bins |
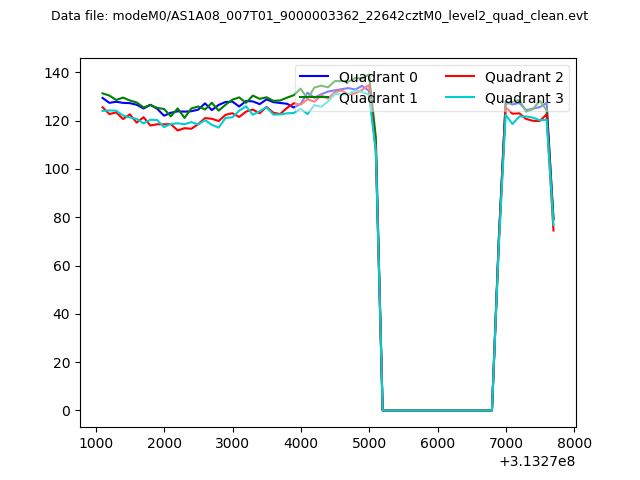 |
|
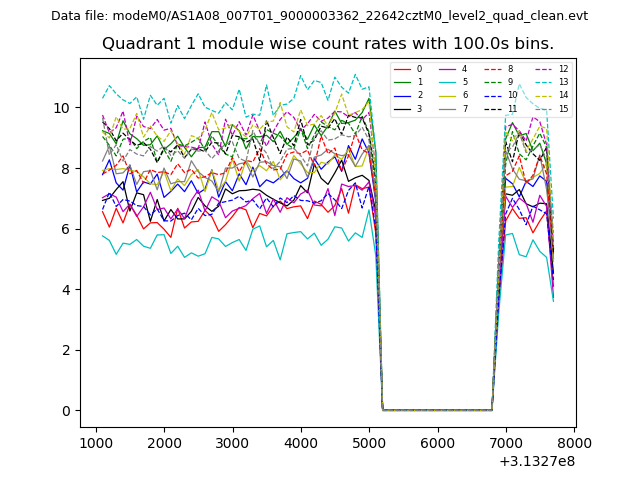
| Module-wise count rates for Quadrant A Data is divided into 100 sec bins |
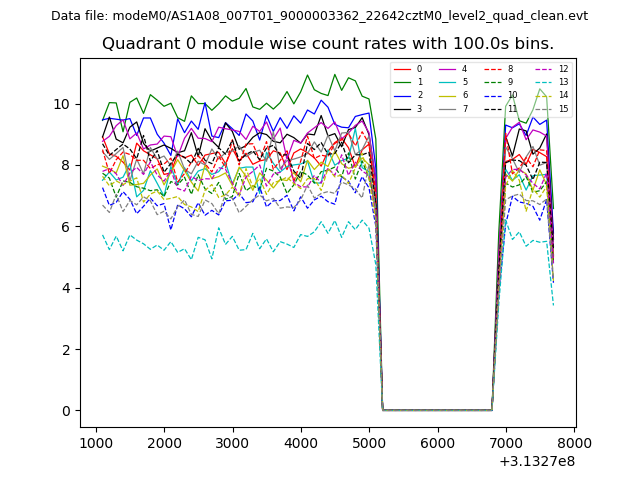 |
 |
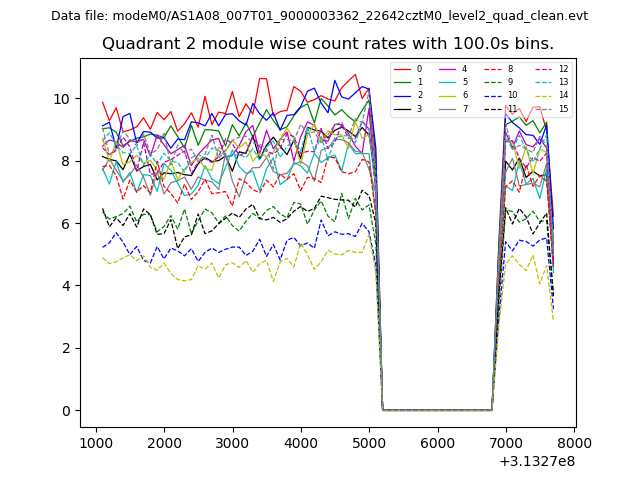
| Module-wise count rates for Quadrant B Data is divided into 100 sec bins |
 |
 |
| Module-wise count rates for Quadrant C Data is divided into 100 sec bins |
 |
 |
| Module-wise count rates for Quadrant D Data is divided into 100 sec bins |
 |
 |
| Parameter | Plot |
|---|---|
| CZT HV Monitor | 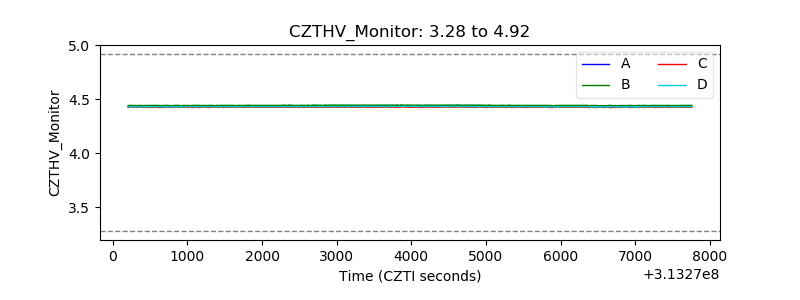 |
| D_VDD | 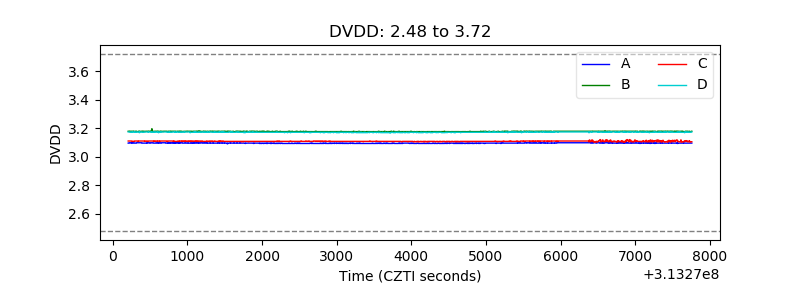 |
| Temperature 1 |  |
| Veto HV Monitor | 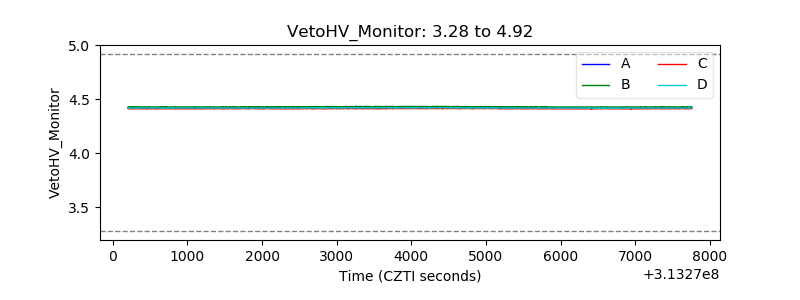 |
| Veto LLD | 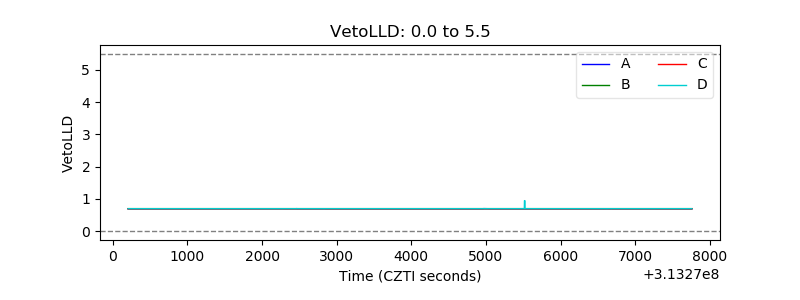 |
| Alpha Counter | 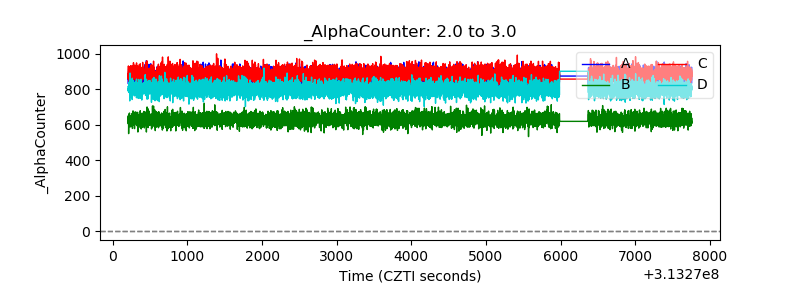 |
| _CPM_Rate | 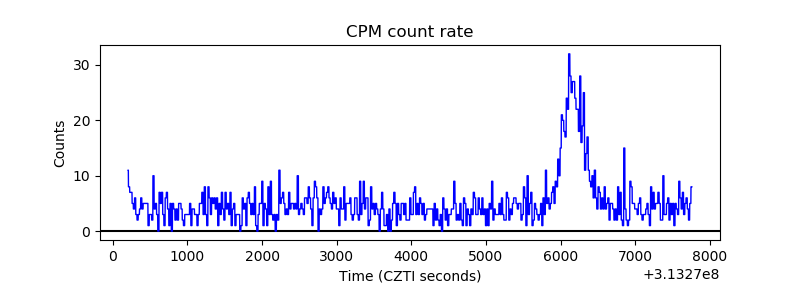 |
| CZT Counter | 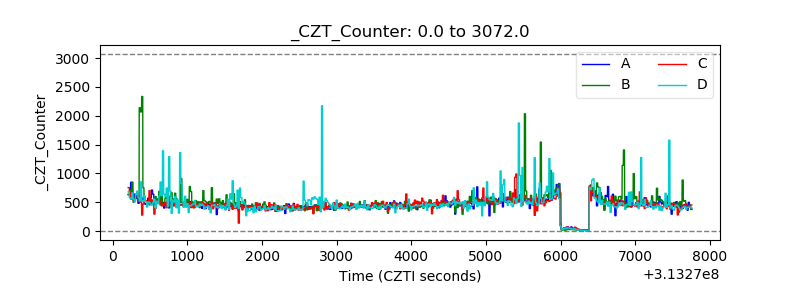 |
| +2.5 Volts monitor | 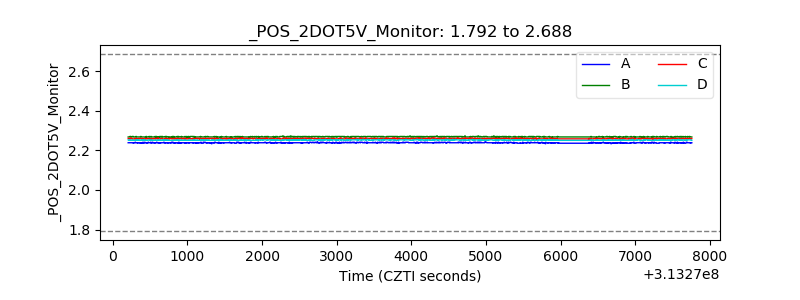 |
| +5 Volts monitor |  |
| _ROLL_ROT | 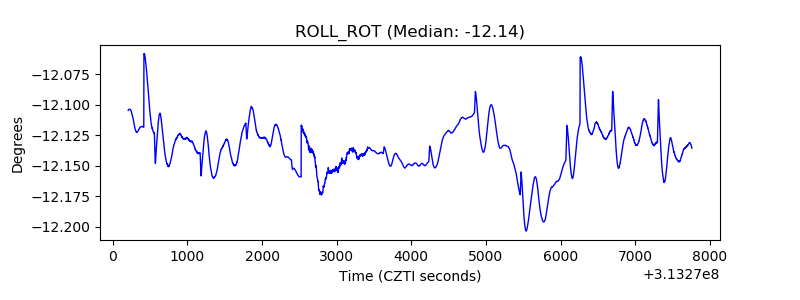 |
| _Roll_DEC |  |
| _Roll_RA | 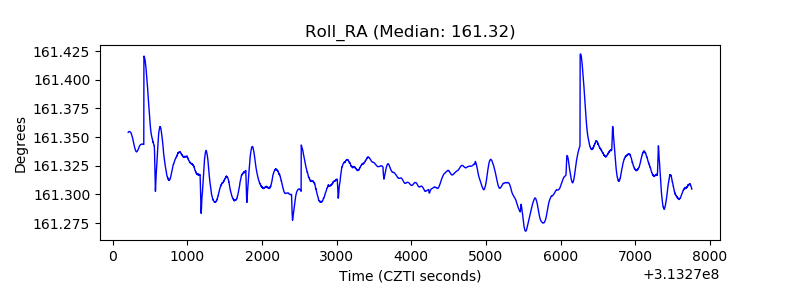 |
| Veto Counter | 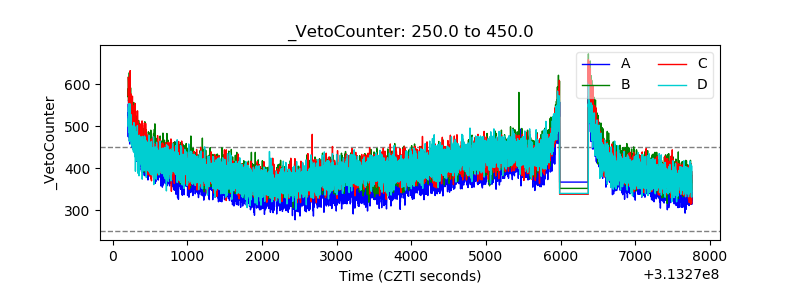 |