| Param | Original file | Final file |
|---|---|---|
| Filename | modeM0/AS1A08_007T01_9000003362_22643cztM0_level2.evt | modeM0/AS1A08_007T01_9000003362_22643cztM0_level2_quad_clean.evt |
| Size (bytes) | 510,292,800 | 106,548,480 |
| Size | 486.7 MB | 101.6 MB |
| Events in quadrant A | 3,709,110 | 685,148 |
| Events in quadrant B | 3,919,146 | 693,092 |
| Events in quadrant C | 3,599,555 | 664,070 |
| Events in quadrant D | 3,709,544 | 655,169 |
| Mode SS | |||
|---|---|---|---|
| Quadrant | BADHDUFLAG | Total packets | Discarded packets |
| A | 0 | 156 | 0 |
| B | 0 | 156 | 0 |
| C | 0 | 156 | 0 |
| D | 0 | 156 | 0 |
| Mode M0 | |||
|---|---|---|---|
| Quadrant | BADHDUFLAG | Total packets | Discarded packets |
| A | 0 | 15998 | 2 |
| B | 0 | 16653 | 2 |
| C | 0 | 15649 | 2 |
| D | 0 | 16293 | 3 |
| Mode M9 | |||
|---|---|---|---|
| Quadrant | BADHDUFLAG | Total packets | Discarded packets |
| A | 0 | 2 | 0 |
| B | 0 | 3 | 0 |
| C | 0 | 3 | 0 |
| D | 0 | 3 | 0 |
| Quadrant | Total seconds | Saturated seconds | Saturation percentage |
|---|---|---|---|
| A | 7604 | 43 | 0.565492% |
| B | 7604 | 110 | 1.446607% |
| C | 7604 | 110 | 1.446607% |
| D | 7603 | 61 | 0.802315% |
Noise dominated data is calculated using 1-second bins in cleaned event files. If a bin has >2000 counts, and if more than 50% of those come from <1% of pixels, then it is considered to be noise-dominated and hence unusable.
| Quadrant | # 1 sec bins | Bins with >0 counts | Bins with >2000 counts | High rate bins dominated by noise | Noise dominated (total time) | Noise dominated (detector-on time) | Marked lightcurve |
|---|---|---|---|---|---|---|---|
| A | 7814 | 7606 | 0 | 0 | 0.00% | 0.00% | 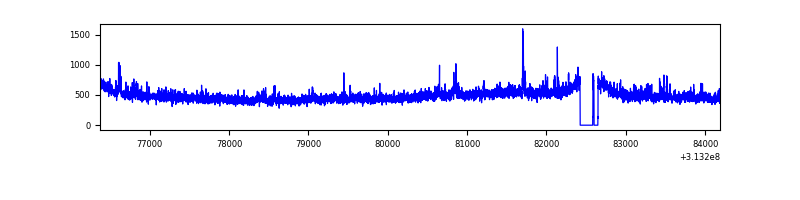 |
| B | 7814 | 7606 | 4 | 4 | 0.05% | 0.05% | 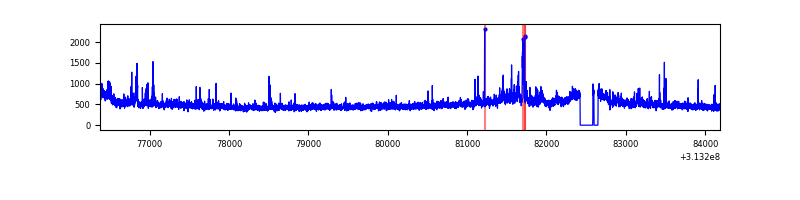 |
| C | 7814 | 7606 | 0 | 0 | 0.00% | 0.00% | 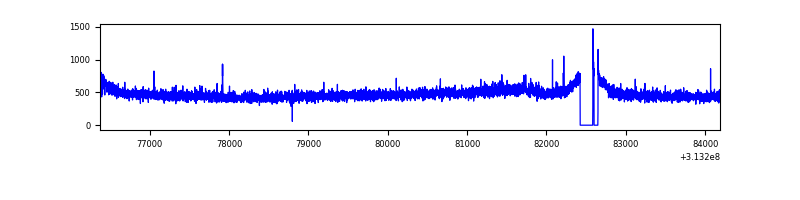 |
| D | 7813 | 7605 | 14 | 14 | 0.18% | 0.18% | 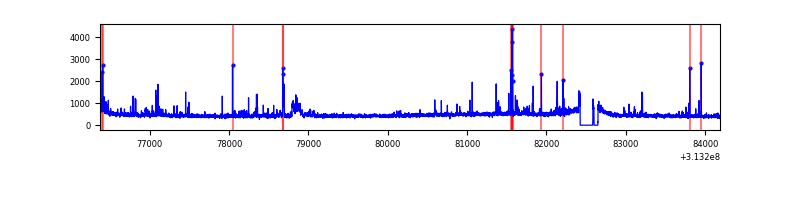 |
Top three noisy pixels from each quadrant. If the there are fewer than three noisy pixels in the level2.evt file, extra rows are filled as -1
| Pixel properties | Quadrant properties | ||||||
|---|---|---|---|---|---|---|---|
| Quadrant | DetID | PixID | Counts | Sigma | Mean | Median | Sigma |
| A | 11 | 47 | 173924 | 928.51 | 913 | 891 | 186.4 |
| A | 13 | 254 | 13981 | 70.24 | 913 | 891 | 186.4 |
| A | 0 | 226 | 7896 | 37.59 | 913 | 891 | 186.4 |
| B | 0 | 190 | 81420 | 463.95 | 915 | 894 | 173.6 |
| B | 0 | 229 | 78314 | 446.06 | 915 | 894 | 173.6 |
| B | 0 | 219 | 71171 | 404.9 | 915 | 894 | 173.6 |
| C | 14 | 238 | 139564 | 677.52 | 877 | 882 | 204.7 |
| C | 8 | 128 | 10252 | 45.78 | 877 | 882 | 204.7 |
| C | 2 | 16 | 9473 | 41.97 | 877 | 882 | 204.7 |
| D | 15 | 0 | 153371 | 710.4 | 888 | 860 | 214.7 |
| D | 12 | 233 | 60003 | 275.49 | 888 | 860 | 214.7 |
| D | 1 | 52 | 45304 | 207.02 | 888 | 860 | 214.7 |
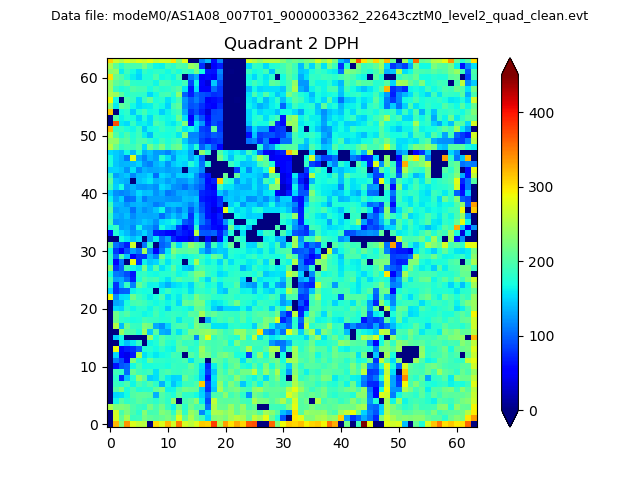
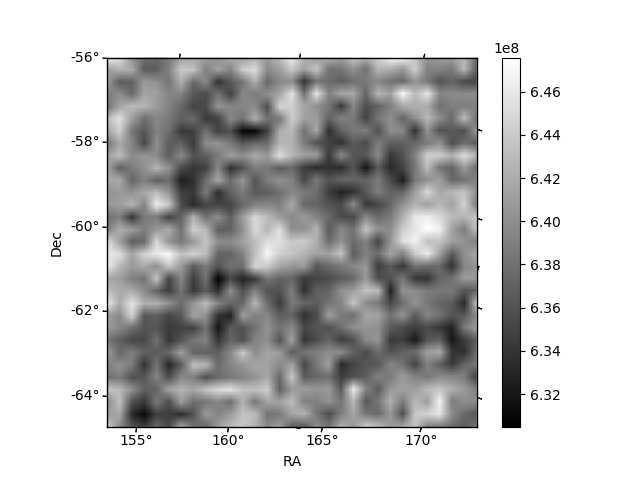
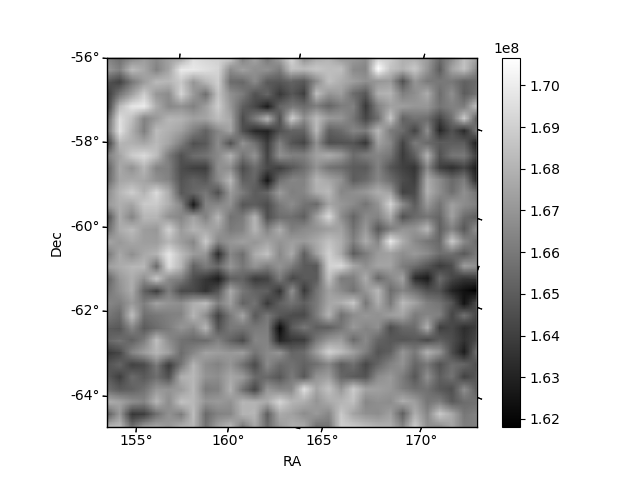
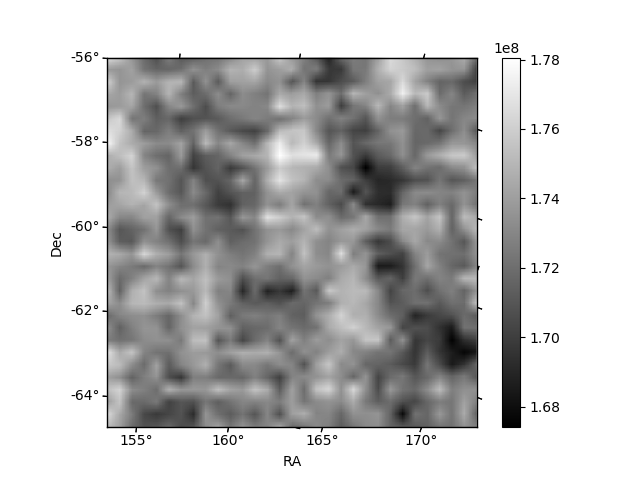
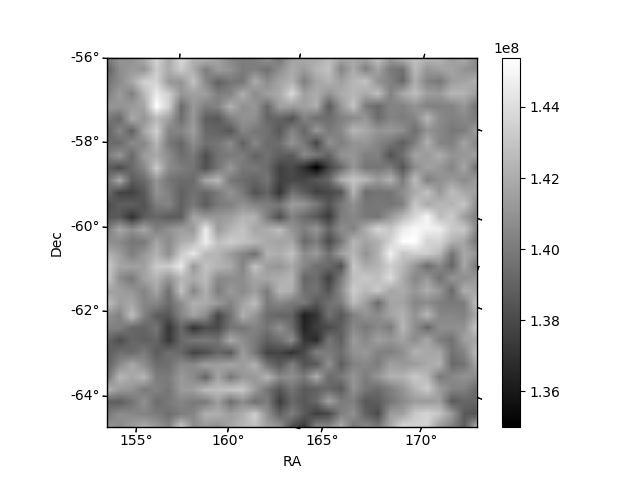
Histogram calculated using DETX and DETY for each event in the final _common_clean file
| Quadrant A | 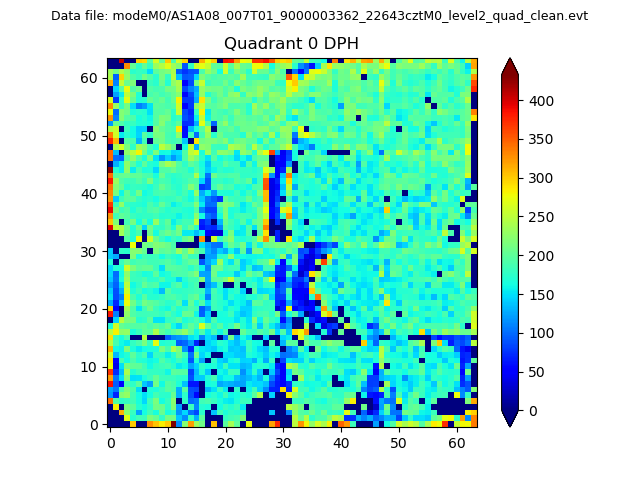 |
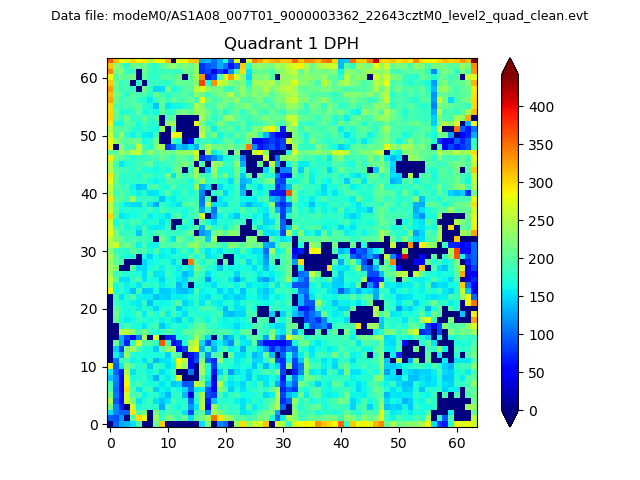 |
Quadrant B |
|---|---|---|---|
| Quadrant D | 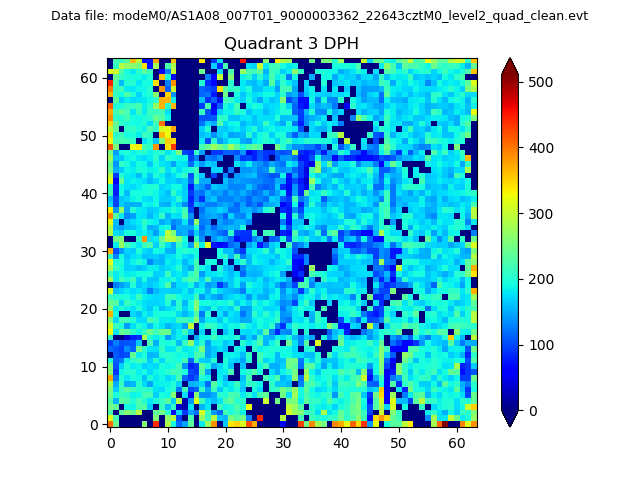 |
 |
Quadrant C |
| Plot type | Count rate plots | Images |
|---|---|---|
| Comparison with Poisson distribution Blue bars denote a histogram of data divided into 1 sec bins. Red curve is a Poisson curve with rate = median count rate of data. |
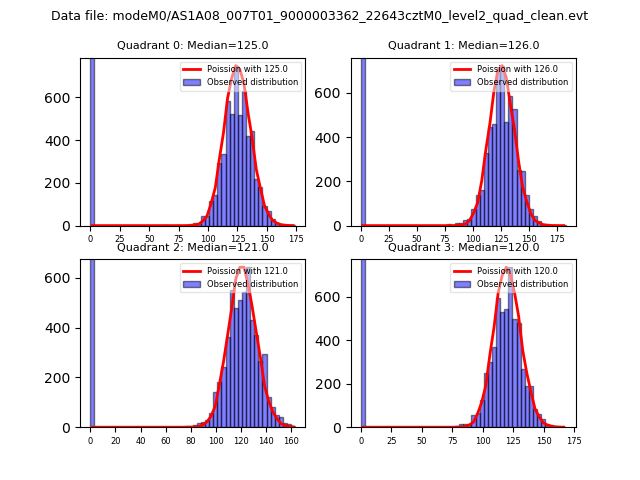 |
 |
| Quadrant-wise count rates Data is divided into 100 sec bins |
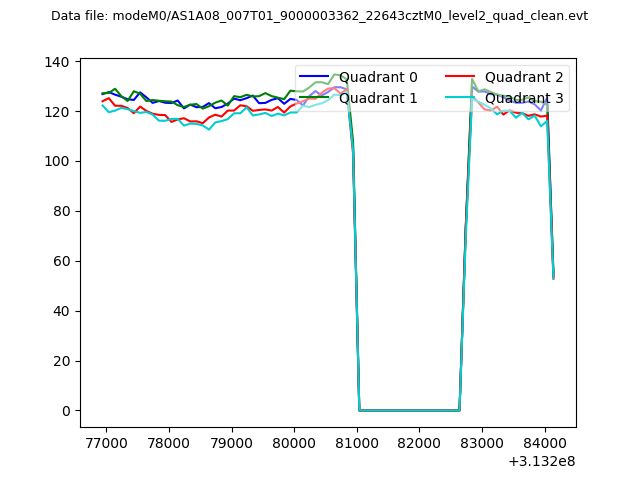 |
|
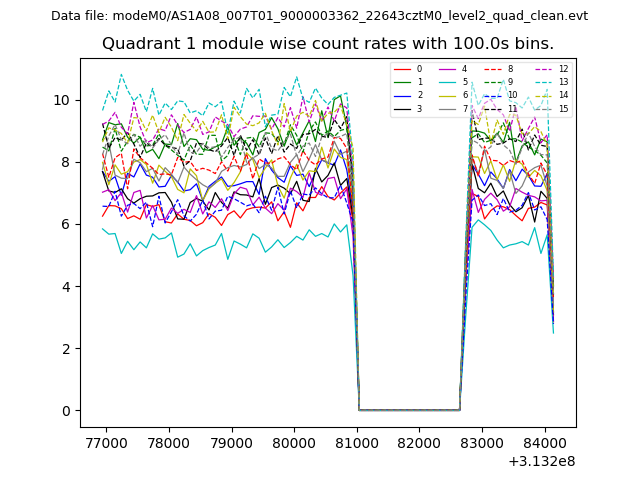
| Module-wise count rates for Quadrant A Data is divided into 100 sec bins |
 |
 |
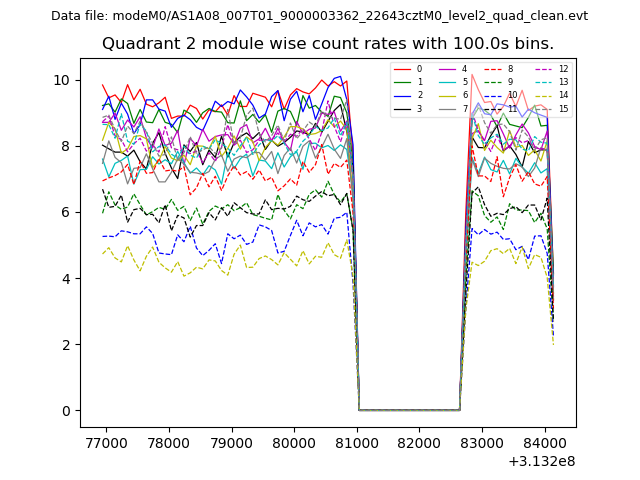
| Module-wise count rates for Quadrant B Data is divided into 100 sec bins |
 |
 |
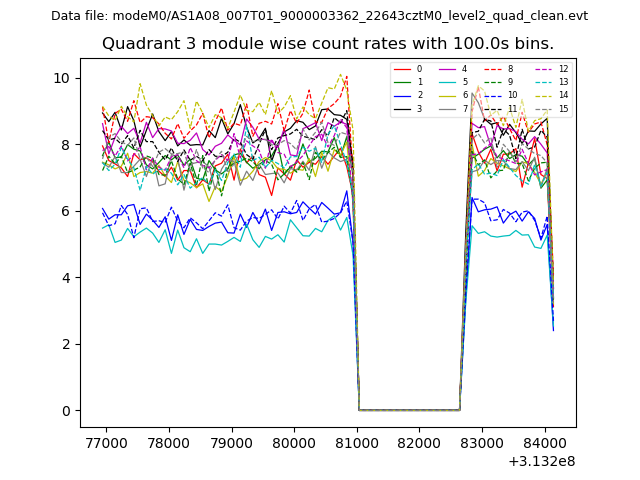
| Module-wise count rates for Quadrant C Data is divided into 100 sec bins |
 |
 |
| Module-wise count rates for Quadrant D Data is divided into 100 sec bins |
 |
 |
| Parameter | Plot |
|---|---|
| CZT HV Monitor |  |
| D_VDD | 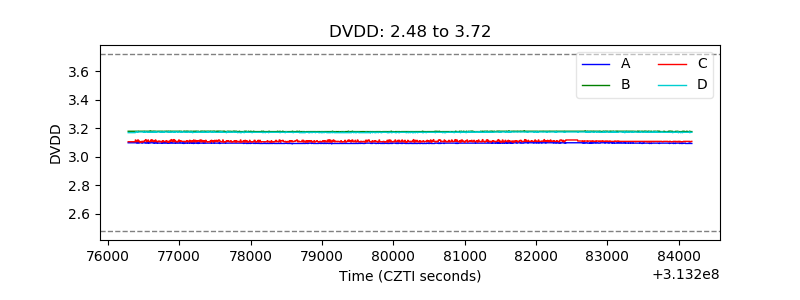 |
| Temperature 1 | 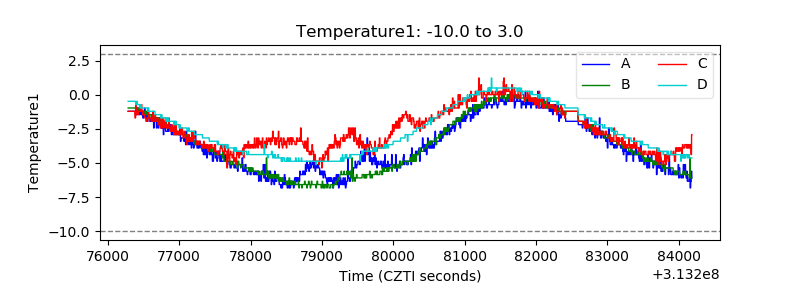 |
| Veto HV Monitor | 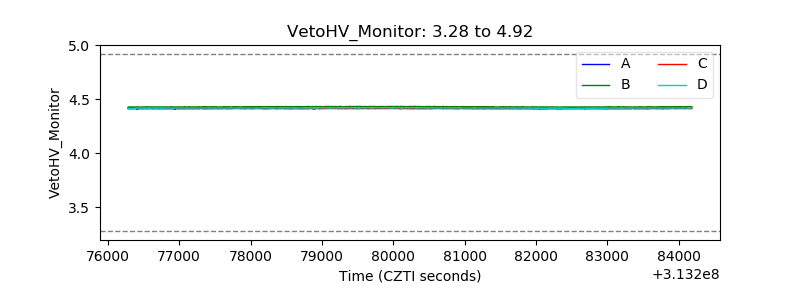 |
| Veto LLD | 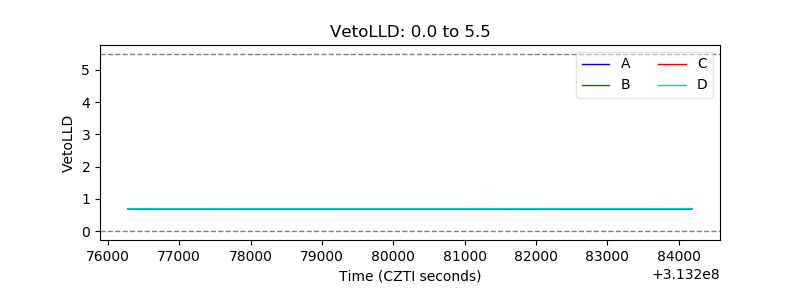 |
| Alpha Counter | 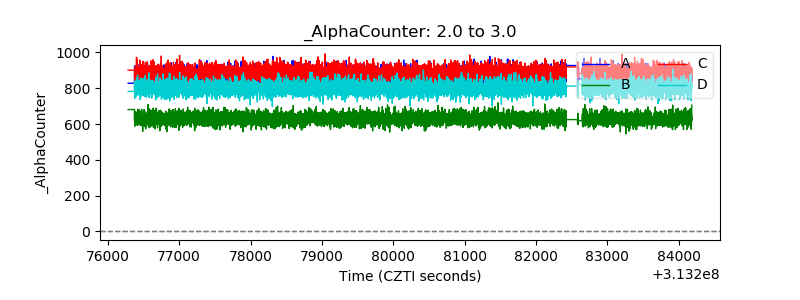 |
| _CPM_Rate | 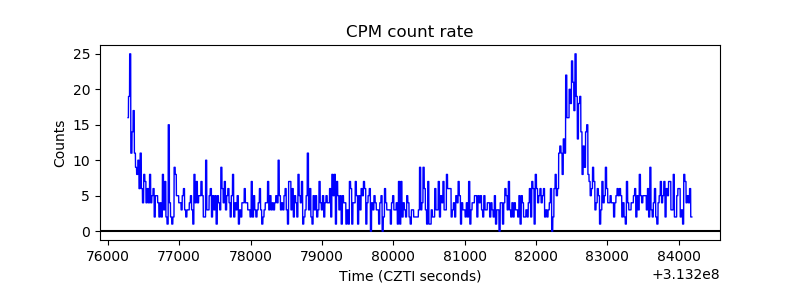 |
| CZT Counter | 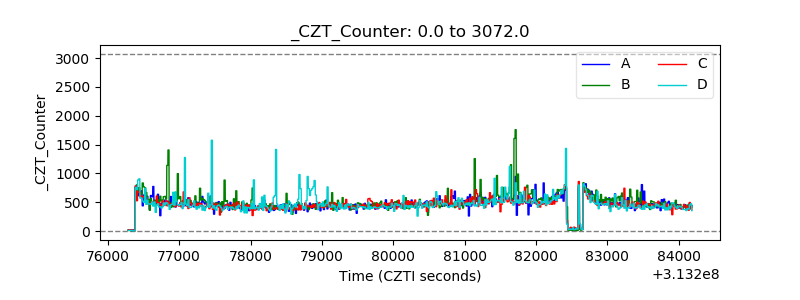 |
| +2.5 Volts monitor |  |
| +5 Volts monitor |  |
| _ROLL_ROT | 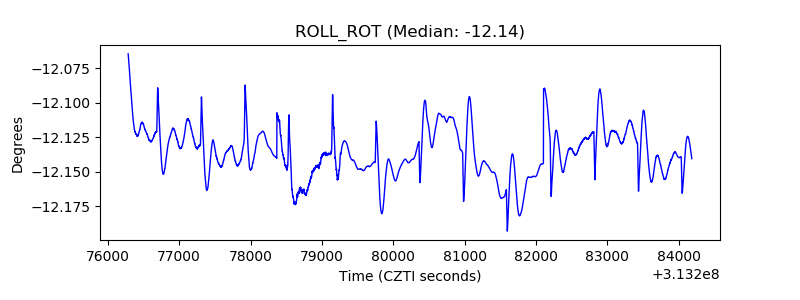 |
| _Roll_DEC | 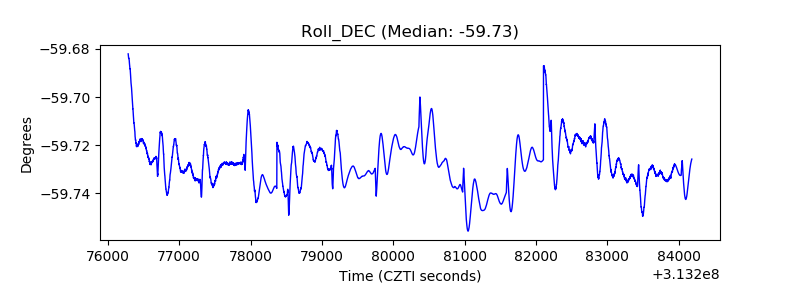 |
| _Roll_RA | 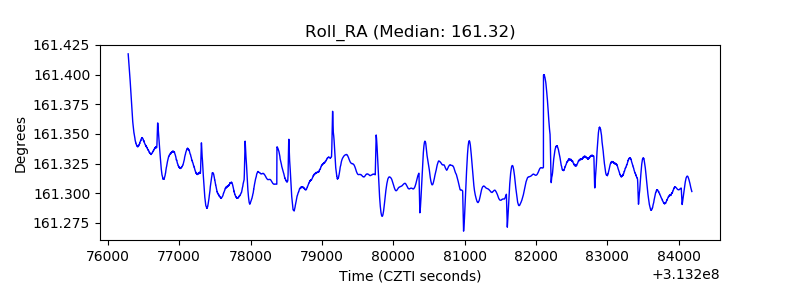 |
| Veto Counter | 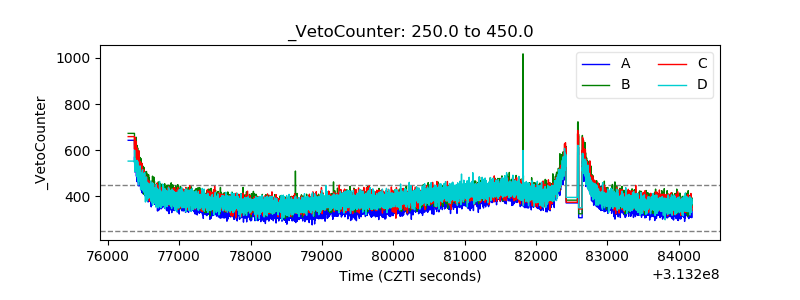 |