| Param | Original file | Final file |
|---|---|---|
| Filename | modeM0/AS1A08_007T01_9000003362_22644cztM0_level2.evt | modeM0/AS1A08_007T01_9000003362_22644cztM0_level2_quad_clean.evt |
| Size (bytes) | 504,820,800 | 108,884,160 |
| Size | 481.4 MB | 103.8 MB |
| Events in quadrant A | 3,587,975 | 703,732 |
| Events in quadrant B | 3,967,337 | 709,905 |
| Events in quadrant C | 3,623,545 | 683,408 |
| Events in quadrant D | 3,595,871 | 674,418 |
| Mode SS | |||
|---|---|---|---|
| Quadrant | BADHDUFLAG | Total packets | Discarded packets |
| A | 0 | 156 | 0 |
| B | 0 | 156 | 0 |
| C | 0 | 156 | 0 |
| D | 0 | 156 | 0 |
| Mode M0 | |||
|---|---|---|---|
| Quadrant | BADHDUFLAG | Total packets | Discarded packets |
| A | 0 | 15701 | 3 |
| B | 0 | 16917 | 2 |
| C | 0 | 15719 | 2 |
| D | 0 | 16049 | 2 |
| Mode M9 | |||
|---|---|---|---|
| Quadrant | BADHDUFLAG | Total packets | Discarded packets |
| A | 0 | 5 | 0 |
| B | 0 | 6 | 0 |
| C | 0 | 6 | 0 |
| D | 0 | 6 | 0 |
| Quadrant | Total seconds | Saturated seconds | Saturation percentage |
|---|---|---|---|
| A | 7561 | 28 | 0.370321% |
| B | 7561 | 77 | 1.018384% |
| C | 7561 | 122 | 1.613543% |
| D | 7561 | 44 | 0.581934% |
Noise dominated data is calculated using 1-second bins in cleaned event files. If a bin has >2000 counts, and if more than 50% of those come from <1% of pixels, then it is considered to be noise-dominated and hence unusable.
| Quadrant | # 1 sec bins | Bins with >0 counts | Bins with >2000 counts | High rate bins dominated by noise | Noise dominated (total time) | Noise dominated (detector-on time) | Marked lightcurve |
|---|---|---|---|---|---|---|---|
| A | 8031 | 7563 | 2 | 2 | 0.02% | 0.03% | 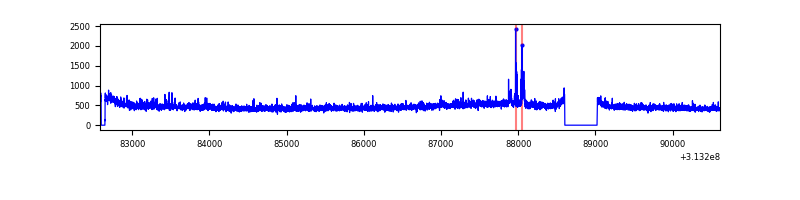 |
| B | 8031 | 7563 | 9 | 9 | 0.11% | 0.12% | 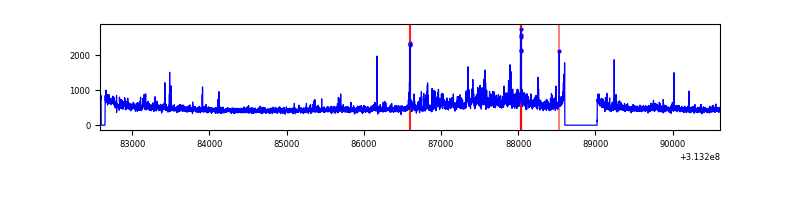 |
| C | 8031 | 7563 | 26 | 26 | 0.32% | 0.34% | 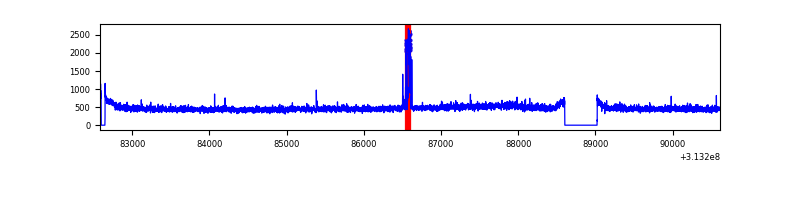 |
| D | 8031 | 7563 | 20 | 20 | 0.25% | 0.26% | 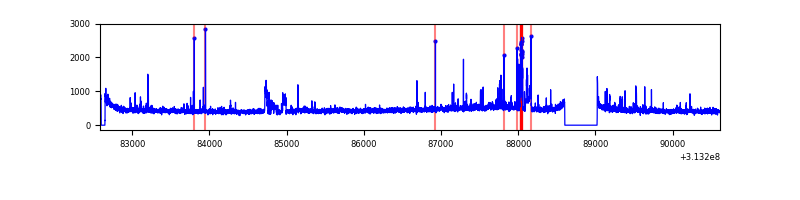 |
Top three noisy pixels from each quadrant. If the there are fewer than three noisy pixels in the level2.evt file, extra rows are filled as -1
| Pixel properties | Quadrant properties | ||||||
|---|---|---|---|---|---|---|---|
| Quadrant | DetID | PixID | Counts | Sigma | Mean | Median | Sigma |
| A | 11 | 47 | 88216 | 484.23 | 895 | 875 | 180.4 |
| A | 13 | 170 | 44298 | 240.74 | 895 | 875 | 180.4 |
| A | 13 | 254 | 13022 | 67.34 | 895 | 875 | 180.4 |
| B | 0 | 229 | 207651 | 1219.63 | 897 | 874 | 169.5 |
| B | 0 | 219 | 90959 | 531.35 | 897 | 874 | 169.5 |
| B | 0 | 190 | 43274 | 250.09 | 897 | 874 | 169.5 |
| C | 14 | 238 | 136395 | 666.92 | 864 | 869 | 203.2 |
| C | 10 | 22 | 97677 | 476.39 | 864 | 869 | 203.2 |
| C | 13 | 61 | 6082 | 25.65 | 864 | 869 | 203.2 |
| D | 13 | 172 | 75900 | 352.33 | 874 | 846 | 213.0 |
| D | 15 | 0 | 74727 | 346.82 | 874 | 846 | 213.0 |
| D | 7 | 238 | 51924 | 239.78 | 874 | 846 | 213.0 |
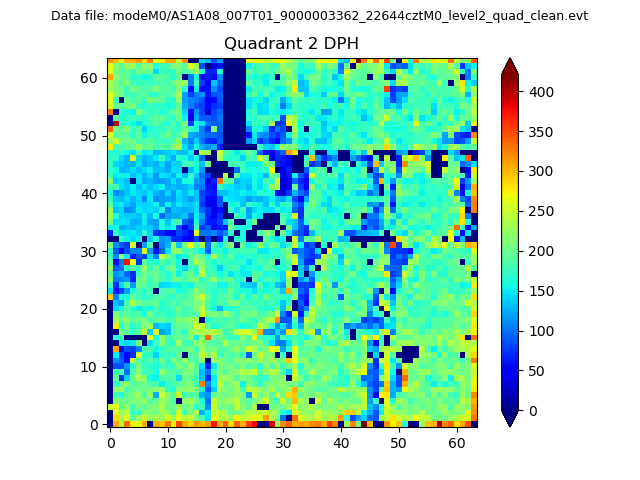
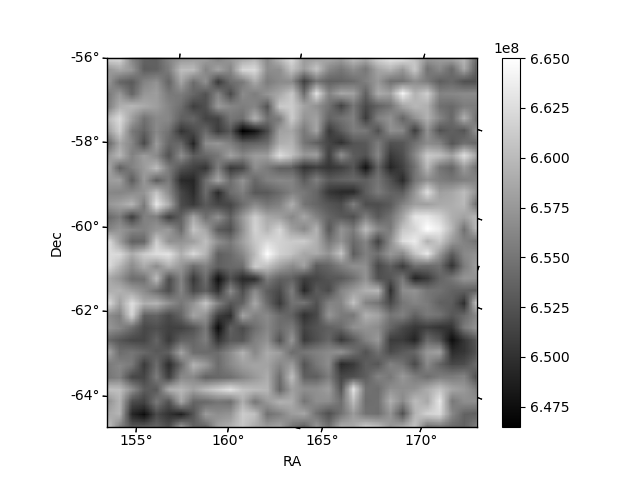
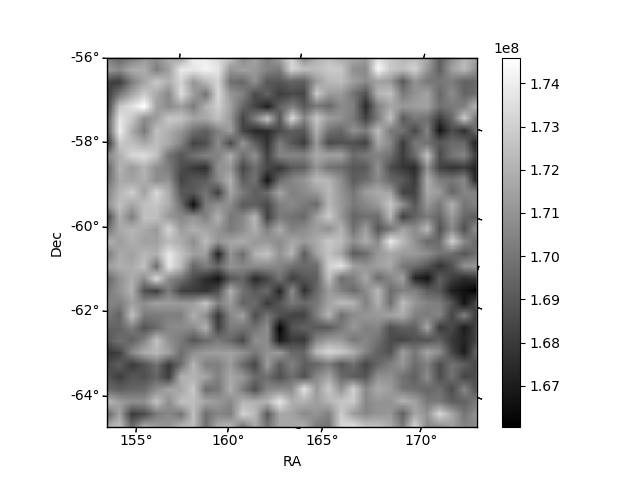
Histogram calculated using DETX and DETY for each event in the final _common_clean file
| Quadrant A | 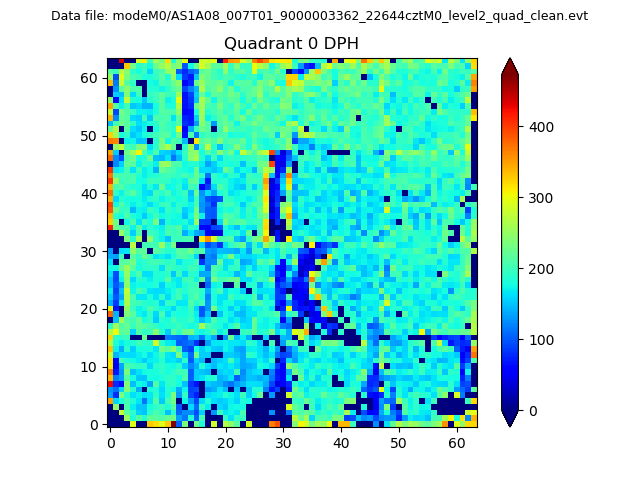 |
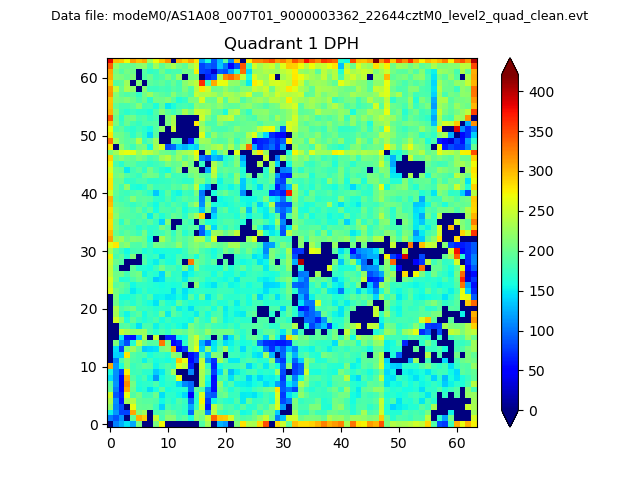 |
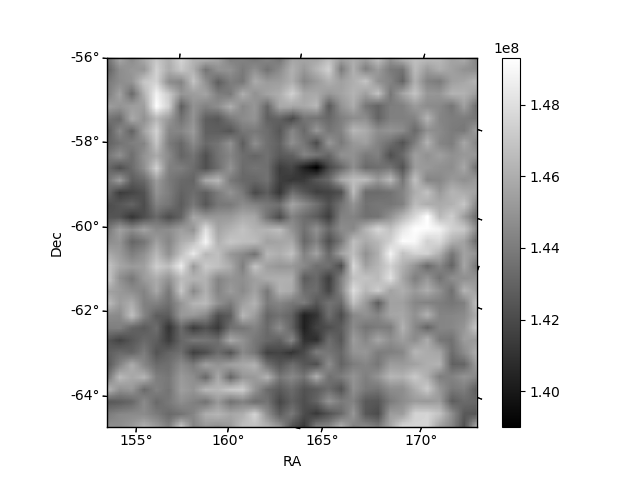
Quadrant B |
|---|---|---|---|
| Quadrant D | 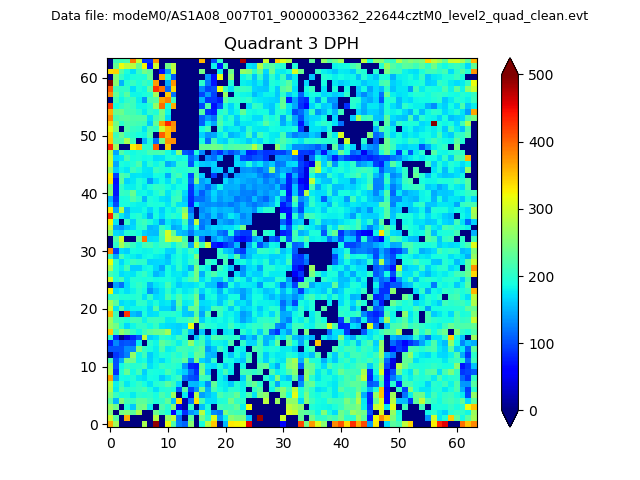 |
 |
Quadrant C |
| Plot type | Count rate plots | Images |
|---|---|---|
| Comparison with Poisson distribution Blue bars denote a histogram of data divided into 1 sec bins. Red curve is a Poisson curve with rate = median count rate of data. |
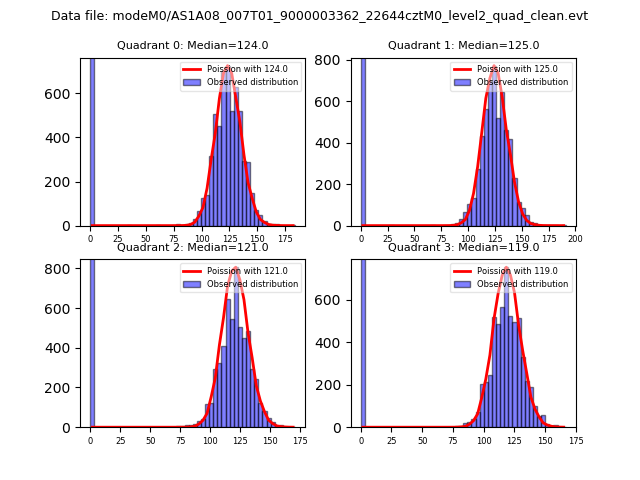 |
 |
| Quadrant-wise count rates Data is divided into 100 sec bins |
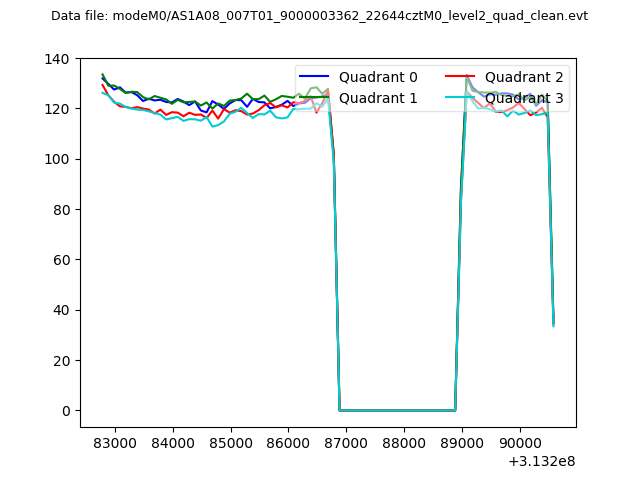 |
|
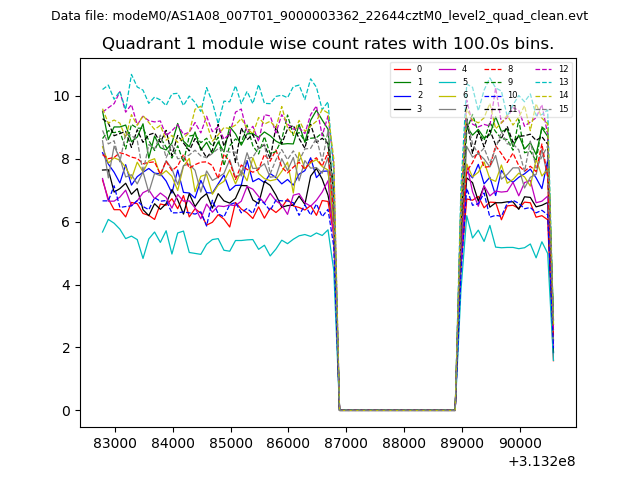
| Module-wise count rates for Quadrant A Data is divided into 100 sec bins |
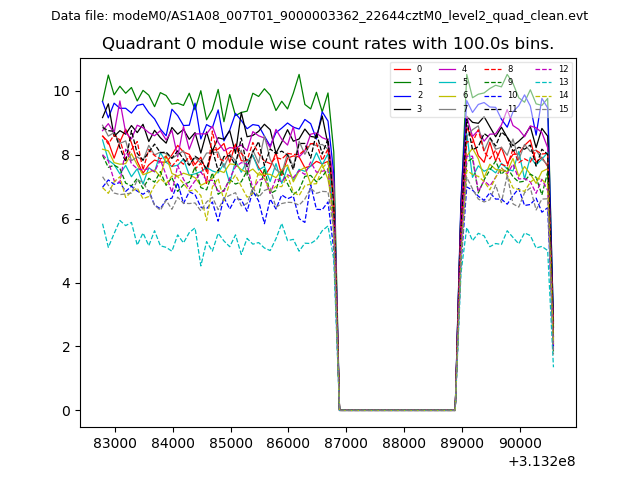 |
 |
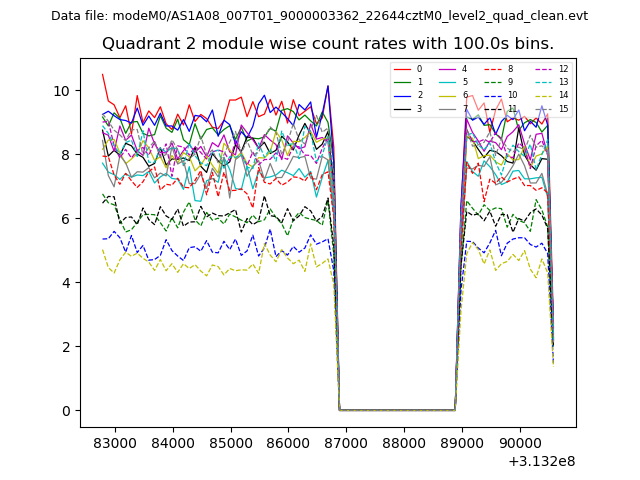
| Module-wise count rates for Quadrant B Data is divided into 100 sec bins |
 |
 |
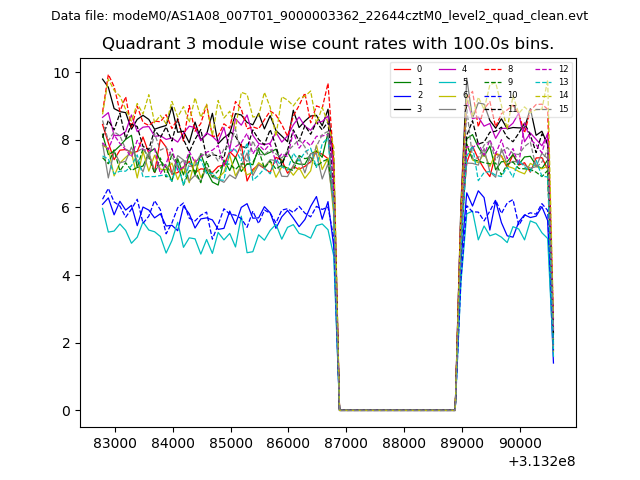
| Module-wise count rates for Quadrant C Data is divided into 100 sec bins |
 |
 |
| Module-wise count rates for Quadrant D Data is divided into 100 sec bins |
 |
 |
| Parameter | Plot |
|---|---|
| CZT HV Monitor |  |
| D_VDD | 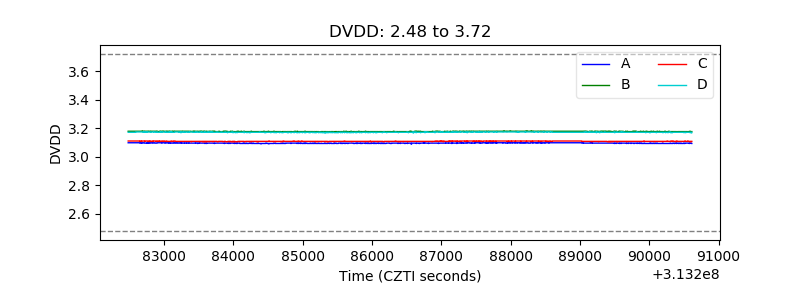 |
| Temperature 1 |  |
| Veto HV Monitor | 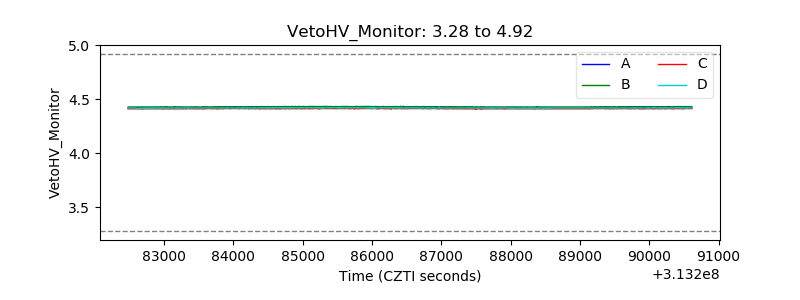 |
| Veto LLD | 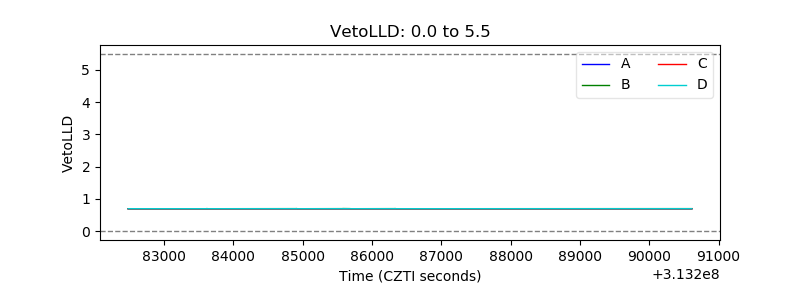 |
| Alpha Counter | 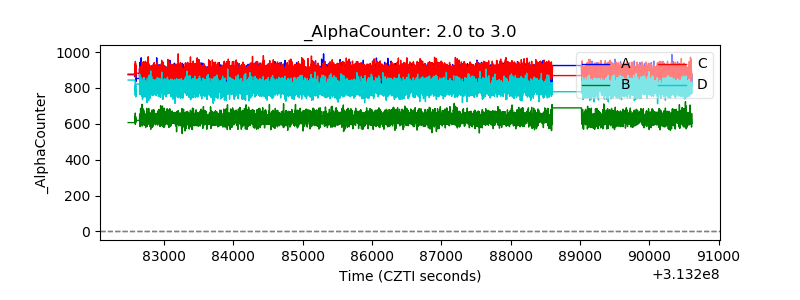 |
| _CPM_Rate | 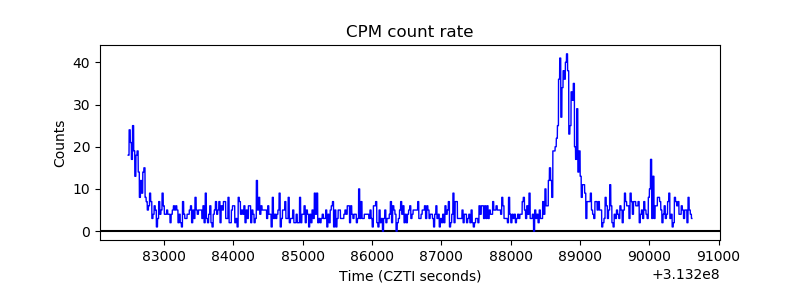 |
| CZT Counter | 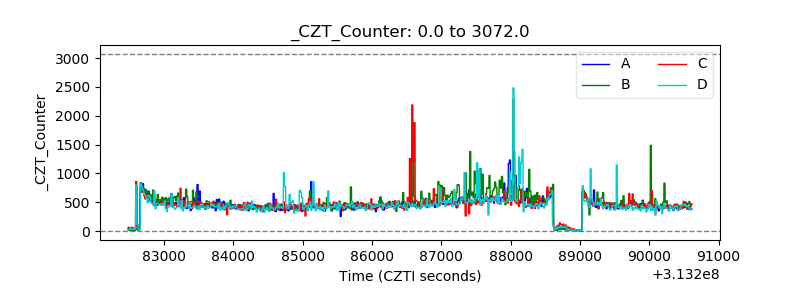 |
| +2.5 Volts monitor |  |
| +5 Volts monitor |  |
| _ROLL_ROT | 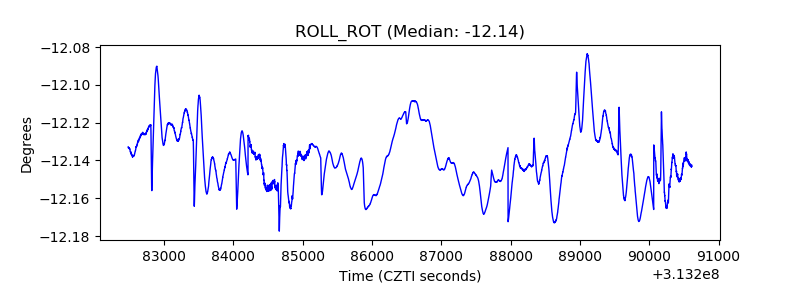 |
| _Roll_DEC | 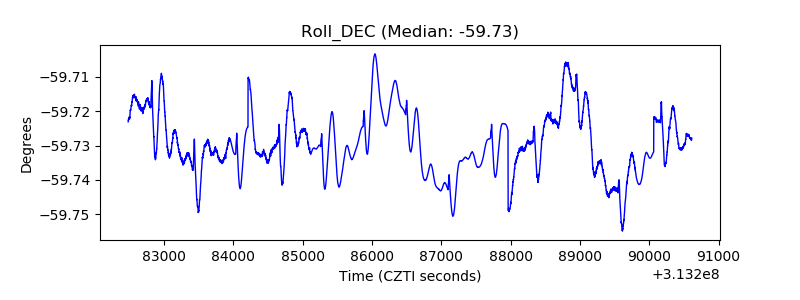 |
| _Roll_RA | 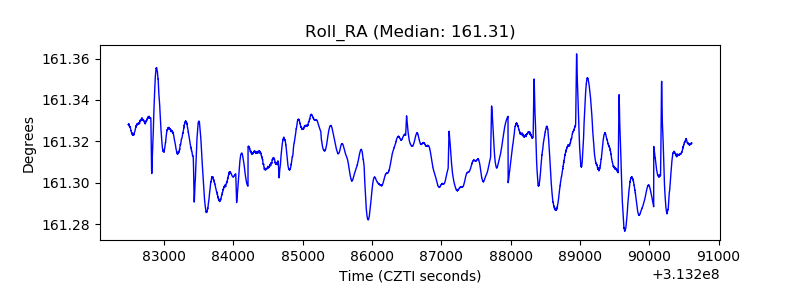 |
| Veto Counter | 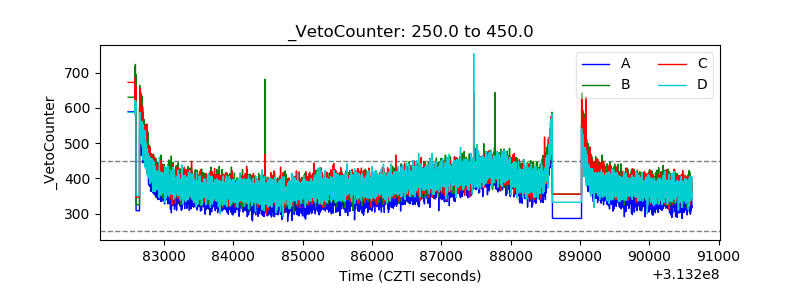 |