| Param | Original file | Final file |
|---|---|---|
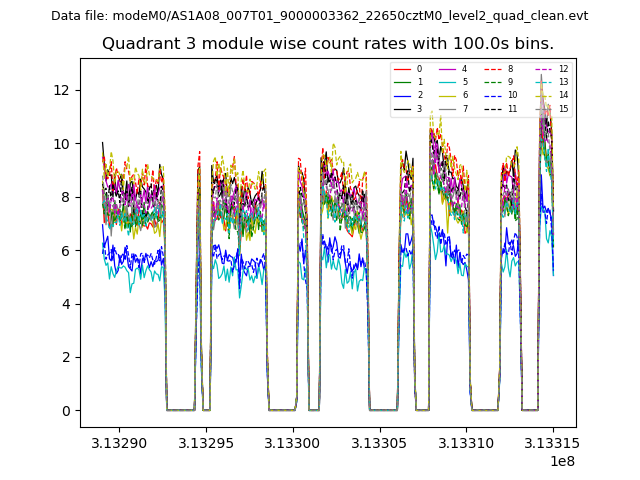
| Filename | modeM0/AS1A08_007T01_9000003362_22650cztM0_level2.evt | modeM0/AS1A08_007T01_9000003362_22650cztM0_level2_quad_clean.evt |
| Size (bytes) | 1,547,916,480 | 314,274,240 |
| Size | 1.4 GB | 299.7 MB |
| Events in quadrant A | 10,552,086 | 2,013,934 |
| Events in quadrant B | 11,249,067 | 2,040,153 |
| Events in quadrant C | 10,939,887 | 1,970,018 |
| Events in quadrant D | 12,597,082 | 1,926,018 |
| Mode SS | |||
|---|---|---|---|
| Quadrant | BADHDUFLAG | Total packets | Discarded packets |
| A | 0 | 466 | 0 |
| B | 0 | 466 | 0 |
| C | 0 | 466 | 0 |
| D | 0 | 466 | 0 |
| Mode M0 | |||
|---|---|---|---|
| Quadrant | BADHDUFLAG | Total packets | Discarded packets |
| A | 0 | 46374 | 5 |
| B | 0 | 48117 | 5 |
| C | 0 | 47033 | 5 |
| D | 0 | 52654 | 7 |
| Mode M9 | |||
|---|---|---|---|
| Quadrant | BADHDUFLAG | Total packets | Discarded packets |
| A | 0 | 36 | 0 |
| B | 0 | 37 | 0 |
| C | 0 | 37 | 0 |
| D | 0 | 37 | 0 |
| Quadrant | Total seconds | Saturated seconds | Saturation percentage |
|---|---|---|---|
| A | 22800 | 65 | 0.285088% |
| B | 22800 | 92 | 0.403509% |
| C | 22800 | 200 | 0.877193% |
| D | 22799 | 296 | 1.298303% |
Noise dominated data is calculated using 1-second bins in cleaned event files. If a bin has >2000 counts, and if more than 50% of those come from <1% of pixels, then it is considered to be noise-dominated and hence unusable.
| Quadrant | # 1 sec bins | Bins with >0 counts | Bins with >2000 counts | High rate bins dominated by noise | Noise dominated (total time) | Noise dominated (detector-on time) | Marked lightcurve |
|---|---|---|---|---|---|---|---|
| A | 26075 | 22804 | 0 | 0 | 0.00% | 0.00% | 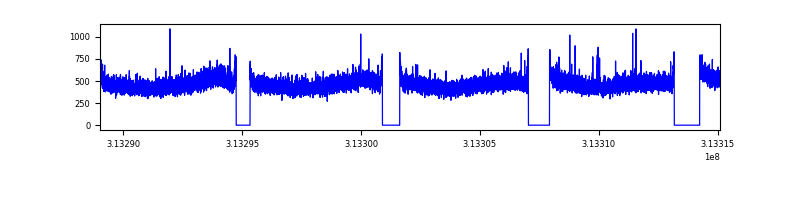 |
| B | 26075 | 22804 | 2 | 2 | 0.01% | 0.01% | 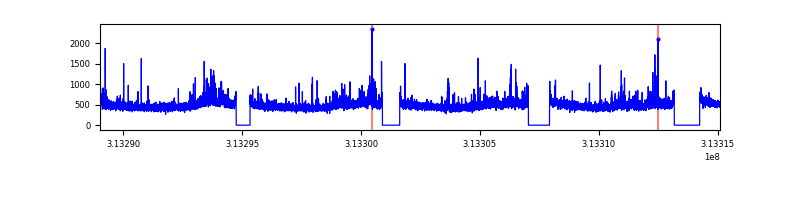 |
| C | 26075 | 22804 | 7 | 7 | 0.03% | 0.03% | 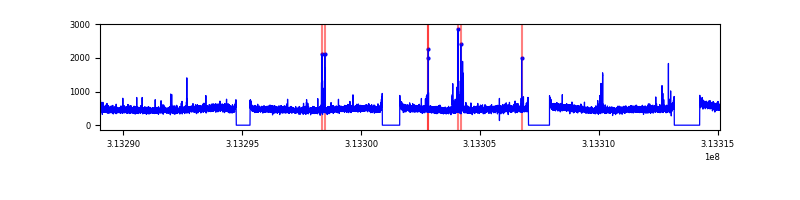 |
| D | 26074 | 22803 | 205 | 205 | 0.79% | 0.90% | 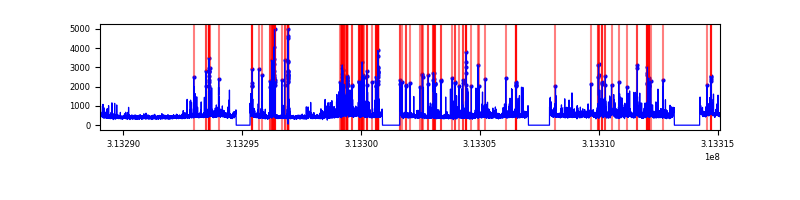 |
Top three noisy pixels from each quadrant. If the there are fewer than three noisy pixels in the level2.evt file, extra rows are filled as -1
| Pixel properties | Quadrant properties | ||||||
|---|---|---|---|---|---|---|---|
| Quadrant | DetID | PixID | Counts | Sigma | Mean | Median | Sigma |
| A | 13 | 254 | 38992 | 66.77 | 2728 | 2662 | 544.1 |
| A | 0 | 226 | 23820 | 38.89 | 2728 | 2662 | 544.1 |
| A | 3 | 137 | 22514 | 36.49 | 2728 | 2662 | 544.1 |
| B | 0 | 190 | 209454 | 408.86 | 2719 | 2656 | 505.8 |
| B | 0 | 219 | 108995 | 210.24 | 2719 | 2656 | 505.8 |
| B | 0 | 230 | 98600 | 189.69 | 2719 | 2656 | 505.8 |
| C | 14 | 238 | 414317 | 668.37 | 2646 | 2662 | 615.9 |
| C | 10 | 22 | 132786 | 211.27 | 2646 | 2662 | 615.9 |
| C | 10 | 23 | 62812 | 97.66 | 2646 | 2662 | 615.9 |
| D | 1 | 52 | 1743846 | 2682.1 | 2673 | 2594 | 649.2 |
| D | 7 | 238 | 273291 | 416.96 | 2673 | 2594 | 649.2 |
| D | 2 | 234 | 98858 | 148.28 | 2673 | 2594 | 649.2 |
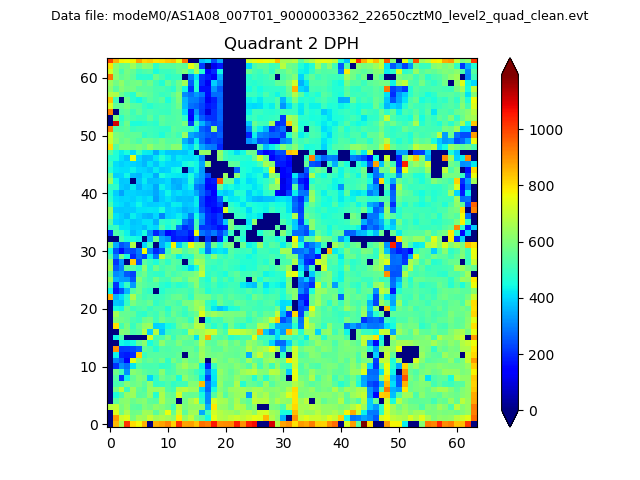
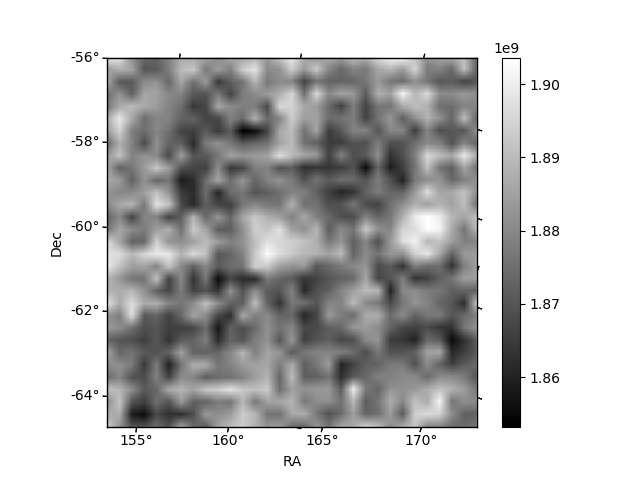
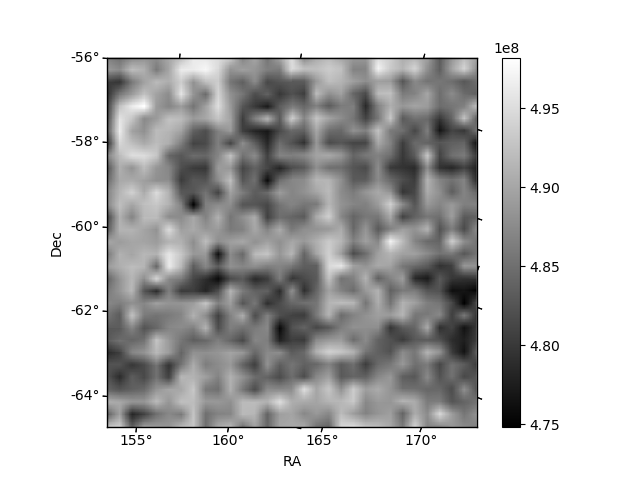
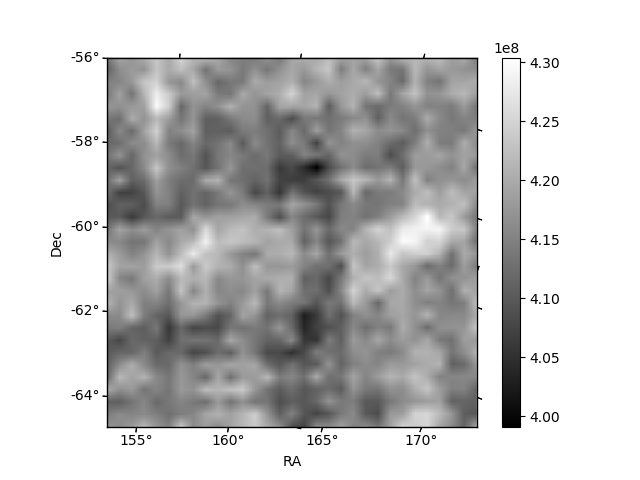
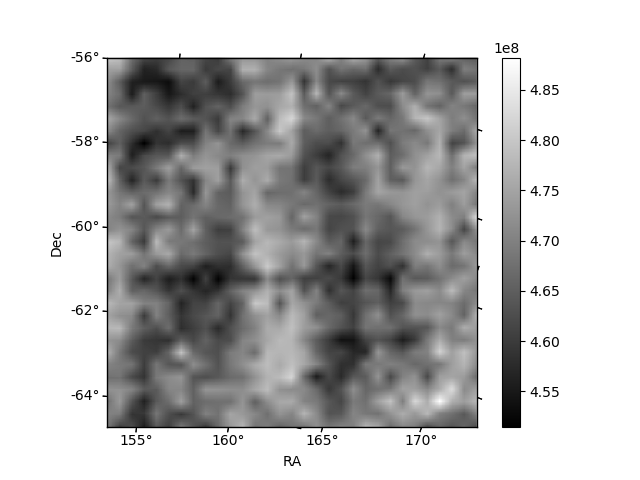
Histogram calculated using DETX and DETY for each event in the final _common_clean file
| Quadrant A | 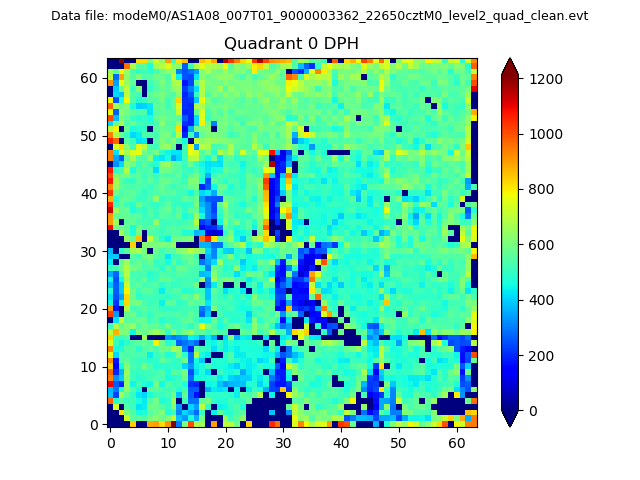 |
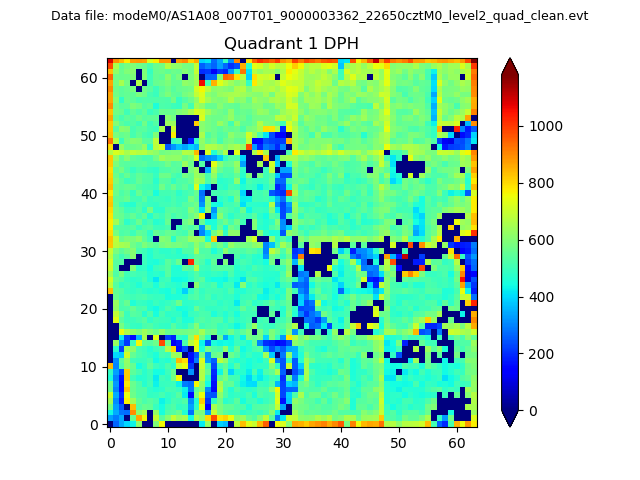 |
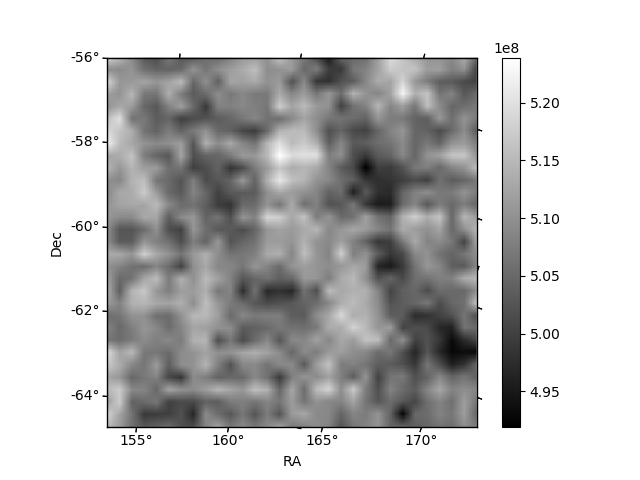
Quadrant B |
|---|---|---|---|
| Quadrant D | 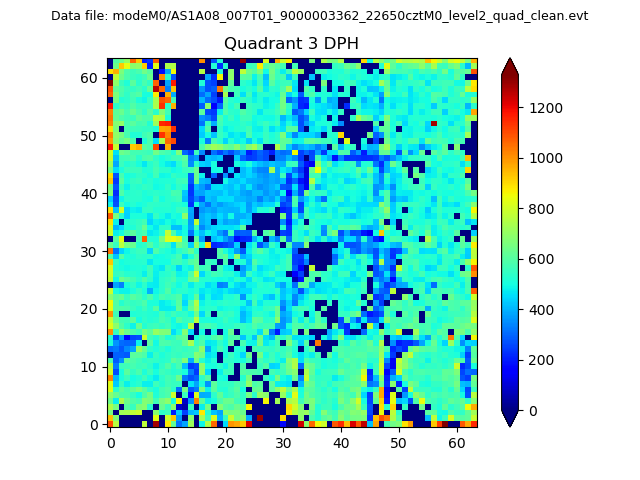 |
 |
Quadrant C |
| Plot type | Count rate plots | Images |
|---|---|---|
| Comparison with Poisson distribution Blue bars denote a histogram of data divided into 1 sec bins. Red curve is a Poisson curve with rate = median count rate of data. |
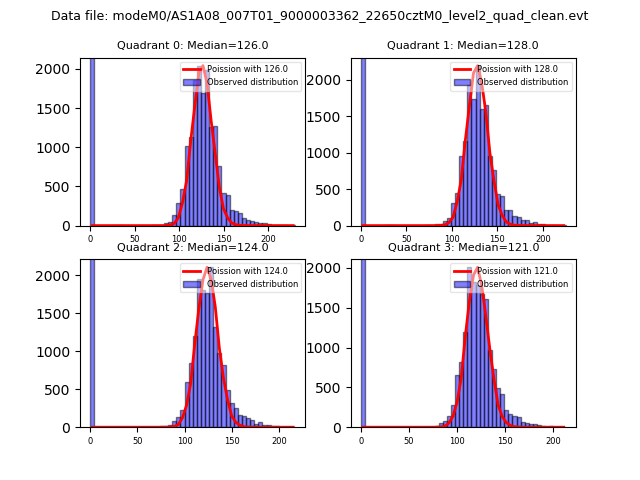 |
 |
| Quadrant-wise count rates Data is divided into 100 sec bins |
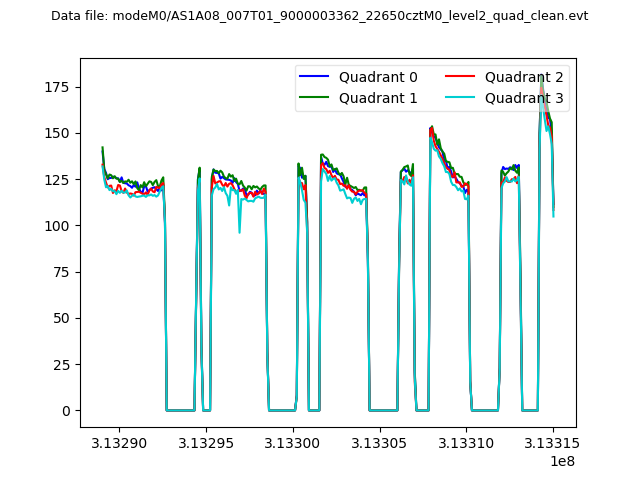 |
|
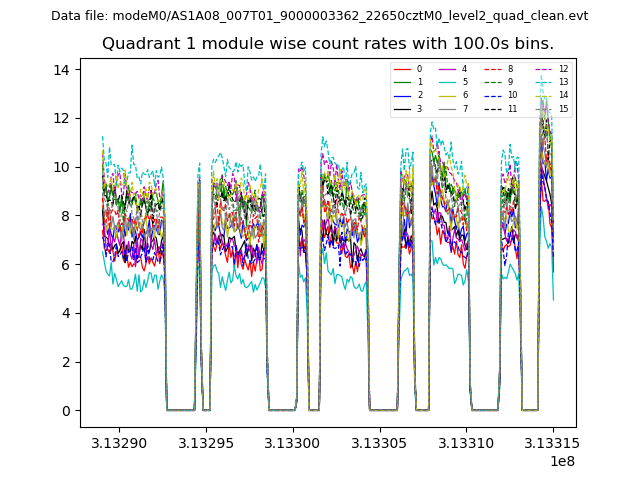
| Module-wise count rates for Quadrant A Data is divided into 100 sec bins |
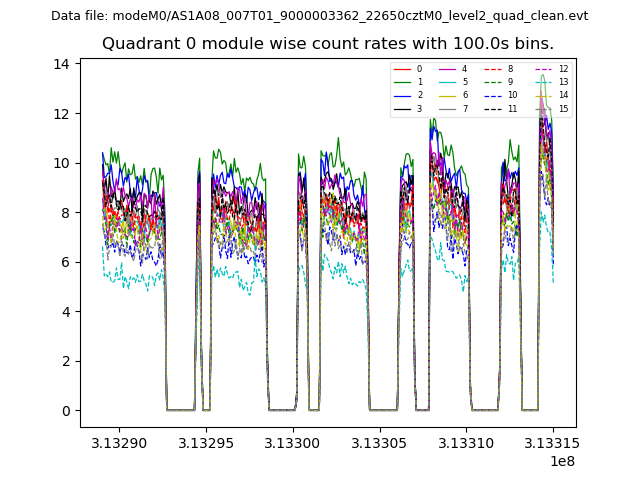 |
 |
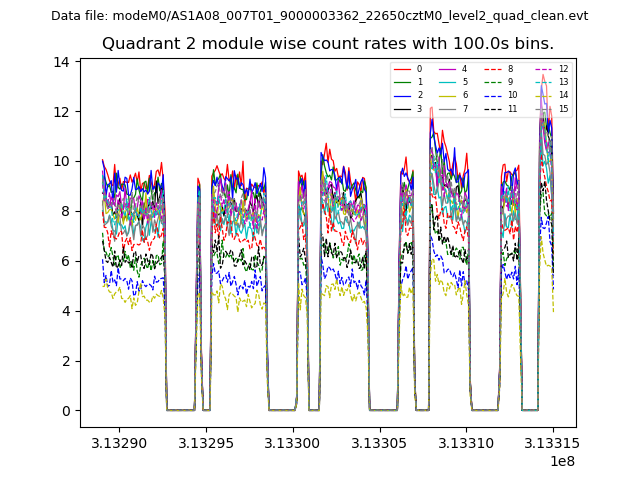
| Module-wise count rates for Quadrant B Data is divided into 100 sec bins |
 |
 |
| Module-wise count rates for Quadrant C Data is divided into 100 sec bins |
 |
 |
| Module-wise count rates for Quadrant D Data is divided into 100 sec bins |
 |
 |
| Parameter | Plot |
|---|---|
| CZT HV Monitor | 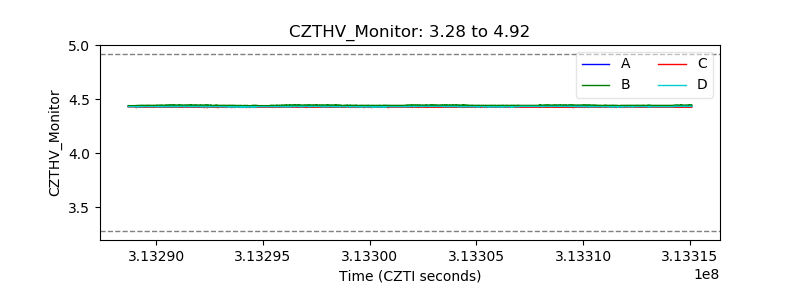 |
| D_VDD | 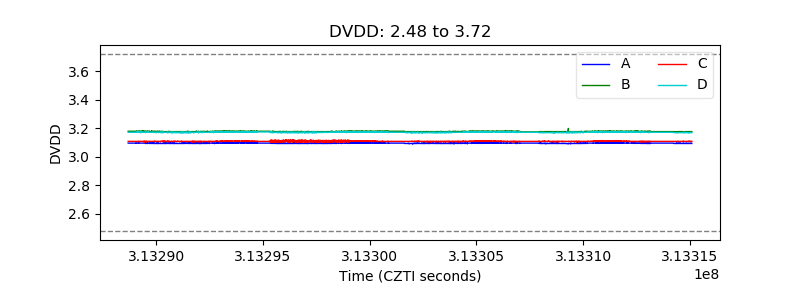 |
| Temperature 1 | 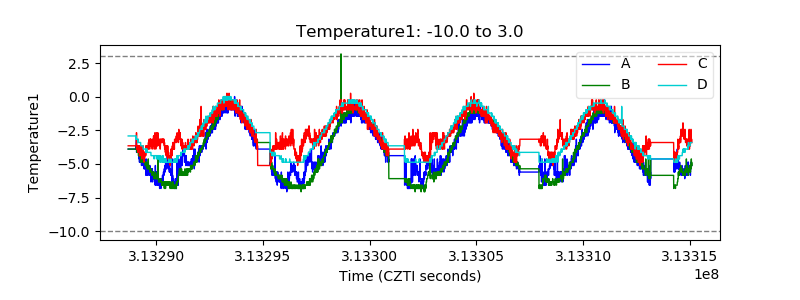 |
| Veto HV Monitor |  |
| Veto LLD | 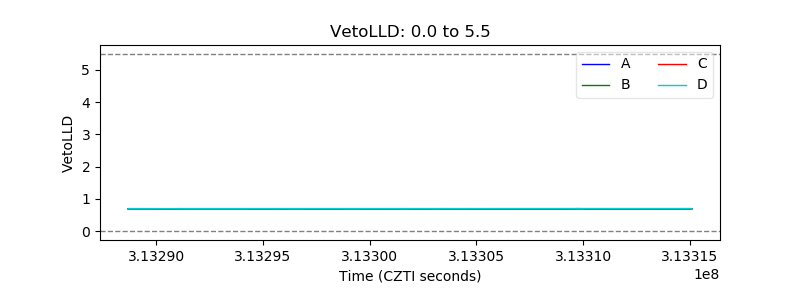 |
| Alpha Counter | 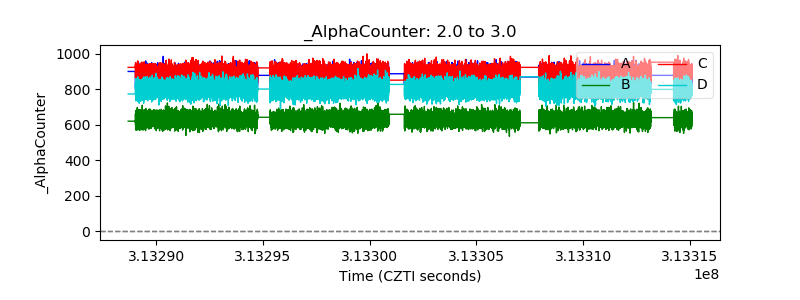 |
| _CPM_Rate | 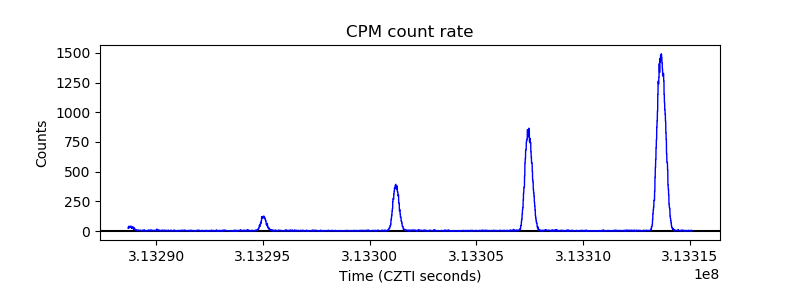 |
| CZT Counter | 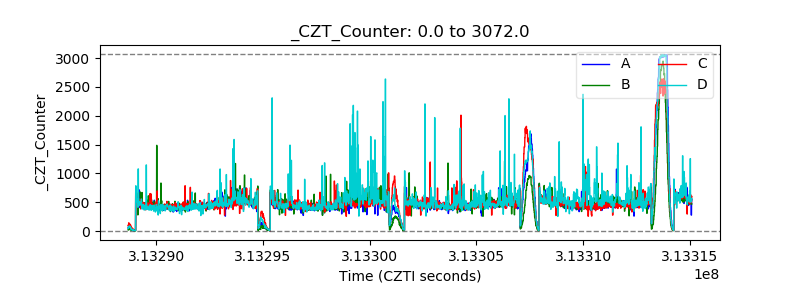 |
| +2.5 Volts monitor | 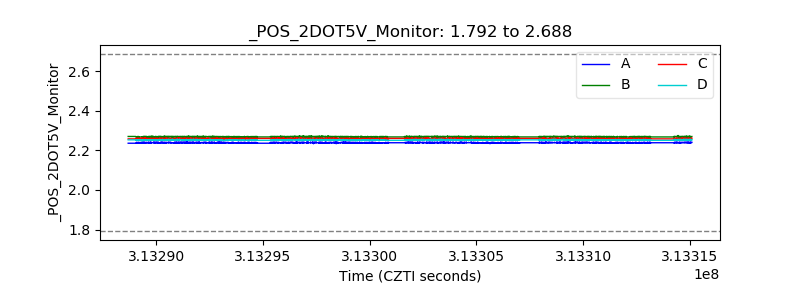 |
| +5 Volts monitor |  |
| _ROLL_ROT | 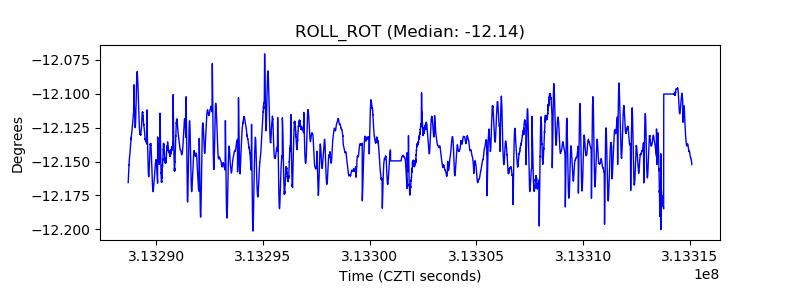 |
| _Roll_DEC | 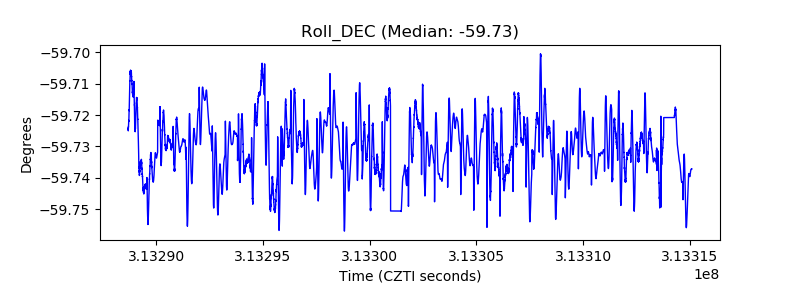 |
| _Roll_RA | 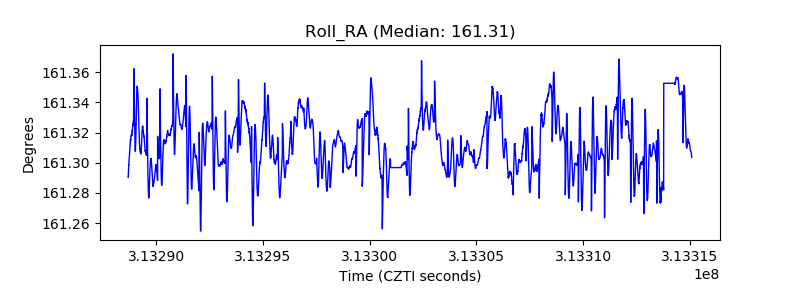 |
| Veto Counter | 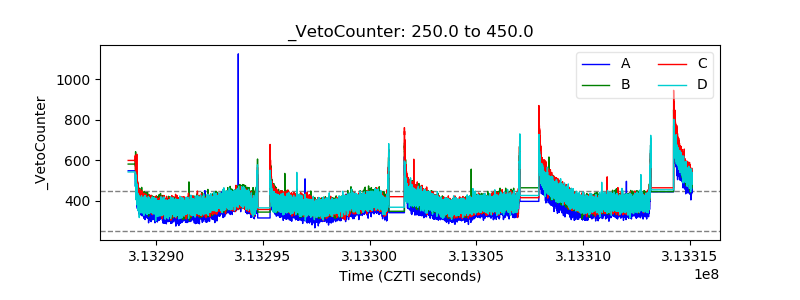 |