| Param | Original file | Final file |
|---|---|---|
| Filename | modeM0/AS1A08_007T01_9000003362_22652cztM0_level2.evt | modeM0/AS1A08_007T01_9000003362_22652cztM0_level2_quad_clean.evt |
| Size (bytes) | 535,435,200 | 98,064,000 |
| Size | 510.6 MB | 93.5 MB |
| Events in quadrant A | 3,630,478 | 649,761 |
| Events in quadrant B | 3,845,294 | 655,661 |
| Events in quadrant C | 3,614,114 | 611,492 |
| Events in quadrant D | 4,684,028 | 598,270 |
| Mode SS | |||
|---|---|---|---|
| Quadrant | BADHDUFLAG | Total packets | Discarded packets |
| A | 0 | 132 | 0 |
| B | 0 | 132 | 0 |
| C | 0 | 132 | 0 |
| D | 0 | 132 | 0 |
| Mode M0 | |||
|---|---|---|---|
| Quadrant | BADHDUFLAG | Total packets | Discarded packets |
| A | 0 | 14932 | 2 |
| B | 0 | 15724 | 2 |
| C | 0 | 14833 | 2 |
| D | 0 | 18471 | 3 |
| Mode M9 | |||
|---|---|---|---|
| Quadrant | BADHDUFLAG | Total packets | Discarded packets |
| A | 0 | 13 | 0 |
| B | 0 | 14 | 0 |
| C | 0 | 14 | 0 |
| D | 0 | 14 | 0 |
| Quadrant | Total seconds | Saturated seconds | Saturation percentage |
|---|---|---|---|
| A | 6518 | 121 | 1.856398% |
| B | 6518 | 117 | 1.795029% |
| C | 6518 | 171 | 2.623504% |
| D | 6517 | 233 | 3.575265% |
Noise dominated data is calculated using 1-second bins in cleaned event files. If a bin has >2000 counts, and if more than 50% of those come from <1% of pixels, then it is considered to be noise-dominated and hence unusable.
| Quadrant | # 1 sec bins | Bins with >0 counts | Bins with >2000 counts | High rate bins dominated by noise | Noise dominated (total time) | Noise dominated (detector-on time) | Marked lightcurve |
|---|---|---|---|---|---|---|---|
| A | 7828 | 6519 | 0 | 0 | 0.00% | 0.00% | 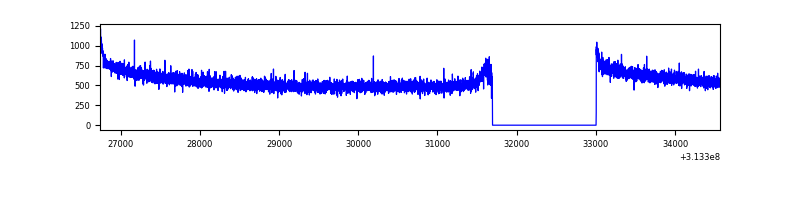 |
| B | 7828 | 6519 | 0 | 0 | 0.00% | 0.00% | 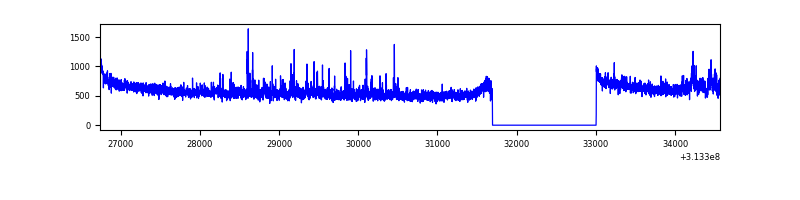 |
| C | 7828 | 6519 | 0 | 0 | 0.00% | 0.00% | 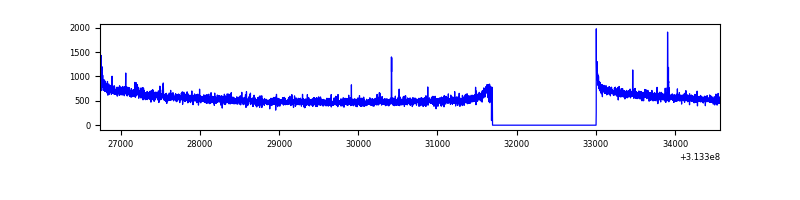 |
| D | 7827 | 6518 | 101 | 101 | 1.29% | 1.55% | 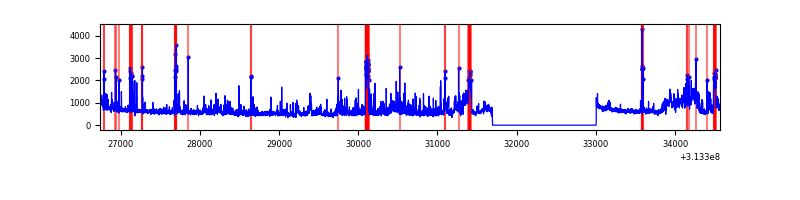 |
Top three noisy pixels from each quadrant. If the there are fewer than three noisy pixels in the level2.evt file, extra rows are filled as -1
| Pixel properties | Quadrant properties | ||||||
|---|---|---|---|---|---|---|---|
| Quadrant | DetID | PixID | Counts | Sigma | Mean | Median | Sigma |
| A | 13 | 254 | 12309 | 61.76 | 939 | 923 | 184.3 |
| A | 3 | 1 | 10955 | 54.42 | 939 | 923 | 184.3 |
| A | 0 | 226 | 8407 | 40.6 | 939 | 923 | 184.3 |
| B | 0 | 219 | 80902 | 476.18 | 921 | 903 | 168.0 |
| B | 0 | 229 | 79454 | 467.56 | 921 | 903 | 168.0 |
| B | 0 | 228 | 42172 | 245.65 | 921 | 903 | 168.0 |
| C | 14 | 238 | 145463 | 725.43 | 878 | 886 | 199.3 |
| C | 10 | 22 | 19705 | 94.43 | 878 | 886 | 199.3 |
| C | 0 | 10 | 15919 | 75.43 | 878 | 886 | 199.3 |
| D | 7 | 238 | 651349 | 2998.36 | 901 | 876 | 216.9 |
| D | 1 | 52 | 374907 | 1724.1 | 901 | 876 | 216.9 |
| D | 2 | 136 | 72710 | 331.12 | 901 | 876 | 216.9 |
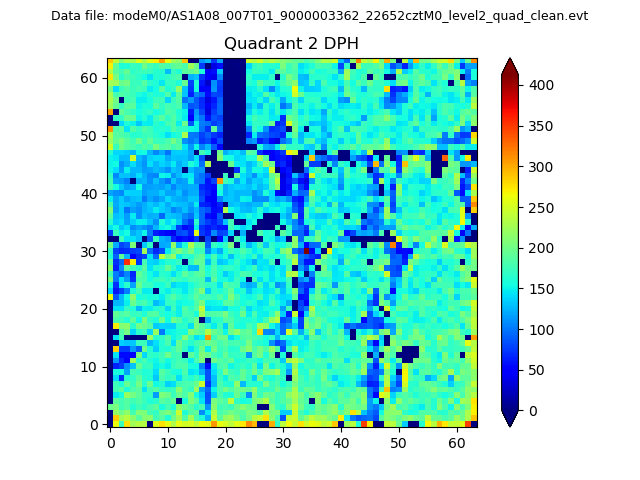
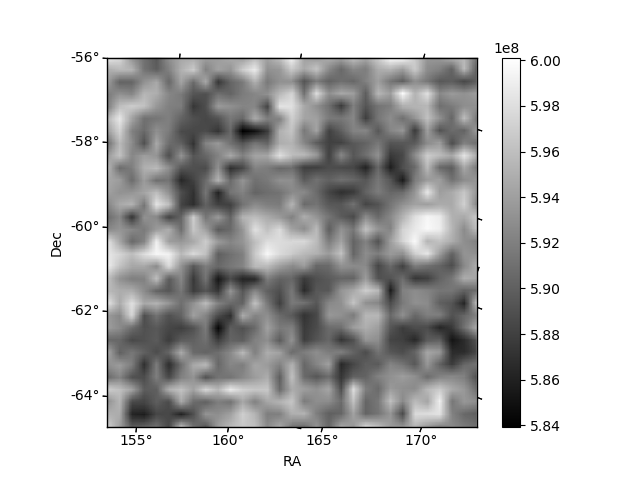
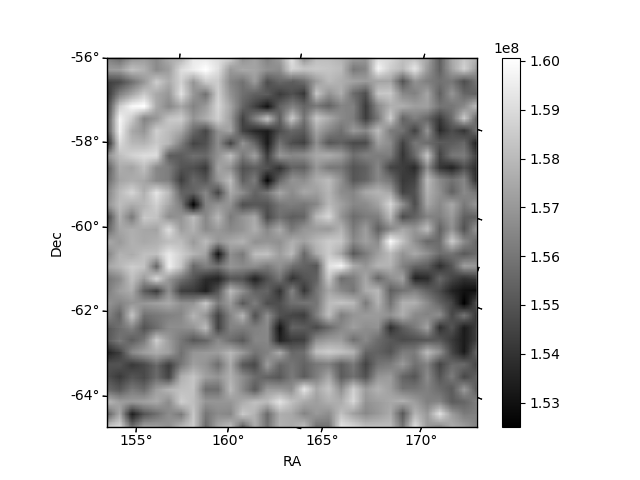
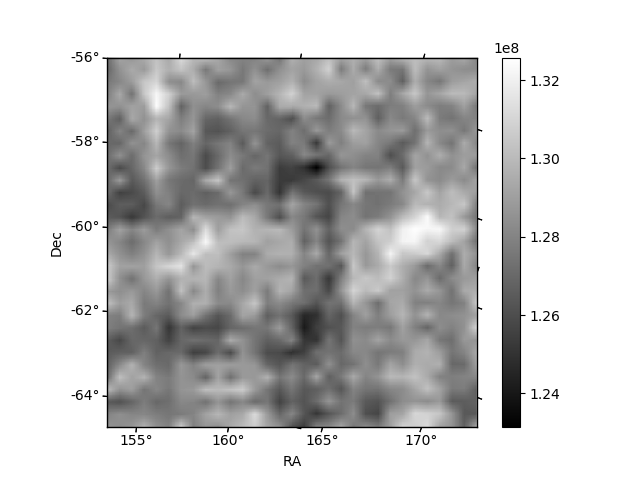
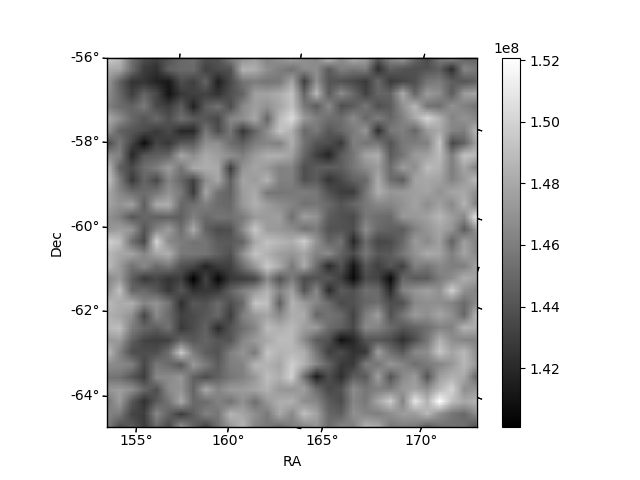
Histogram calculated using DETX and DETY for each event in the final _common_clean file
| Quadrant A | 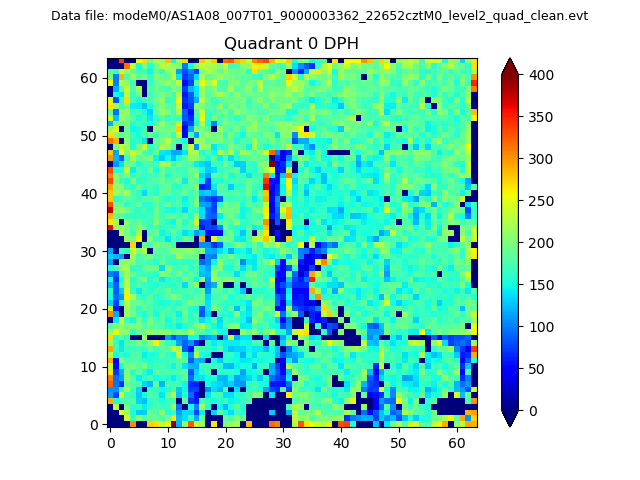 |
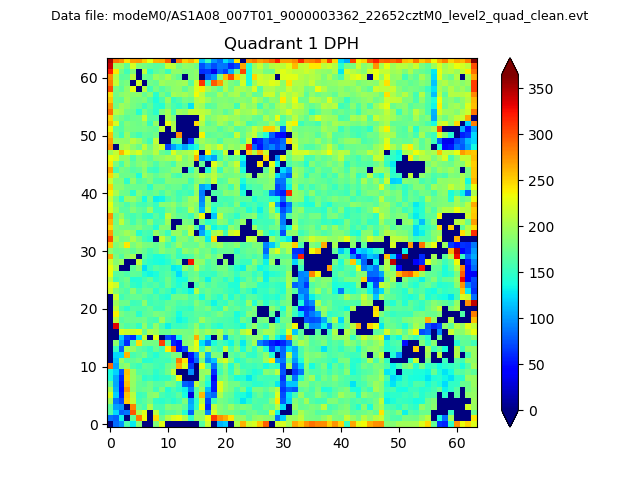 |
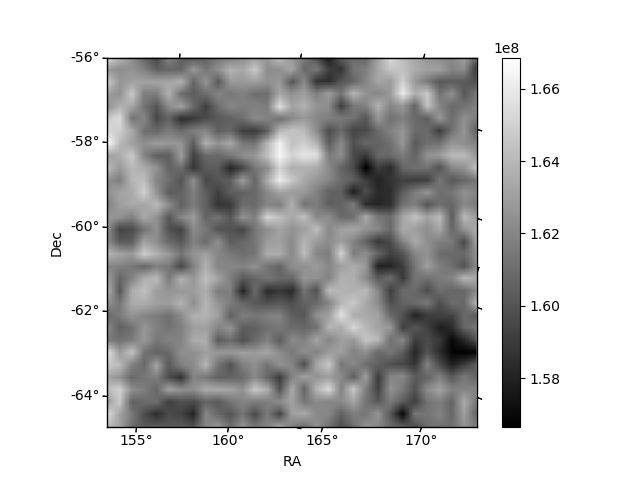
Quadrant B |
|---|---|---|---|
| Quadrant D | 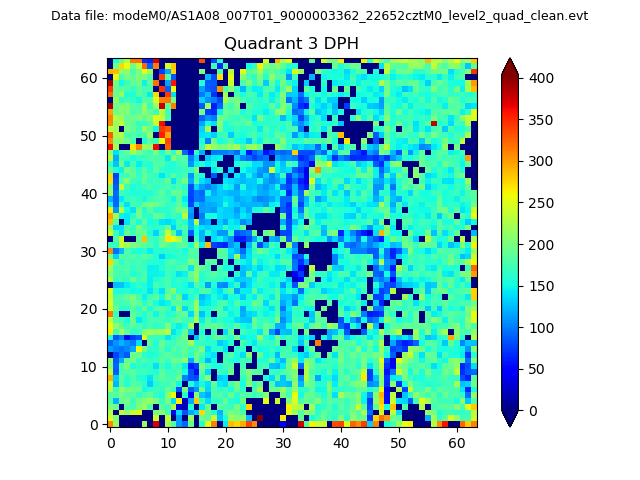 |
 |
Quadrant C |
| Plot type | Count rate plots | Images |
|---|---|---|
| Comparison with Poisson distribution Blue bars denote a histogram of data divided into 1 sec bins. Red curve is a Poisson curve with rate = median count rate of data. |
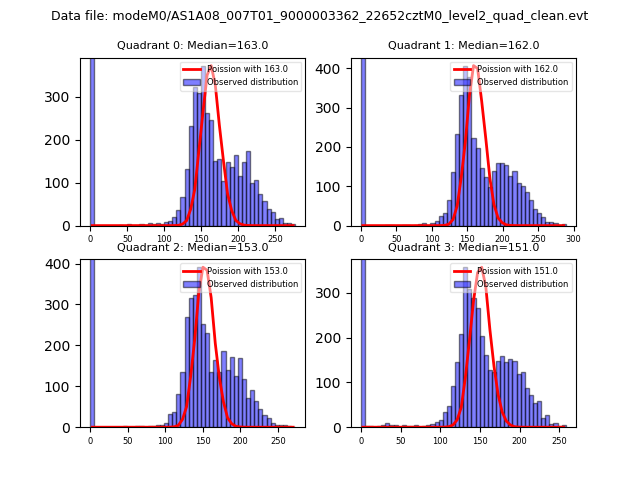 |
 |
| Quadrant-wise count rates Data is divided into 100 sec bins |
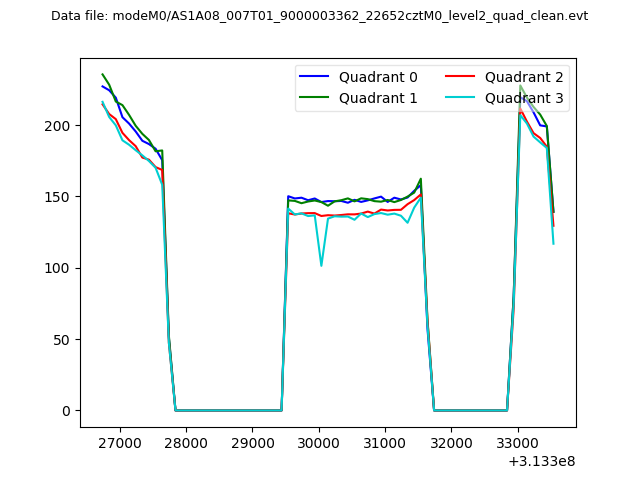 |
|
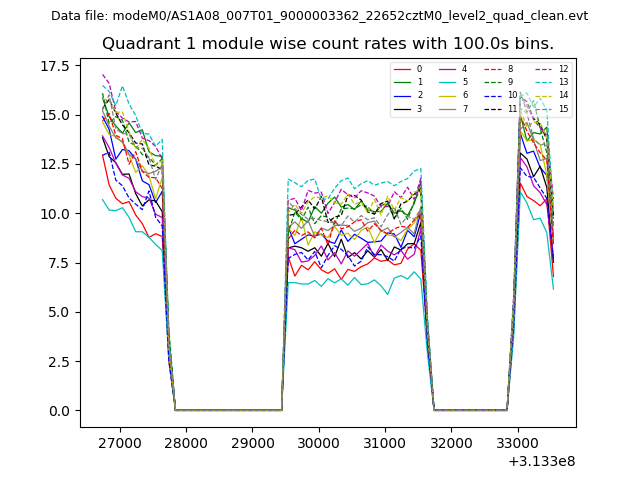
| Module-wise count rates for Quadrant A Data is divided into 100 sec bins |
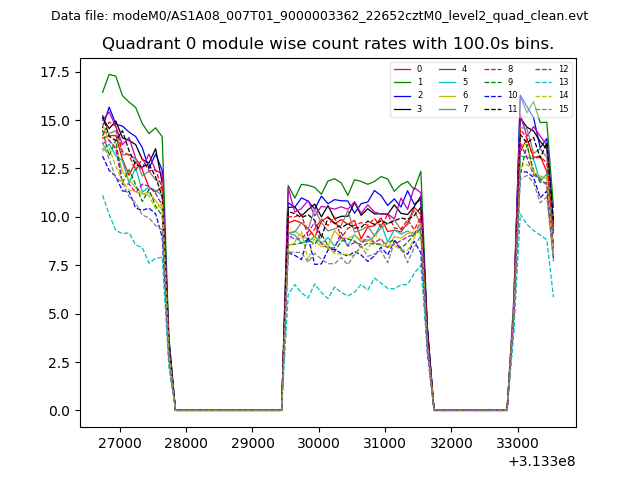 |
 |
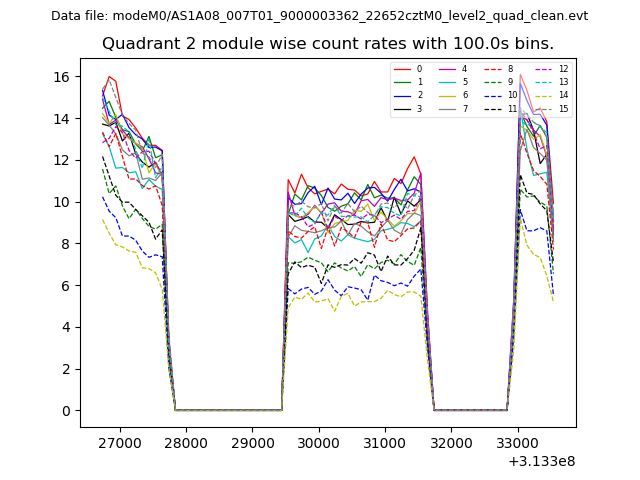
| Module-wise count rates for Quadrant B Data is divided into 100 sec bins |
 |
 |
| Module-wise count rates for Quadrant C Data is divided into 100 sec bins |
 |
 |
| Module-wise count rates for Quadrant D Data is divided into 100 sec bins |
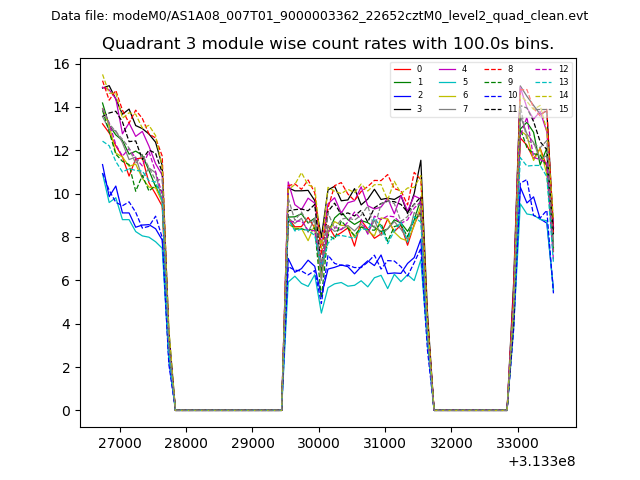 |
 |
| Parameter | Plot |
|---|---|
| CZT HV Monitor | 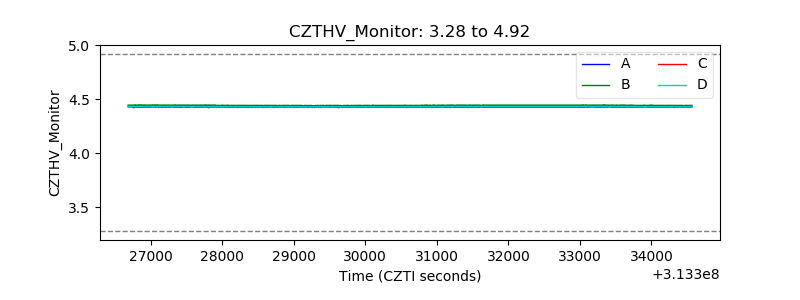 |
| D_VDD |  |
| Temperature 1 | 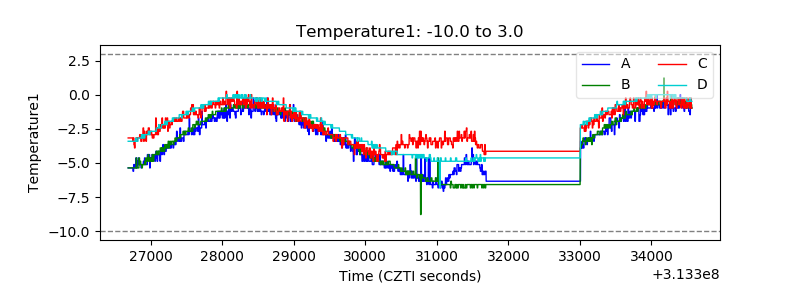 |
| Veto HV Monitor | 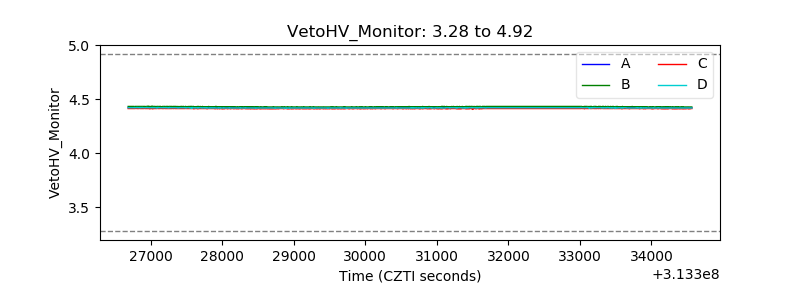 |
| Veto LLD | 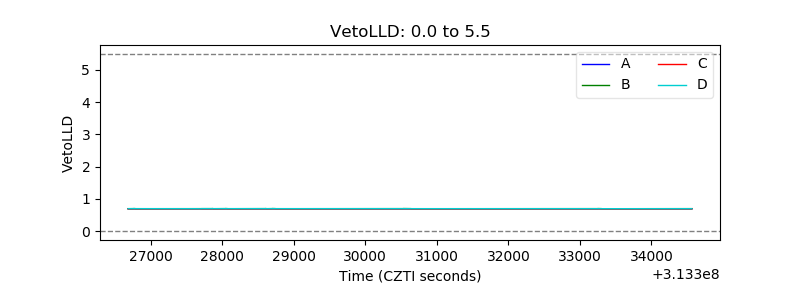 |
| Alpha Counter | 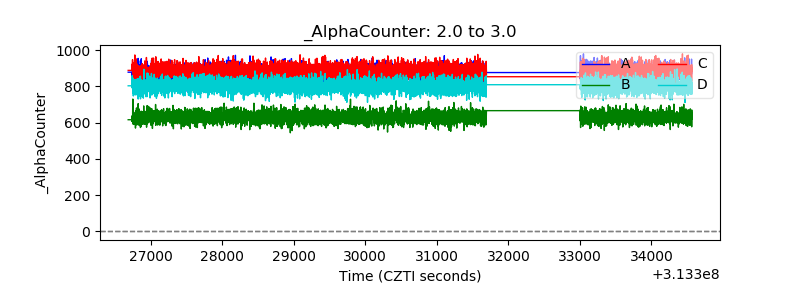 |
| _CPM_Rate | 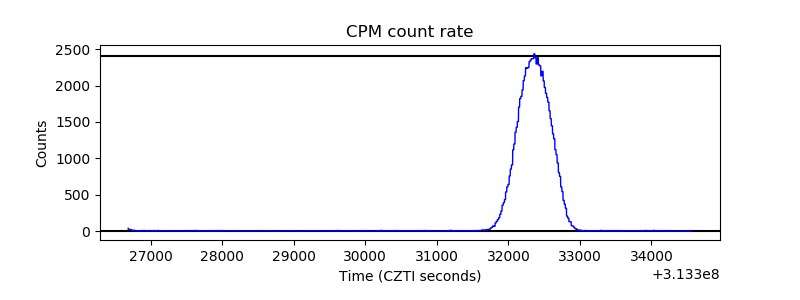 |
| CZT Counter | 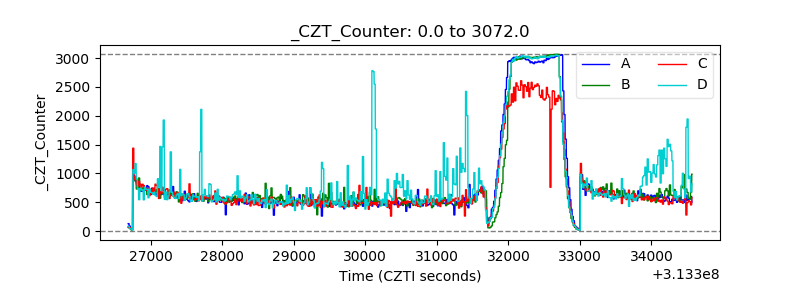 |
| +2.5 Volts monitor |  |
| +5 Volts monitor |  |
| _ROLL_ROT | 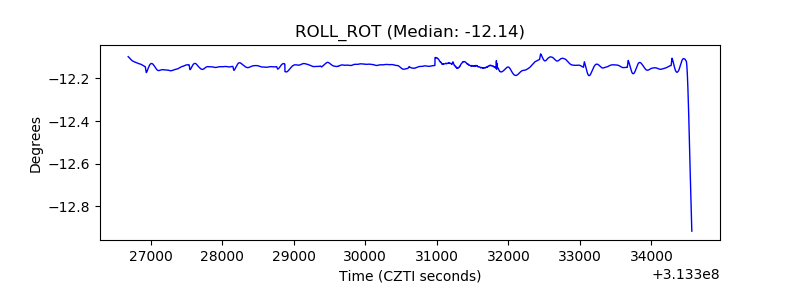 |
| _Roll_DEC | 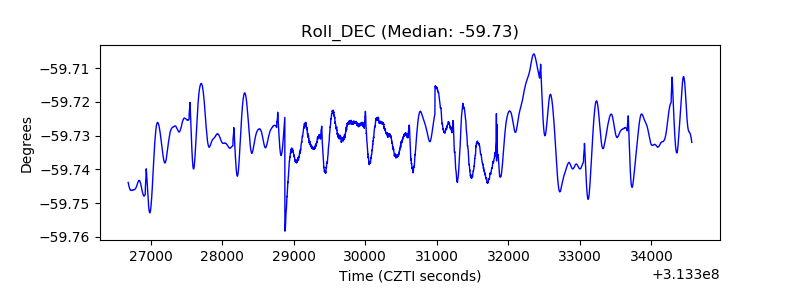 |
| _Roll_RA | 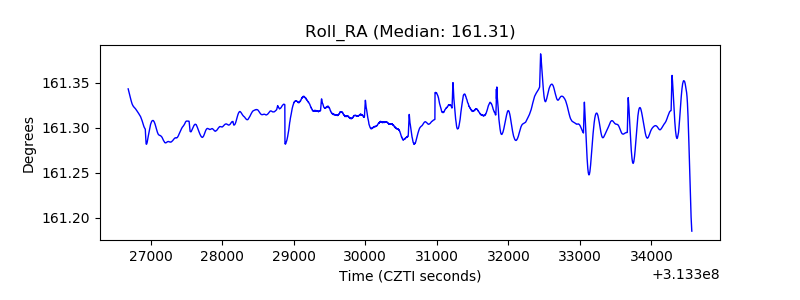 |
| Veto Counter | 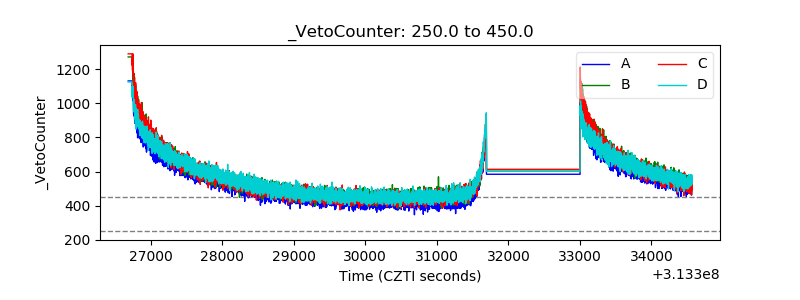 |