| Param | Original file | Final file |
|---|---|---|
| Filename | modeM0/AS1A08_007T01_9000003362_22656cztM0_level2.evt | modeM0/AS1A08_007T01_9000003362_22656cztM0_level2_quad_clean.evt |
| Size (bytes) | 532,768,320 | 95,495,040 |
| Size | 508.1 MB | 91.1 MB |
| Events in quadrant A | 3,416,435 | 615,516 |
| Events in quadrant B | 3,745,507 | 618,900 |
| Events in quadrant C | 3,443,800 | 590,877 |
| Events in quadrant D | 5,048,379 | 573,254 |
| Mode SS | |||
|---|---|---|---|
| Quadrant | BADHDUFLAG | Total packets | Discarded packets |
| A | 0 | 142 | 0 |
| B | 0 | 142 | 0 |
| C | 0 | 142 | 0 |
| D | 0 | 142 | 0 |
| Mode M0 | |||
|---|---|---|---|
| Quadrant | BADHDUFLAG | Total packets | Discarded packets |
| A | 0 | 14736 | 2 |
| B | 0 | 15619 | 2 |
| C | 0 | 14735 | 2 |
| D | 0 | 19661 | 2 |
| Mode M9 | |||
|---|---|---|---|
| Quadrant | BADHDUFLAG | Total packets | Discarded packets |
| A | 0 | 14 | 0 |
| B | 0 | 15 | 0 |
| C | 0 | 15 | 0 |
| D | 0 | 15 | 0 |
| Quadrant | Total seconds | Saturated seconds | Saturation percentage |
|---|---|---|---|
| A | 7090 | 86 | 1.212976% |
| B | 7090 | 142 | 2.002821% |
| C | 7090 | 107 | 1.509168% |
| D | 7090 | 411 | 5.796897% |
Noise dominated data is calculated using 1-second bins in cleaned event files. If a bin has >2000 counts, and if more than 50% of those come from <1% of pixels, then it is considered to be noise-dominated and hence unusable.
| Quadrant | # 1 sec bins | Bins with >0 counts | Bins with >2000 counts | High rate bins dominated by noise | Noise dominated (total time) | Noise dominated (detector-on time) | Marked lightcurve |
|---|---|---|---|---|---|---|---|
| A | 7670 | 7091 | 0 | 0 | 0.00% | 0.00% | 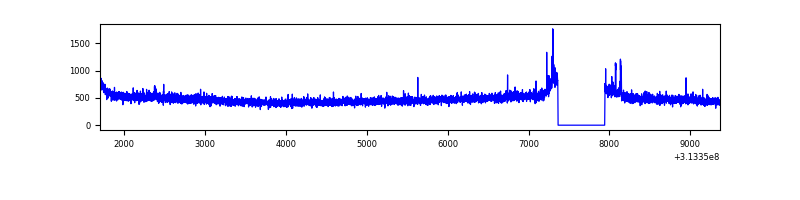 |
| B | 7670 | 7091 | 28 | 28 | 0.37% | 0.39% |  |
| C | 7670 | 7091 | 5 | 5 | 0.07% | 0.07% | 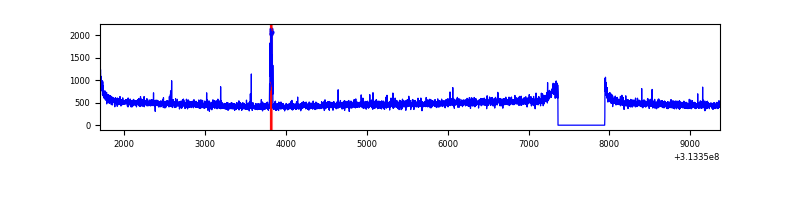 |
| D | 7670 | 7091 | 353 | 353 | 4.60% | 4.98% | 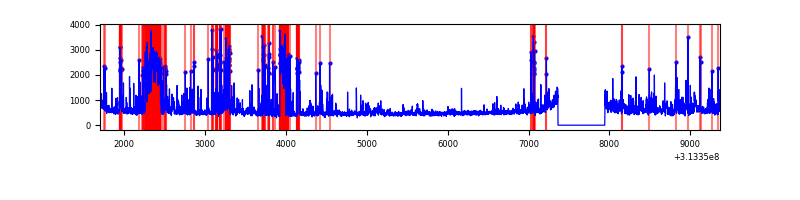 |
Top three noisy pixels from each quadrant. If the there are fewer than three noisy pixels in the level2.evt file, extra rows are filled as -1
| Pixel properties | Quadrant properties | ||||||
|---|---|---|---|---|---|---|---|
| Quadrant | DetID | PixID | Counts | Sigma | Mean | Median | Sigma |
| A | 3 | 1 | 25748 | 141.36 | 874 | 853 | 176.1 |
| A | 4 | 2 | 16773 | 90.39 | 874 | 853 | 176.1 |
| A | 13 | 254 | 13293 | 70.63 | 874 | 853 | 176.1 |
| B | 0 | 229 | 103304 | 625.11 | 870 | 847 | 163.9 |
| B | 7 | 219 | 62006 | 373.14 | 870 | 847 | 163.9 |
| B | 0 | 230 | 55457 | 333.19 | 870 | 847 | 163.9 |
| C | 14 | 238 | 131199 | 671.6 | 833 | 836 | 194.1 |
| C | 10 | 22 | 41295 | 208.44 | 833 | 836 | 194.1 |
| C | 0 | 10 | 15298 | 74.51 | 833 | 836 | 194.1 |
| D | 1 | 52 | 1146741 | 5672.05 | 832 | 808 | 202.0 |
| D | 12 | 233 | 449409 | 2220.45 | 832 | 808 | 202.0 |
| D | 2 | 136 | 95279 | 467.6 | 832 | 808 | 202.0 |
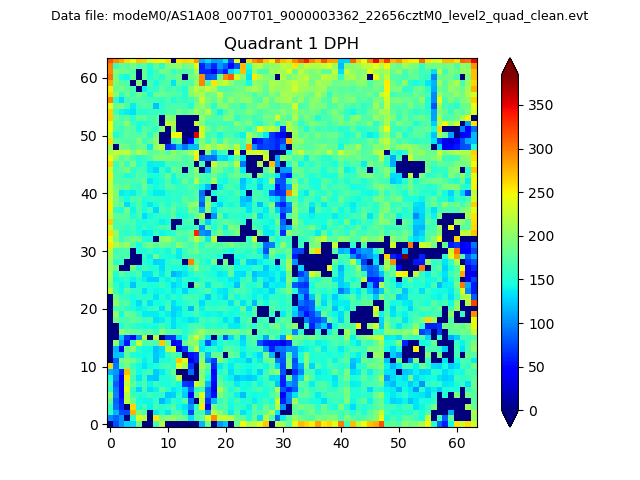
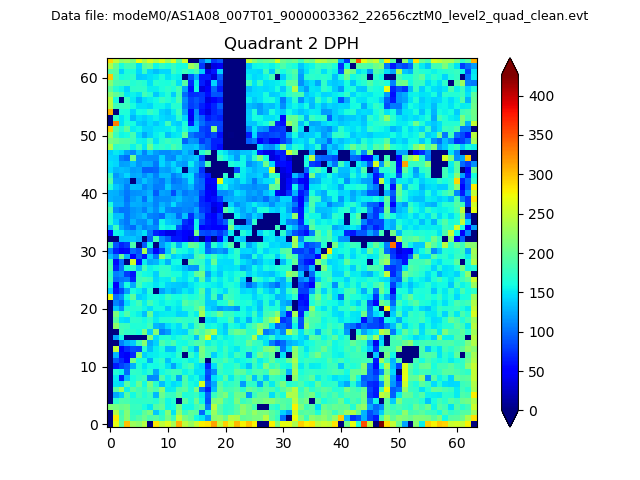
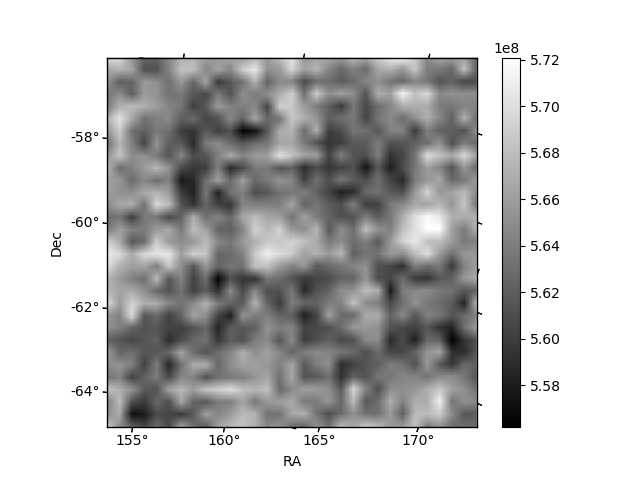
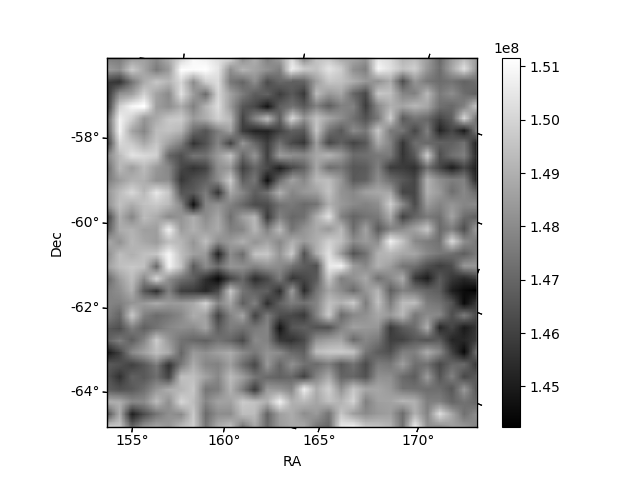
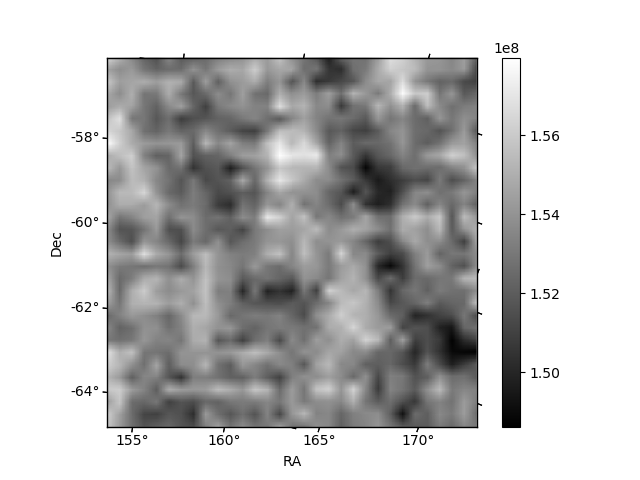
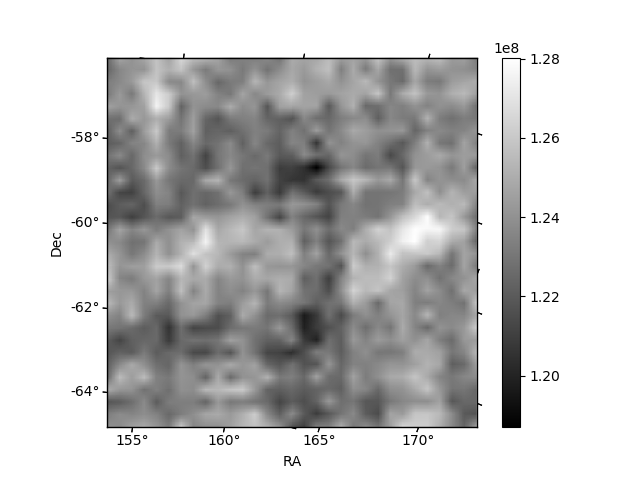
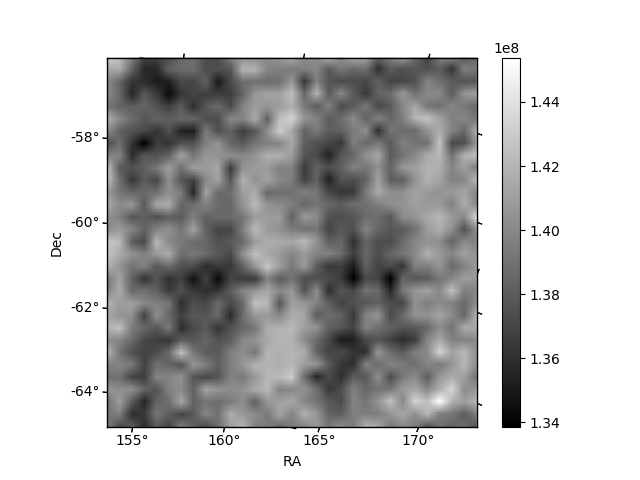
Histogram calculated using DETX and DETY for each event in the final _common_clean file
| Quadrant A | 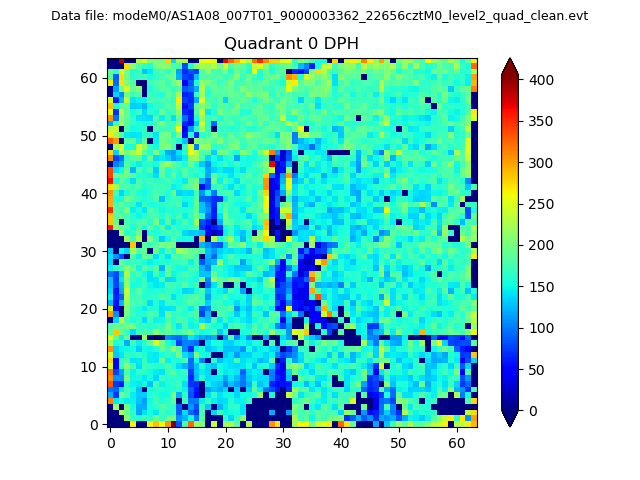 |
 |
Quadrant B |
|---|---|---|---|
| Quadrant D | 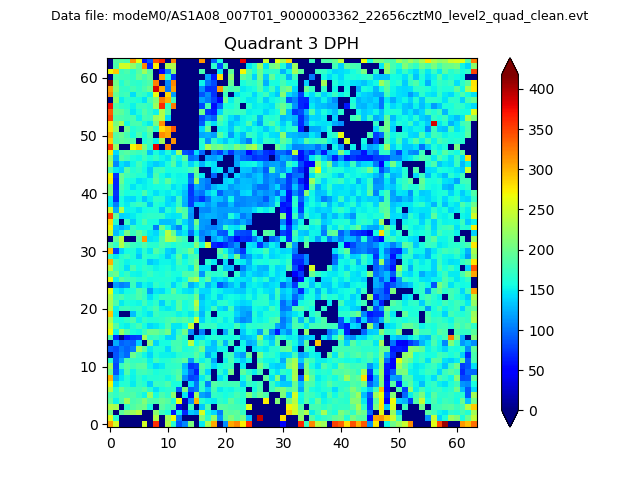 |
 |
Quadrant C |
| Plot type | Count rate plots | Images |
|---|---|---|
| Comparison with Poisson distribution Blue bars denote a histogram of data divided into 1 sec bins. Red curve is a Poisson curve with rate = median count rate of data. |
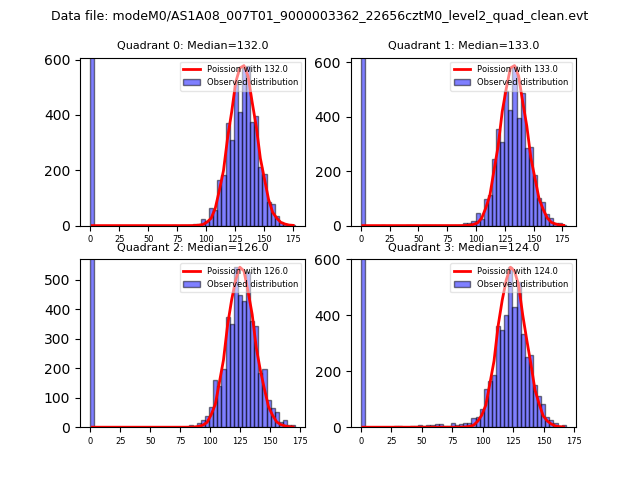 |
 |
| Quadrant-wise count rates Data is divided into 100 sec bins |
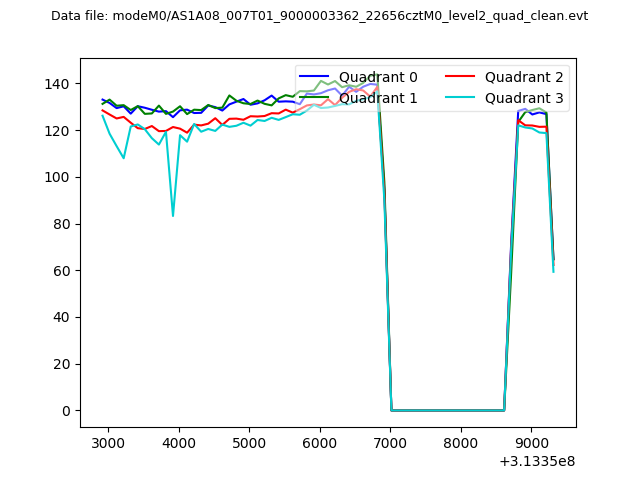 |
|
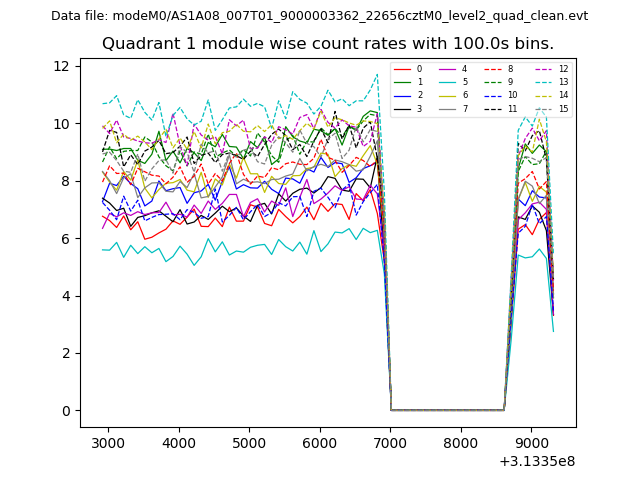
| Module-wise count rates for Quadrant A Data is divided into 100 sec bins |
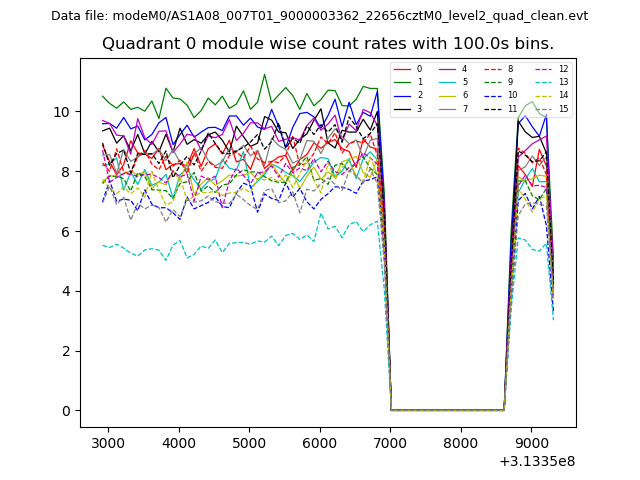 |
 |
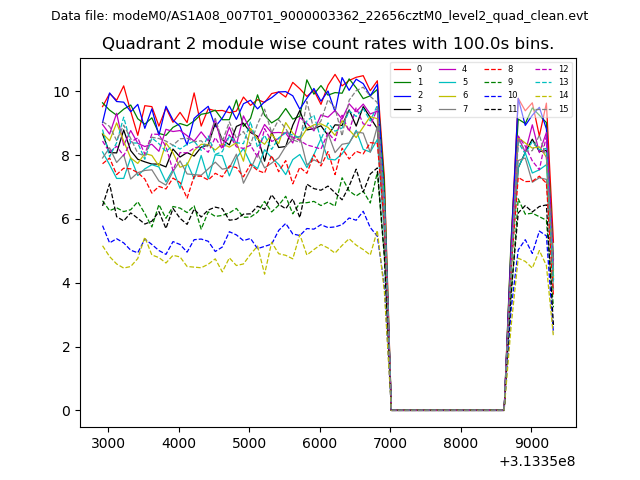
| Module-wise count rates for Quadrant B Data is divided into 100 sec bins |
 |
 |
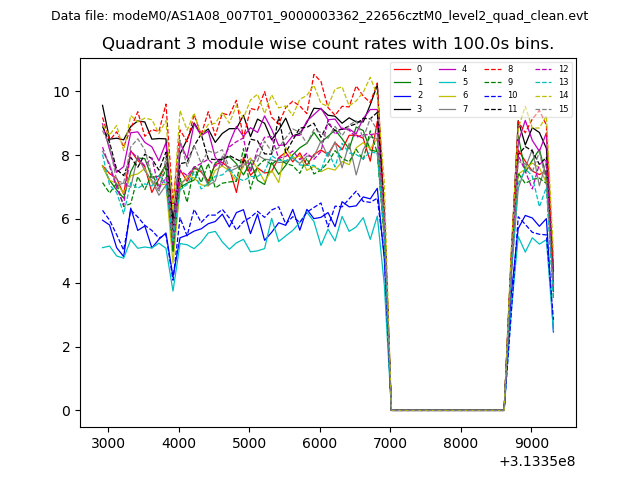
| Module-wise count rates for Quadrant C Data is divided into 100 sec bins |
 |
 |
| Module-wise count rates for Quadrant D Data is divided into 100 sec bins |
 |
 |
| Parameter | Plot |
|---|---|
| CZT HV Monitor | 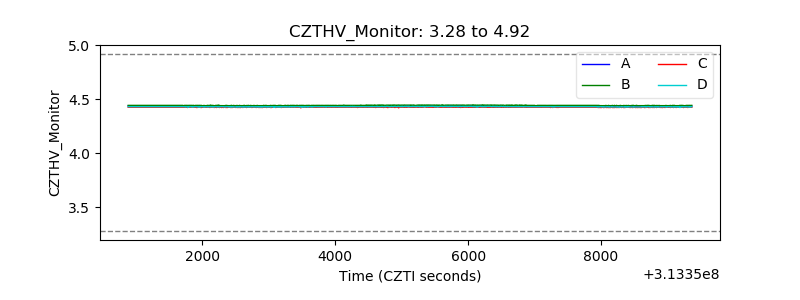 |
| D_VDD | 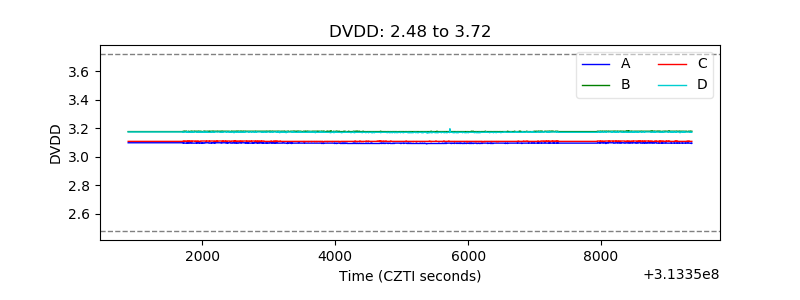 |
| Temperature 1 | 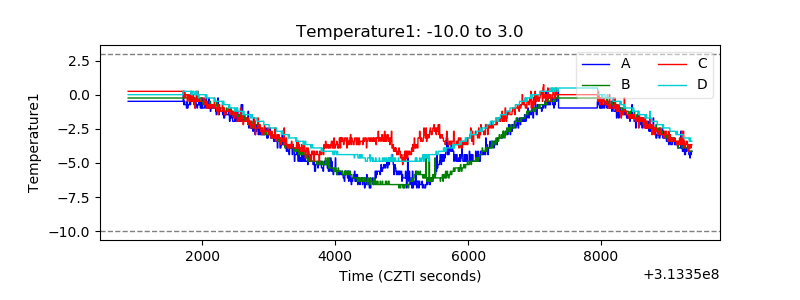 |
| Veto HV Monitor |  |
| Veto LLD | 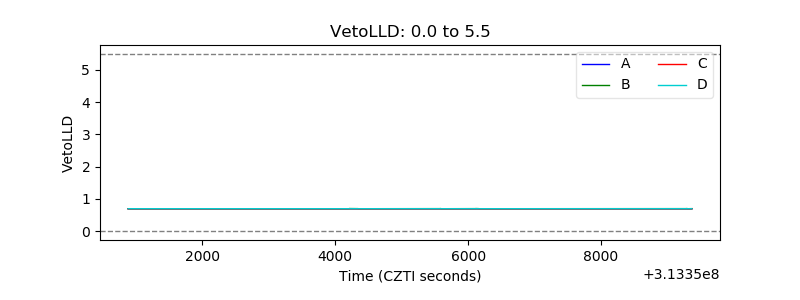 |
| Alpha Counter | 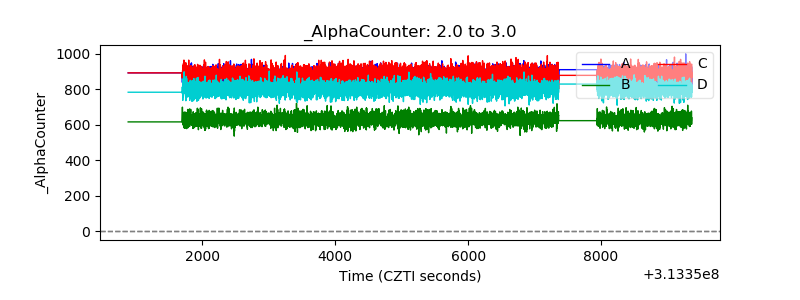 |
| _CPM_Rate | 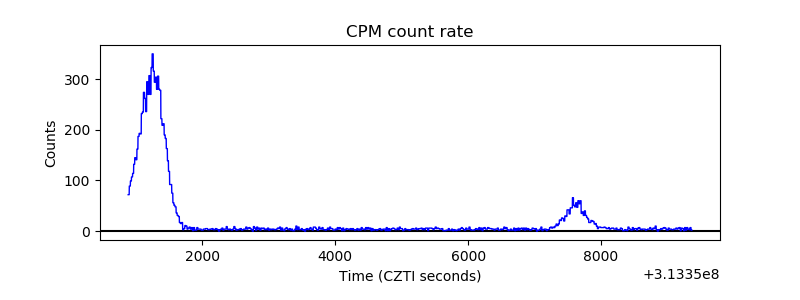 |
| CZT Counter | 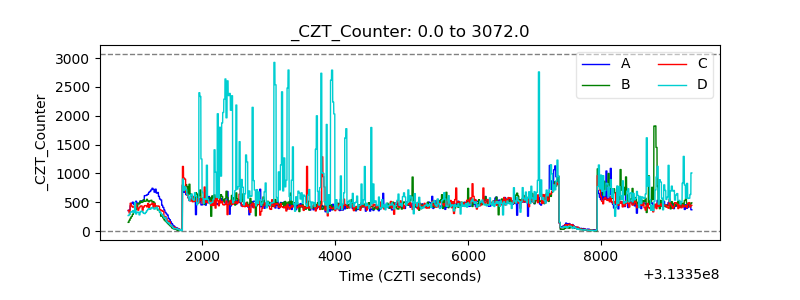 |
| +2.5 Volts monitor |  |
| +5 Volts monitor | 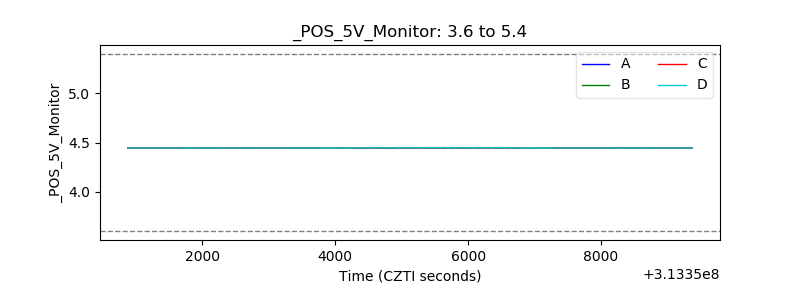 |
| _ROLL_ROT | 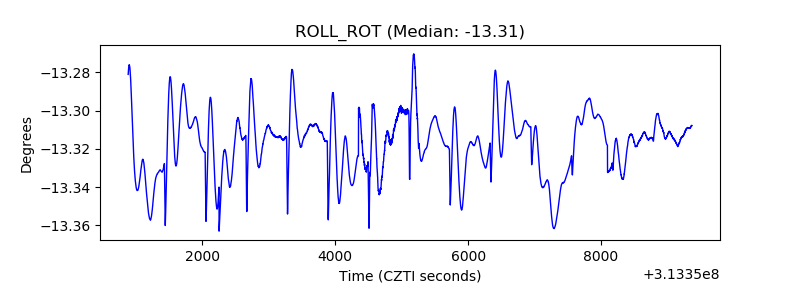 |
| _Roll_DEC |  |
| _Roll_RA | 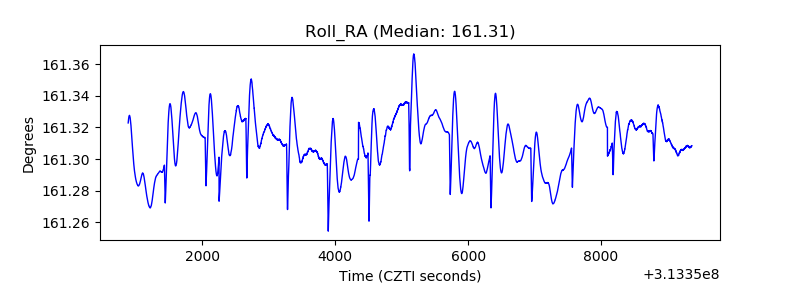 |
| Veto Counter | 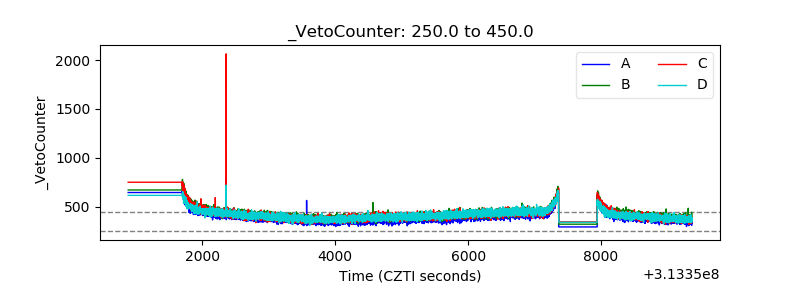 |