| Param | Original file | Final file |
|---|---|---|
| Filename | modeM0/AS1A08_007T01_9000003362_22657cztM0_level2.evt | modeM0/AS1A08_007T01_9000003362_22657cztM0_level2_quad_clean.evt |
| Size (bytes) | 556,902,720 | 100,699,200 |
| Size | 531.1 MB | 96.0 MB |
| Events in quadrant A | 3,722,199 | 644,238 |
| Events in quadrant B | 4,193,869 | 642,113 |
| Events in quadrant C | 3,752,436 | 617,621 |
| Events in quadrant D | 4,672,022 | 607,304 |
| Mode SS | |||
|---|---|---|---|
| Quadrant | BADHDUFLAG | Total packets | Discarded packets |
| A | 0 | 156 | 0 |
| B | 0 | 156 | 0 |
| C | 0 | 156 | 0 |
| D | 0 | 156 | 0 |
| Mode M0 | |||
|---|---|---|---|
| Quadrant | BADHDUFLAG | Total packets | Discarded packets |
| A | 0 | 16176 | 2 |
| B | 0 | 17366 | 2 |
| C | 0 | 16153 | 2 |
| D | 0 | 19111 | 2 |
| Mode M9 | |||
|---|---|---|---|
| Quadrant | BADHDUFLAG | Total packets | Discarded packets |
| A | 0 | 8 | 0 |
| B | 0 | 8 | 0 |
| C | 0 | 8 | 0 |
| D | 0 | 8 | 0 |
| Quadrant | Total seconds | Saturated seconds | Saturation percentage |
|---|---|---|---|
| A | 7745 | 100 | 1.291156% |
| B | 7746 | 208 | 2.685257% |
| C | 7746 | 127 | 1.639556% |
| D | 7746 | 161 | 2.078492% |
Noise dominated data is calculated using 1-second bins in cleaned event files. If a bin has >2000 counts, and if more than 50% of those come from <1% of pixels, then it is considered to be noise-dominated and hence unusable.
| Quadrant | # 1 sec bins | Bins with >0 counts | Bins with >2000 counts | High rate bins dominated by noise | Noise dominated (total time) | Noise dominated (detector-on time) | Marked lightcurve |
|---|---|---|---|---|---|---|---|
| A | 8560 | 7747 | 0 | 0 | 0.00% | 0.00% |  |
| B | 8561 | 7748 | 31 | 31 | 0.36% | 0.40% | 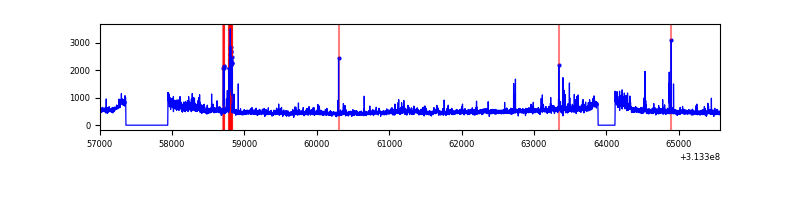 |
| C | 8561 | 7748 | 3 | 3 | 0.04% | 0.04% | 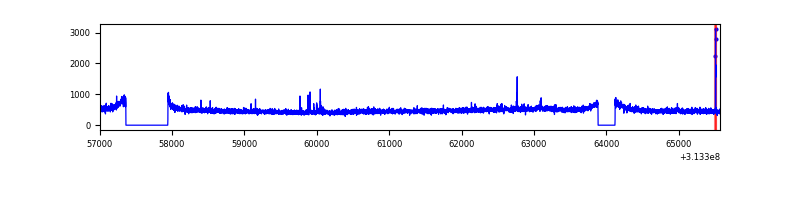 |
| D | 8561 | 7748 | 70 | 70 | 0.82% | 0.90% | 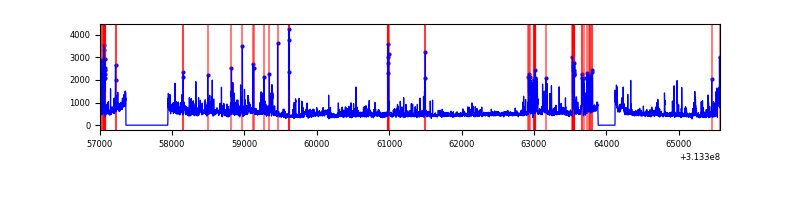 |
Top three noisy pixels from each quadrant. If the there are fewer than three noisy pixels in the level2.evt file, extra rows are filled as -1
| Pixel properties | Quadrant properties | ||||||
|---|---|---|---|---|---|---|---|
| Quadrant | DetID | PixID | Counts | Sigma | Mean | Median | Sigma |
| A | 3 | 1 | 23111 | 114.55 | 955 | 933 | 193.6 |
| A | 4 | 2 | 16695 | 81.41 | 955 | 933 | 193.6 |
| A | 13 | 254 | 14656 | 70.88 | 955 | 933 | 193.6 |
| B | 0 | 229 | 101422 | 554.18 | 950 | 925 | 181.3 |
| B | 0 | 230 | 98472 | 537.91 | 950 | 925 | 181.3 |
| B | 0 | 190 | 77553 | 422.55 | 950 | 925 | 181.3 |
| C | 14 | 238 | 142067 | 662.21 | 910 | 914 | 213.2 |
| C | 10 | 22 | 38584 | 176.73 | 910 | 914 | 213.2 |
| C | 10 | 23 | 10589 | 45.39 | 910 | 914 | 213.2 |
| D | 1 | 52 | 759956 | 3400.01 | 919 | 889 | 223.3 |
| D | 12 | 233 | 157269 | 700.46 | 919 | 889 | 223.3 |
| D | 2 | 136 | 74245 | 328.58 | 919 | 889 | 223.3 |
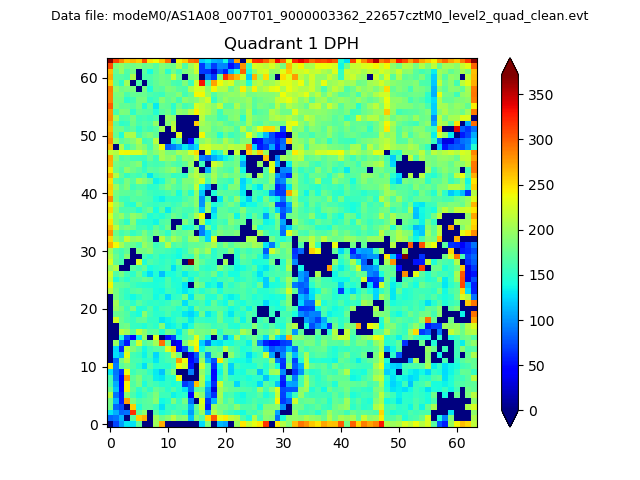
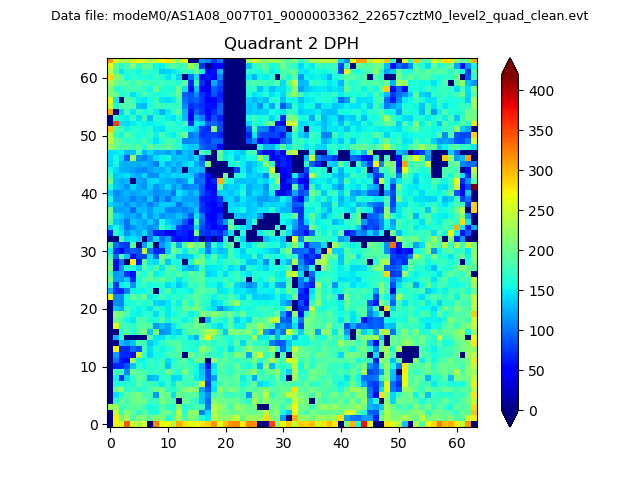
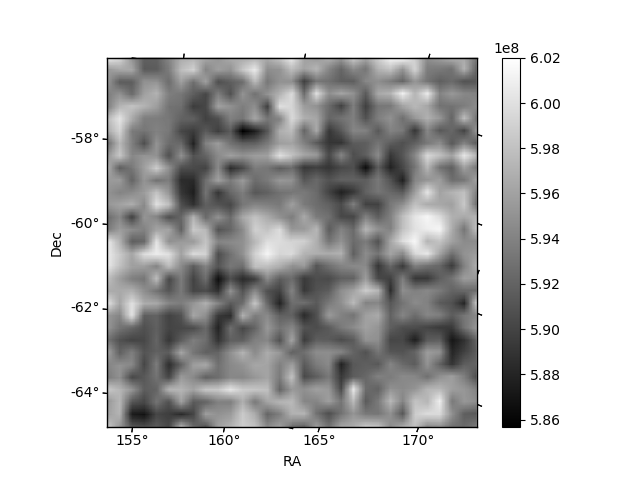
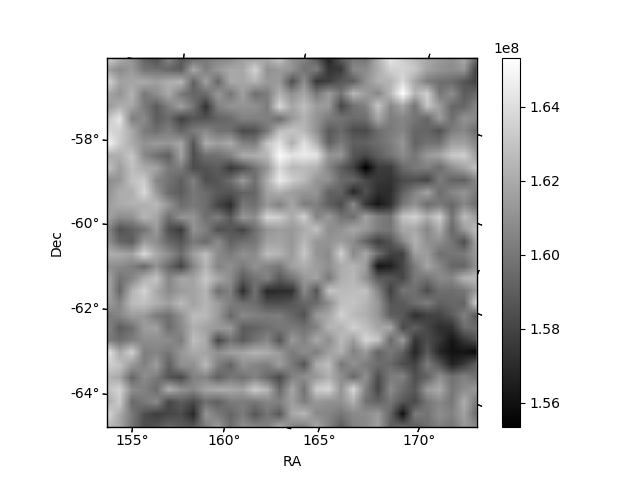
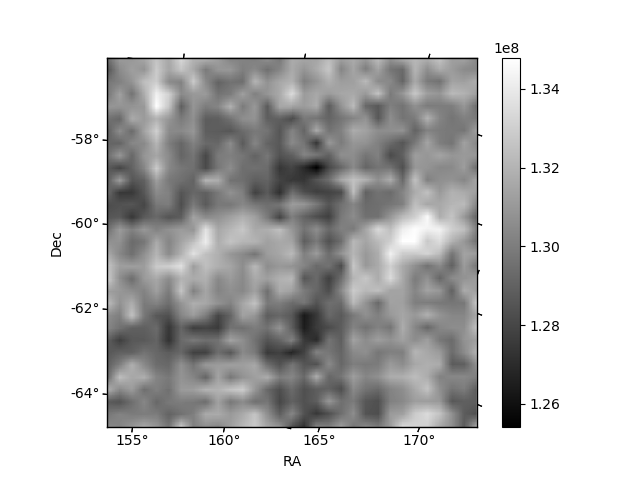
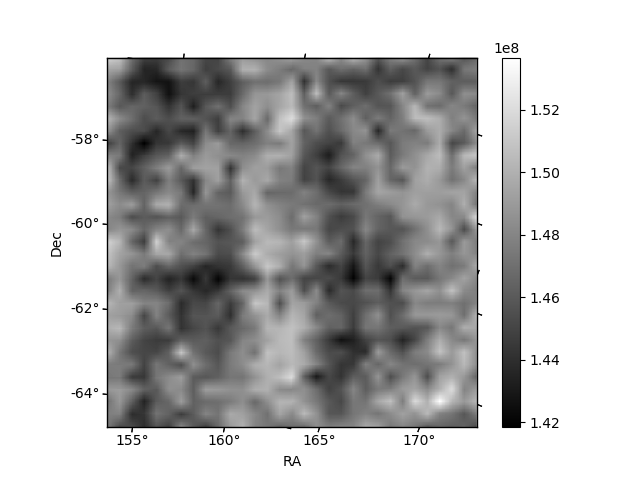
Histogram calculated using DETX and DETY for each event in the final _common_clean file
| Quadrant A | 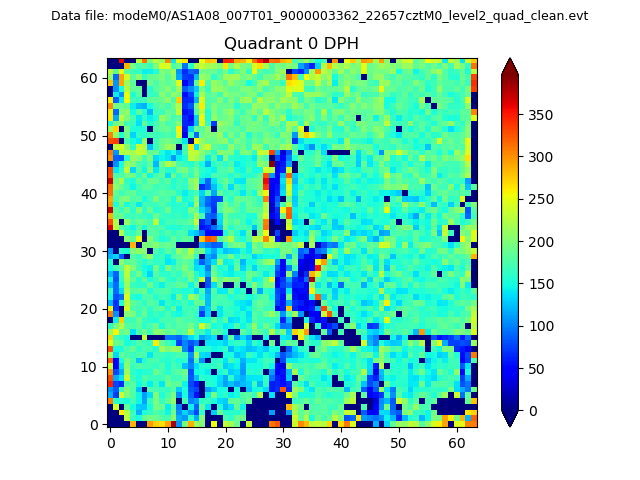 |
 |
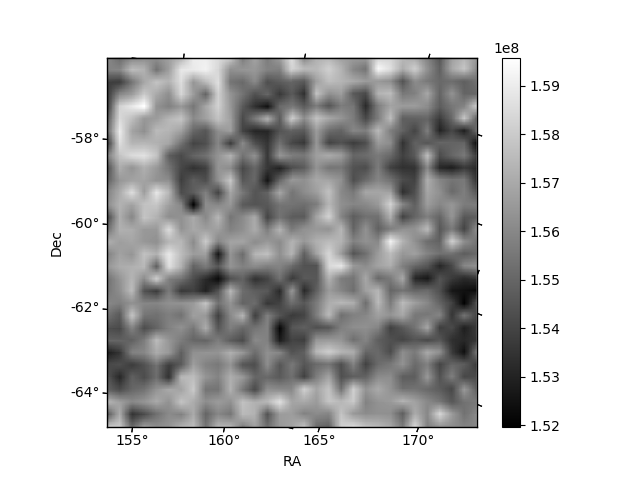
Quadrant B |
|---|---|---|---|
| Quadrant D | 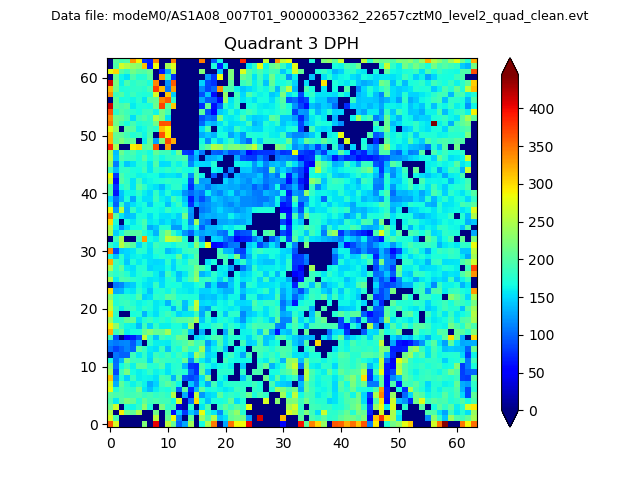 |
 |
Quadrant C |
| Plot type | Count rate plots | Images |
|---|---|---|
| Comparison with Poisson distribution Blue bars denote a histogram of data divided into 1 sec bins. Red curve is a Poisson curve with rate = median count rate of data. |
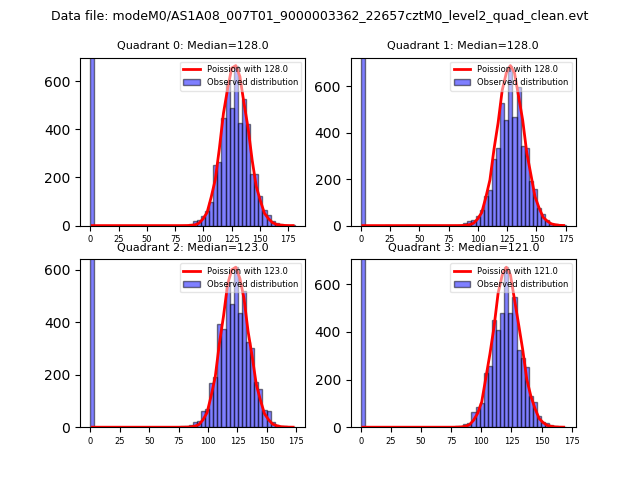 |
 |
| Quadrant-wise count rates Data is divided into 100 sec bins |
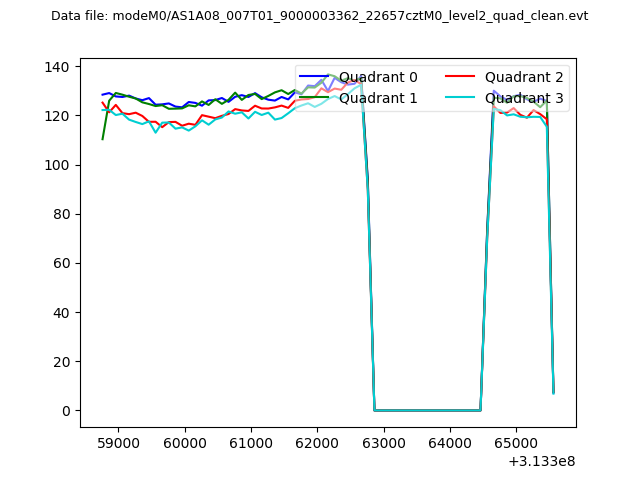 |
|
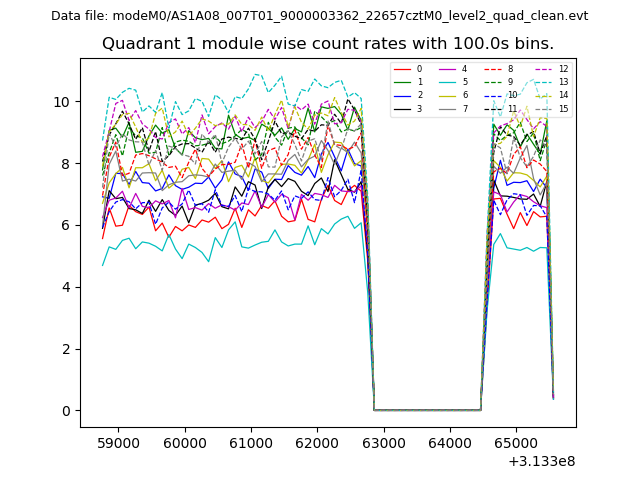
| Module-wise count rates for Quadrant A Data is divided into 100 sec bins |
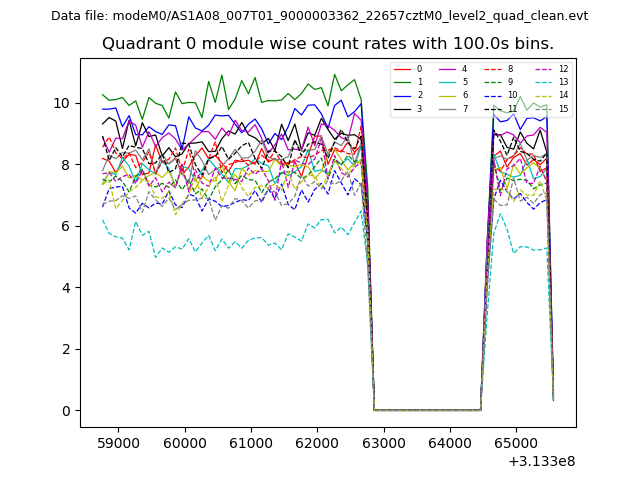 |
 |
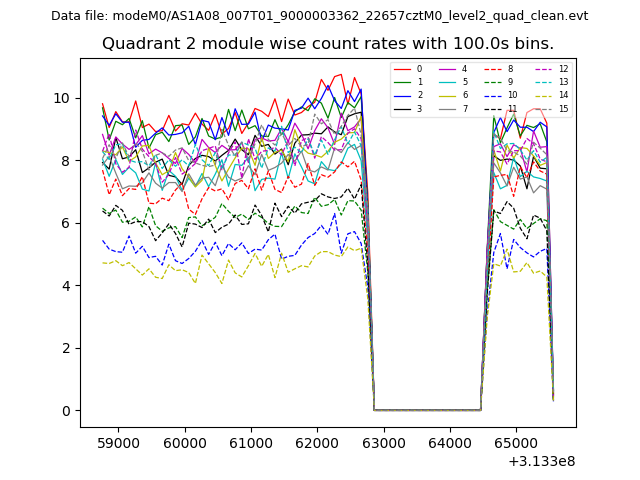
| Module-wise count rates for Quadrant B Data is divided into 100 sec bins |
 |
 |
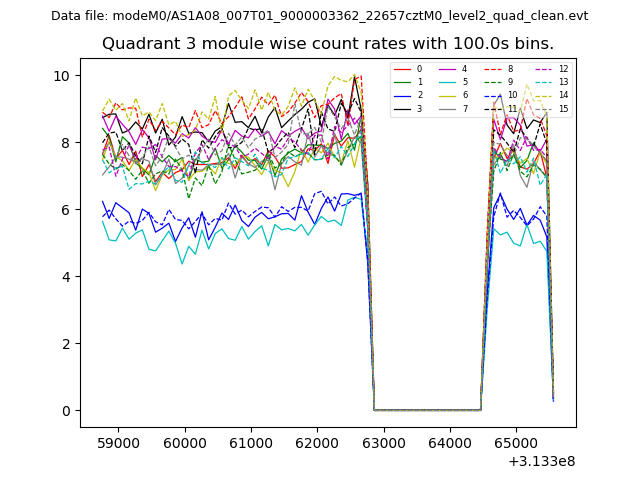
| Module-wise count rates for Quadrant C Data is divided into 100 sec bins |
 |
 |
| Module-wise count rates for Quadrant D Data is divided into 100 sec bins |
 |
 |
| Parameter | Plot |
|---|---|
| CZT HV Monitor | 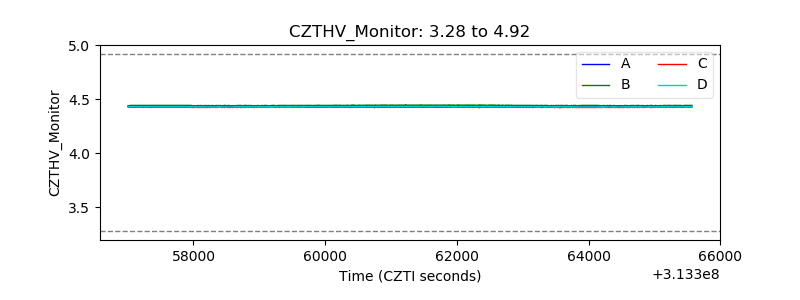 |
| D_VDD | 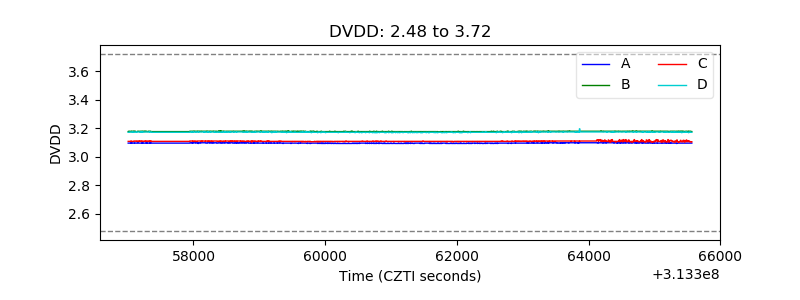 |
| Temperature 1 | 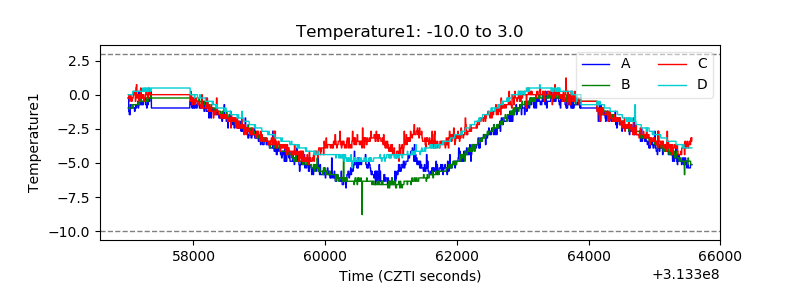 |
| Veto HV Monitor | 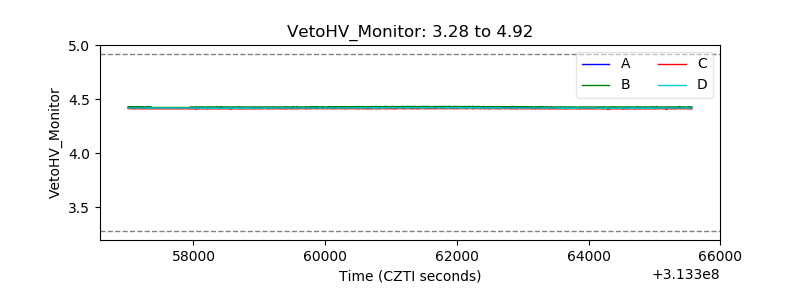 |
| Veto LLD | 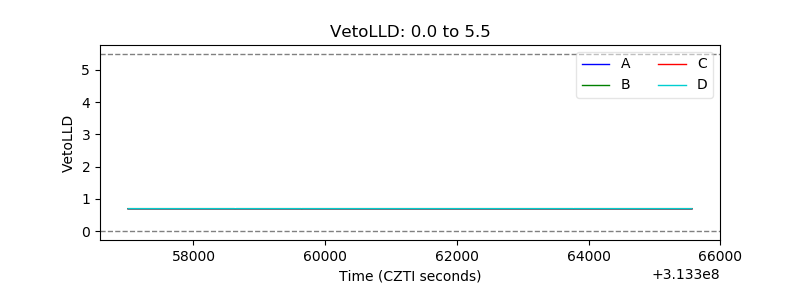 |
| Alpha Counter | 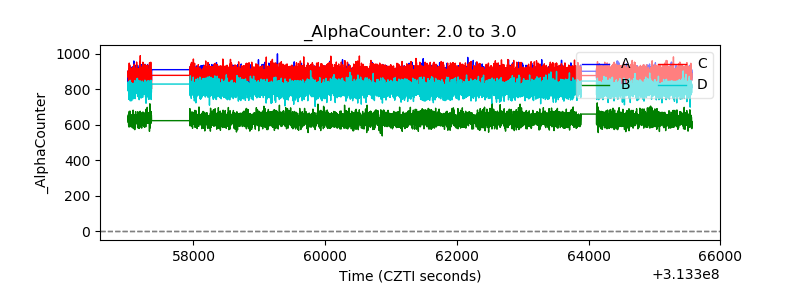 |
| _CPM_Rate | 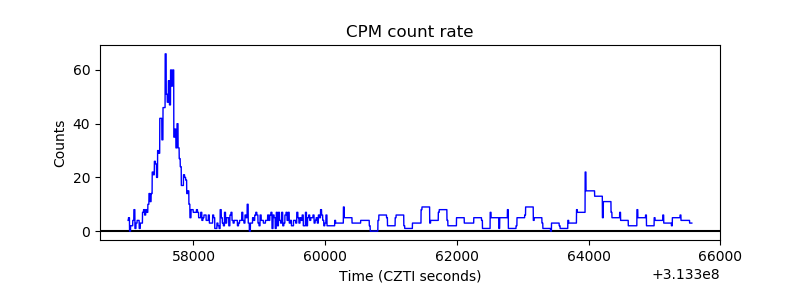 |
| CZT Counter | 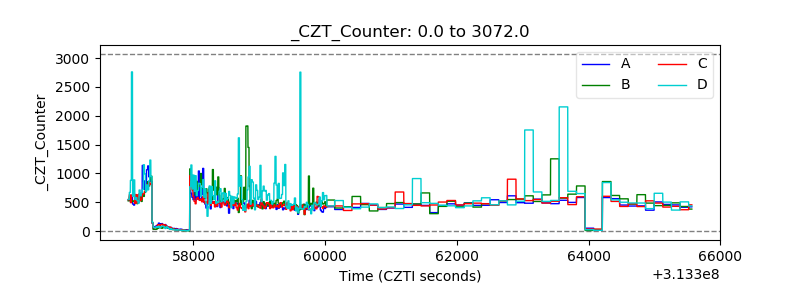 |
| +2.5 Volts monitor |  |
| +5 Volts monitor |  |
| _ROLL_ROT | 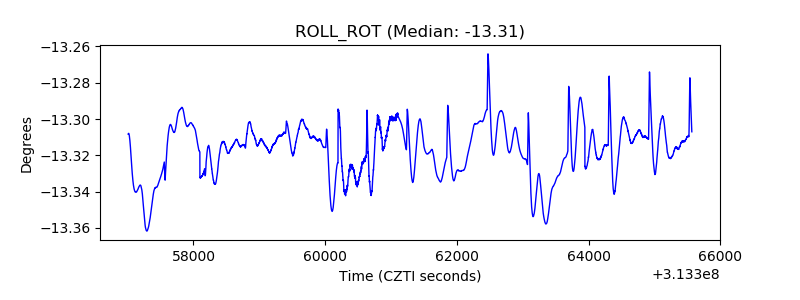 |
| _Roll_DEC | 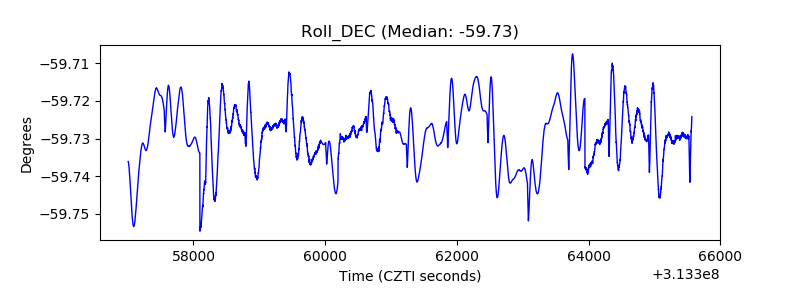 |
| _Roll_RA | 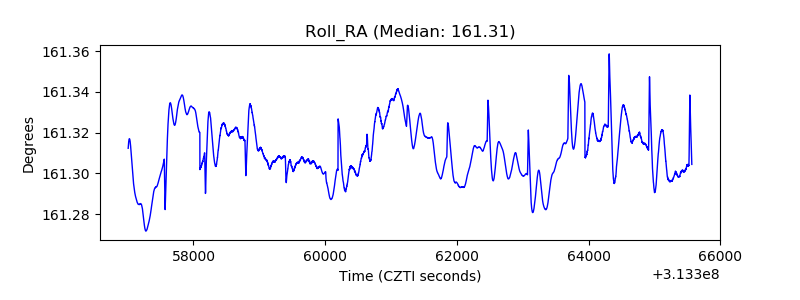 |
| Veto Counter | 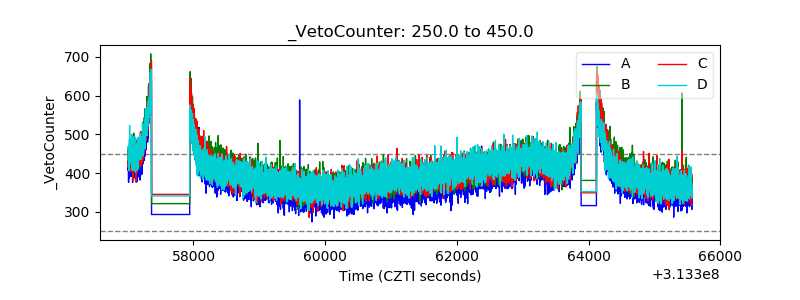 |