| Param | Original file | Final file |
|---|---|---|
| Filename | modeM0/AS1A08_007T01_9000003362_22658cztM0_level2.evt | modeM0/AS1A08_007T01_9000003362_22658cztM0_level2_quad_clean.evt |
| Size (bytes) | 596,779,200 | 110,232,000 |
| Size | 569.1 MB | 105.1 MB |
| Events in quadrant A | 3,913,371 | 710,438 |
| Events in quadrant B | 4,339,030 | 712,564 |
| Events in quadrant C | 3,941,052 | 682,931 |
| Events in quadrant D | 5,324,961 | 663,741 |
| Mode SS | |||
|---|---|---|---|
| Quadrant | BADHDUFLAG | Total packets | Discarded packets |
| A | 0 | 166 | 0 |
| B | 0 | 166 | 0 |
| C | 0 | 166 | 0 |
| D | 0 | 166 | 0 |
| Mode M0 | |||
|---|---|---|---|
| Quadrant | BADHDUFLAG | Total packets | Discarded packets |
| A | 0 | 17068 | 2 |
| B | 0 | 18292 | 2 |
| C | 0 | 16969 | 2 |
| D | 0 | 21462 | 2 |
| Mode M9 | |||
|---|---|---|---|
| Quadrant | BADHDUFLAG | Total packets | Discarded packets |
| A | 0 | 5 | 0 |
| B | 0 | 5 | 0 |
| C | 0 | 5 | 0 |
| D | 0 | 5 | 0 |
| Quadrant | Total seconds | Saturated seconds | Saturation percentage |
|---|---|---|---|
| A | 8181 | 64 | 0.782300% |
| B | 8182 | 168 | 2.053288% |
| C | 8182 | 113 | 1.381080% |
| D | 8182 | 432 | 5.279883% |
Noise dominated data is calculated using 1-second bins in cleaned event files. If a bin has >2000 counts, and if more than 50% of those come from <1% of pixels, then it is considered to be noise-dominated and hence unusable.
| Quadrant | # 1 sec bins | Bins with >0 counts | Bins with >2000 counts | High rate bins dominated by noise | Noise dominated (total time) | Noise dominated (detector-on time) | Marked lightcurve |
|---|---|---|---|---|---|---|---|
| A | 8686 | 8183 | 3 | 3 | 0.03% | 0.04% | 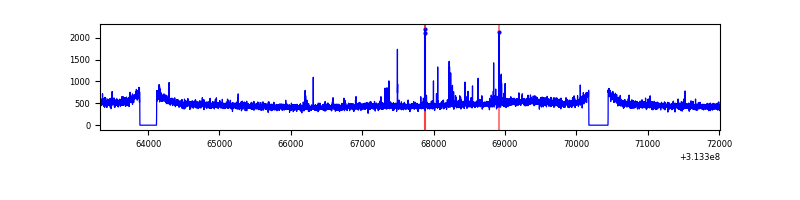 |
| B | 8687 | 8184 | 9 | 9 | 0.10% | 0.11% | 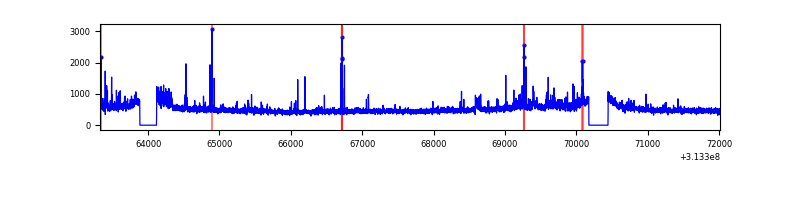 |
| C | 8687 | 8184 | 6 | 6 | 0.07% | 0.07% | 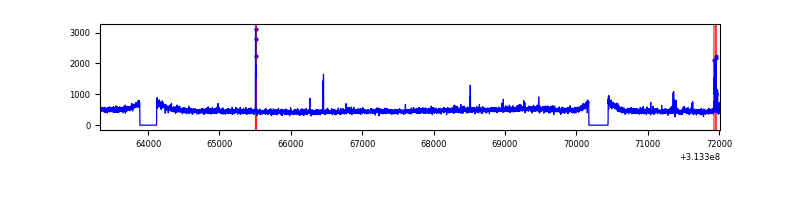 |
| D | 8687 | 8184 | 260 | 260 | 2.99% | 3.18% | 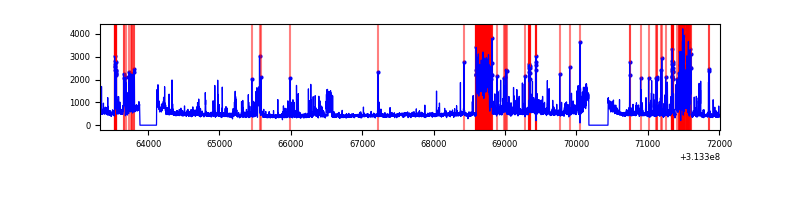 |
Top three noisy pixels from each quadrant. If the there are fewer than three noisy pixels in the level2.evt file, extra rows are filled as -1
| Pixel properties | Quadrant properties | ||||||
|---|---|---|---|---|---|---|---|
| Quadrant | DetID | PixID | Counts | Sigma | Mean | Median | Sigma |
| A | 14 | 235 | 61595 | 301.8 | 997 | 976 | 200.9 |
| A | 13 | 254 | 15376 | 71.69 | 997 | 976 | 200.9 |
| A | 0 | 226 | 8532 | 37.62 | 997 | 976 | 200.9 |
| B | 0 | 230 | 117942 | 617.33 | 998 | 971 | 189.5 |
| B | 0 | 190 | 98873 | 516.69 | 998 | 971 | 189.5 |
| B | 0 | 229 | 80125 | 417.75 | 998 | 971 | 189.5 |
| C | 14 | 238 | 147439 | 655.71 | 951 | 956 | 223.4 |
| C | 10 | 22 | 37339 | 162.86 | 951 | 956 | 223.4 |
| C | 10 | 23 | 25013 | 107.69 | 951 | 956 | 223.4 |
| D | 1 | 52 | 704326 | 3041.85 | 949 | 918 | 231.2 |
| D | 12 | 33 | 215754 | 929.05 | 949 | 918 | 231.2 |
| D | 12 | 233 | 176513 | 759.35 | 949 | 918 | 231.2 |
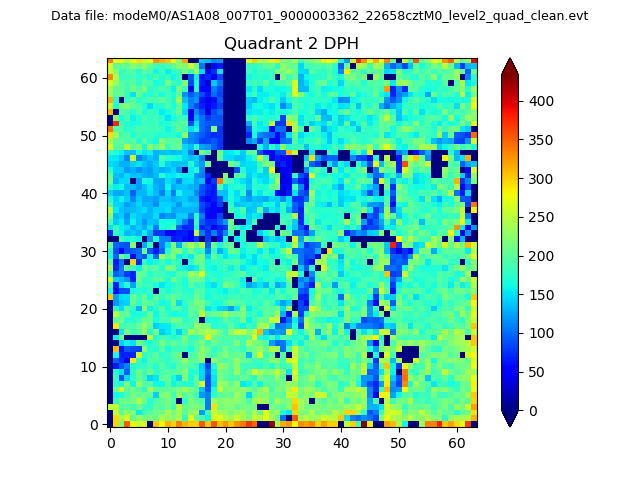
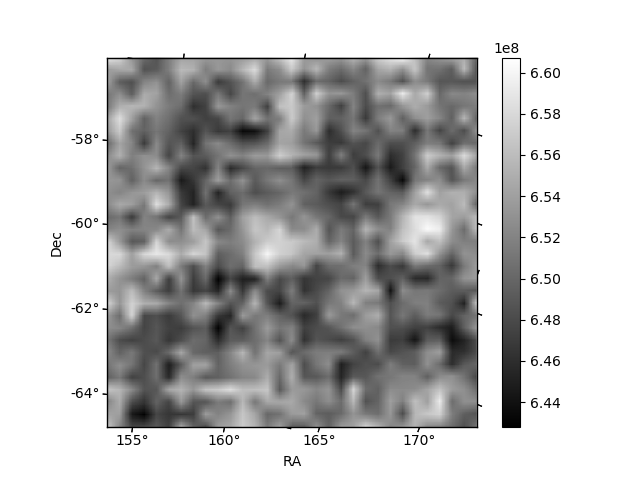
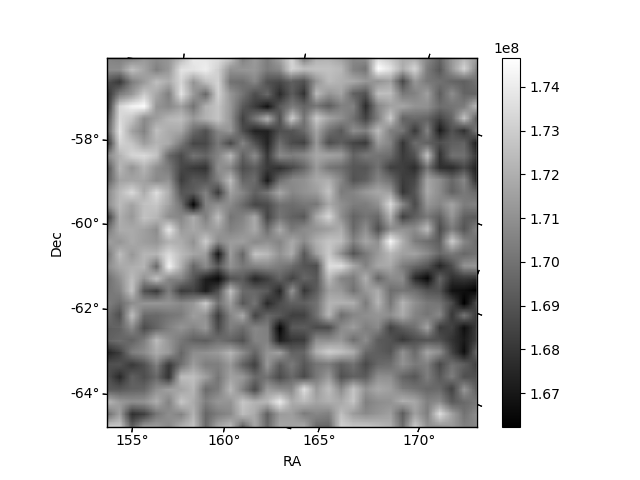
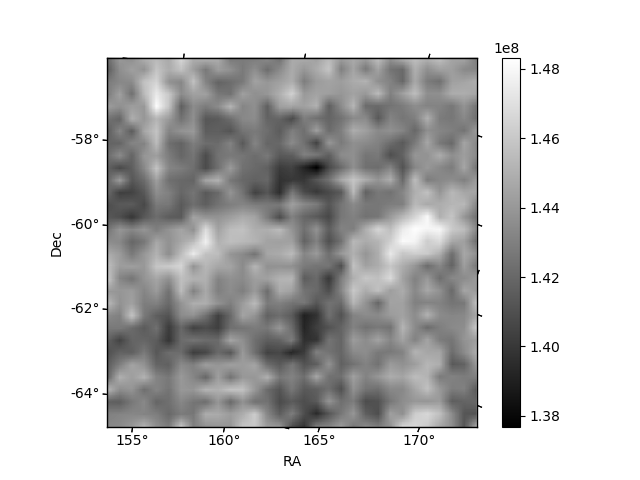
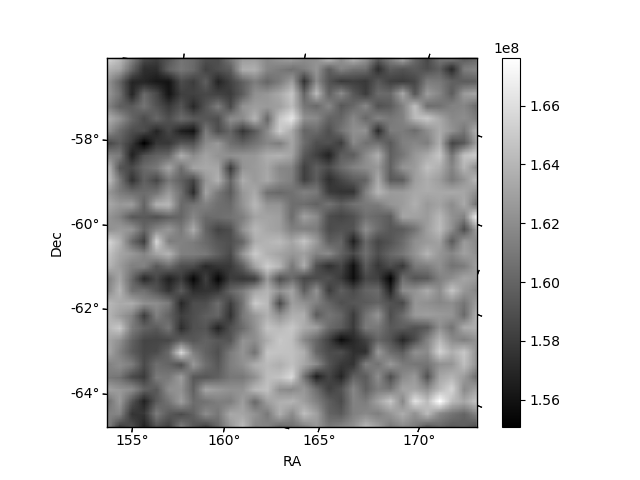
Histogram calculated using DETX and DETY for each event in the final _common_clean file
| Quadrant A | 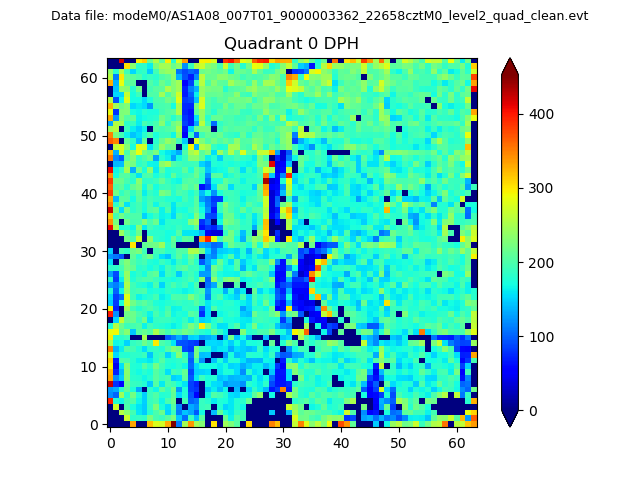 |
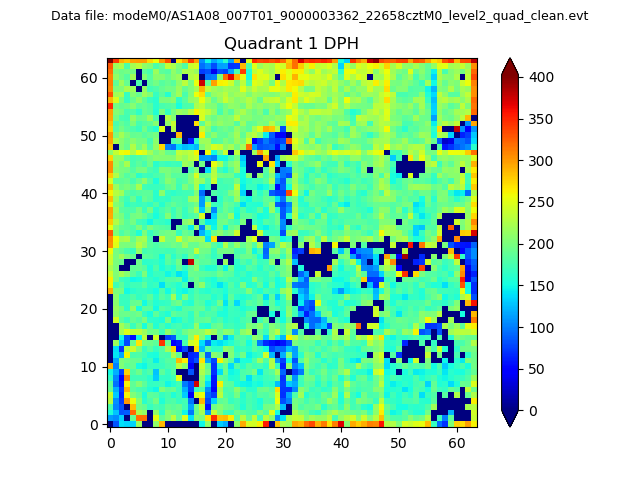 |
Quadrant B |
|---|---|---|---|
| Quadrant D | 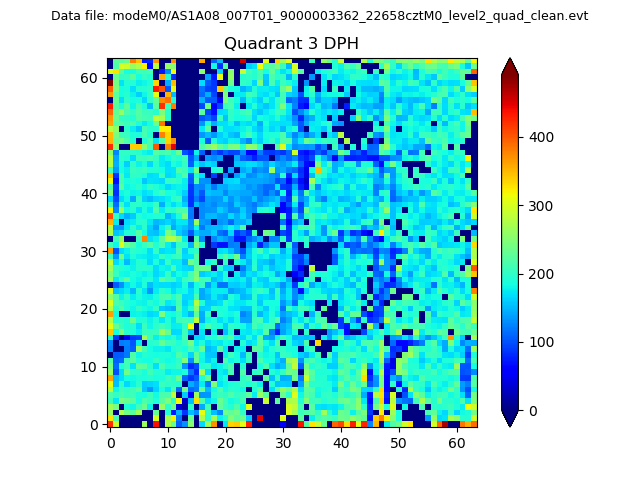 |
 |
Quadrant C |
| Plot type | Count rate plots | Images |
|---|---|---|
| Comparison with Poisson distribution Blue bars denote a histogram of data divided into 1 sec bins. Red curve is a Poisson curve with rate = median count rate of data. |
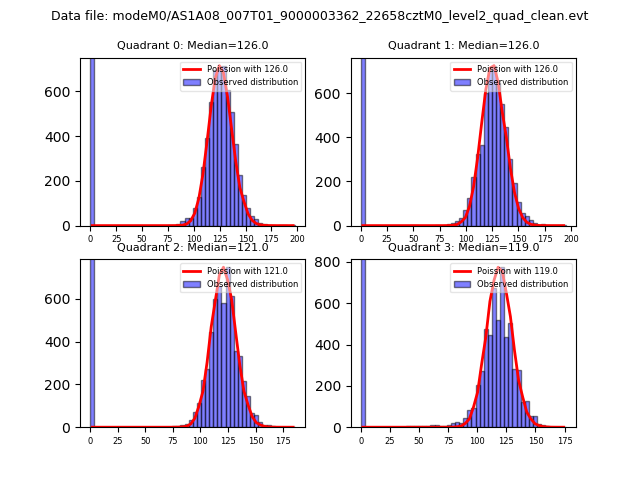 |
 |
| Quadrant-wise count rates Data is divided into 100 sec bins |
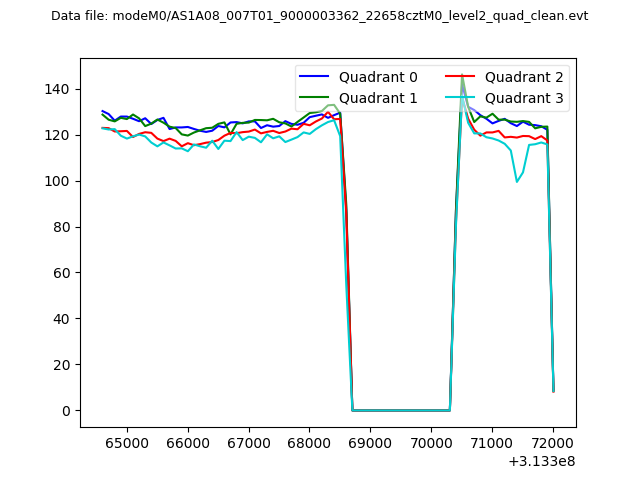 |
|
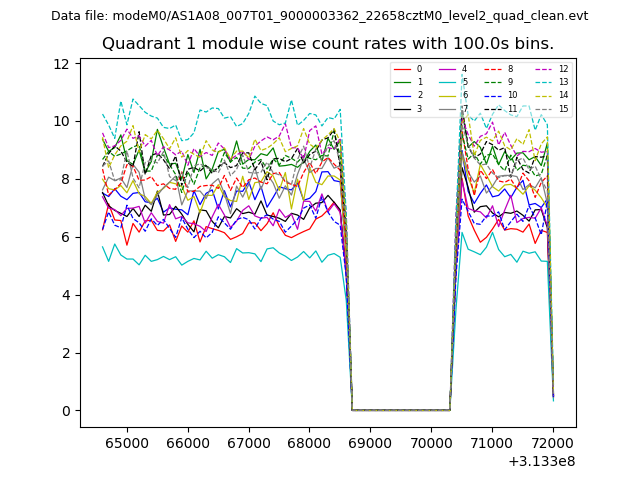
| Module-wise count rates for Quadrant A Data is divided into 100 sec bins |
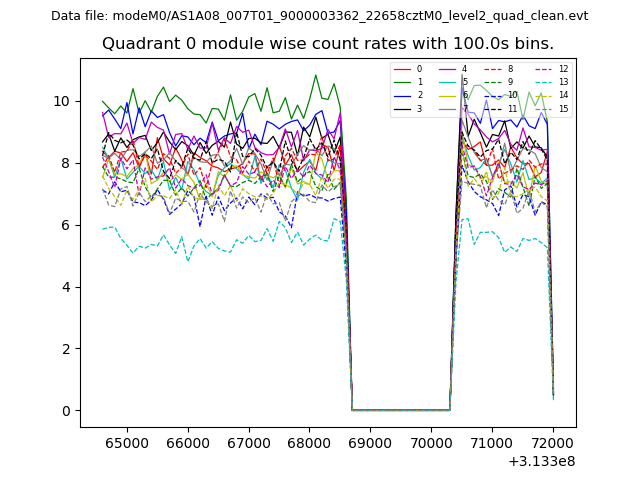 |
 |
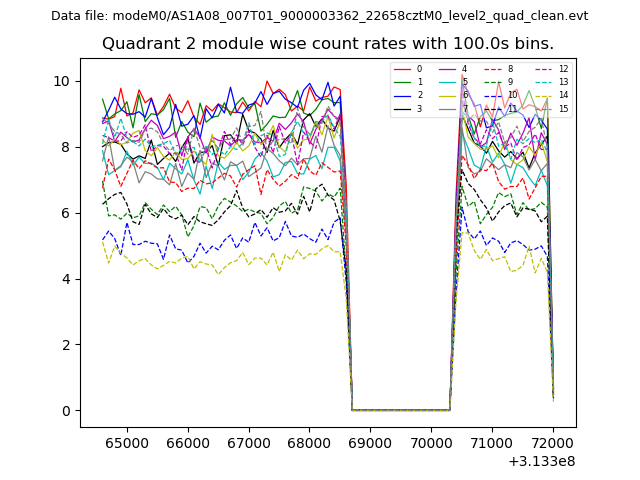
| Module-wise count rates for Quadrant B Data is divided into 100 sec bins |
 |
 |
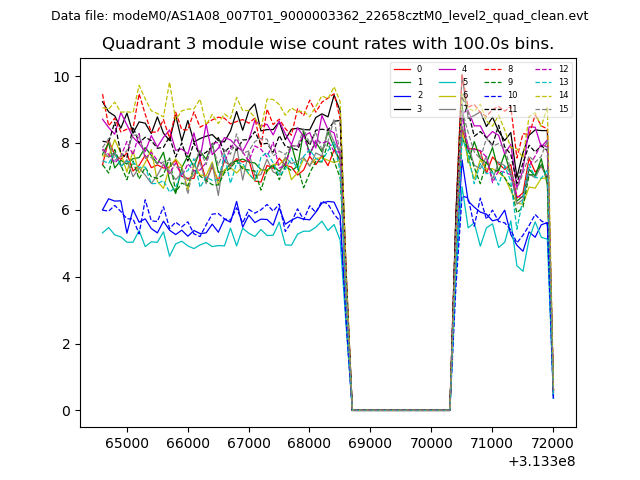
| Module-wise count rates for Quadrant C Data is divided into 100 sec bins |
 |
 |
| Module-wise count rates for Quadrant D Data is divided into 100 sec bins |
 |
 |
| Parameter | Plot |
|---|---|
| CZT HV Monitor | 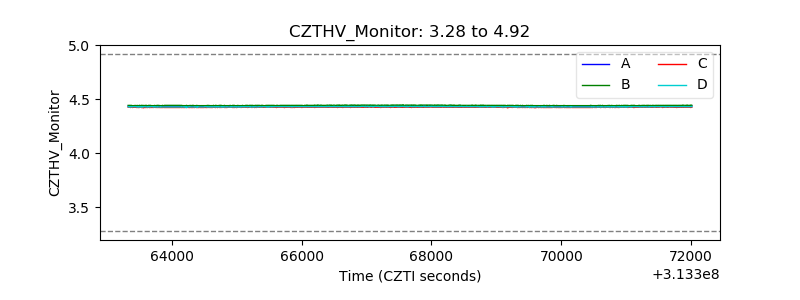 |
| D_VDD |  |
| Temperature 1 |  |
| Veto HV Monitor | 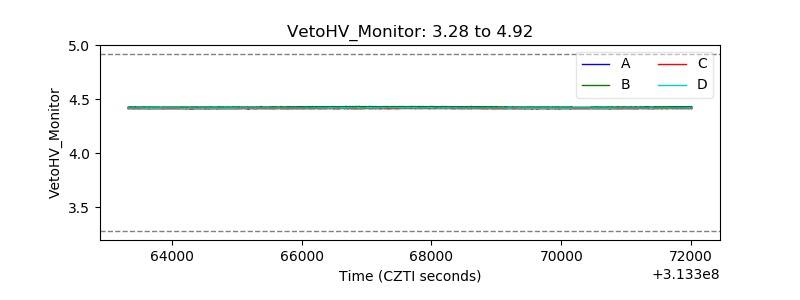 |
| Veto LLD | 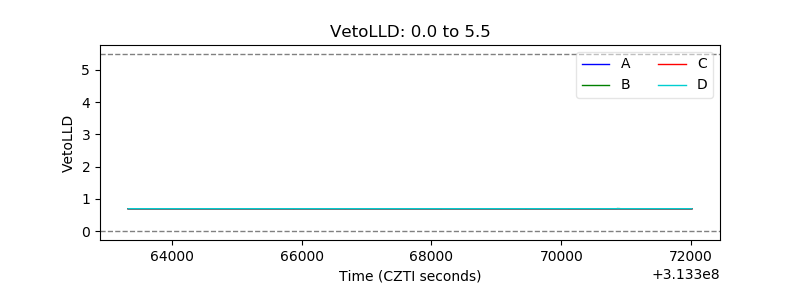 |
| Alpha Counter | 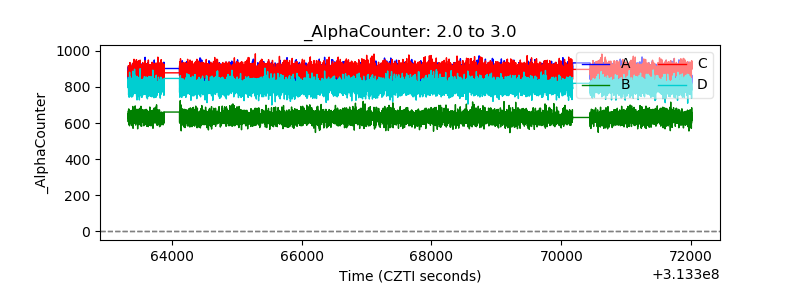 |
| _CPM_Rate | 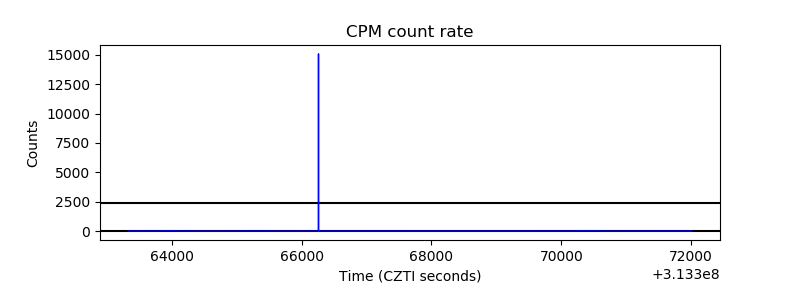 |
| CZT Counter | 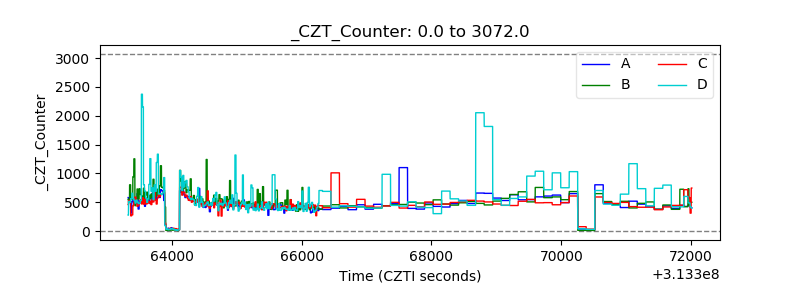 |
| +2.5 Volts monitor |  |
| +5 Volts monitor |  |
| _ROLL_ROT | 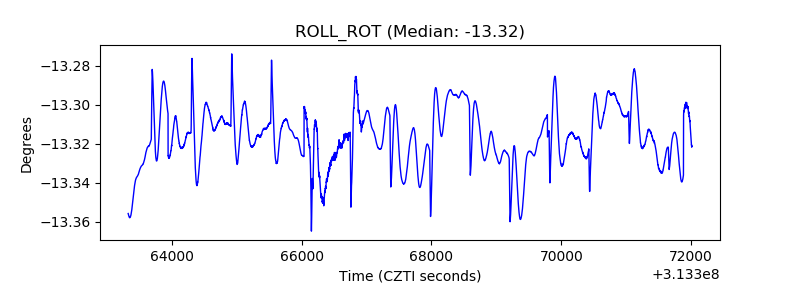 |
| _Roll_DEC | 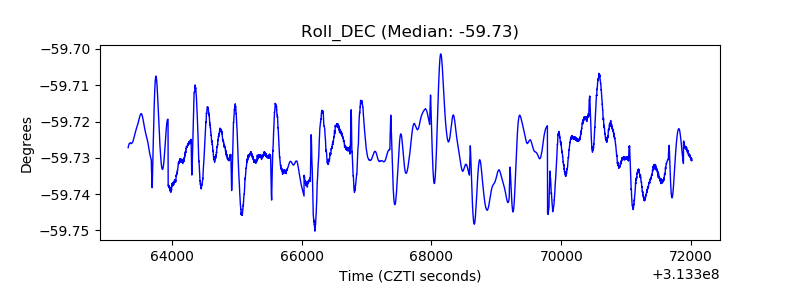 |
| _Roll_RA | 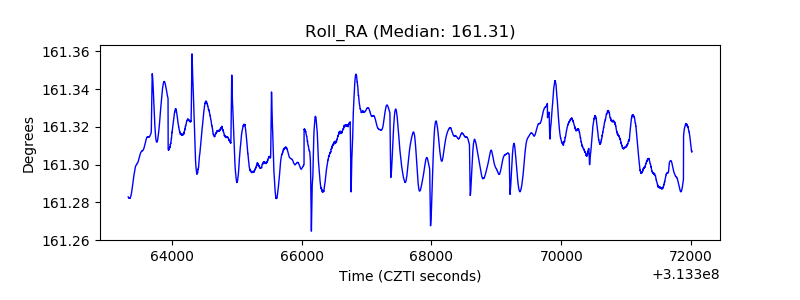 |
| Veto Counter | 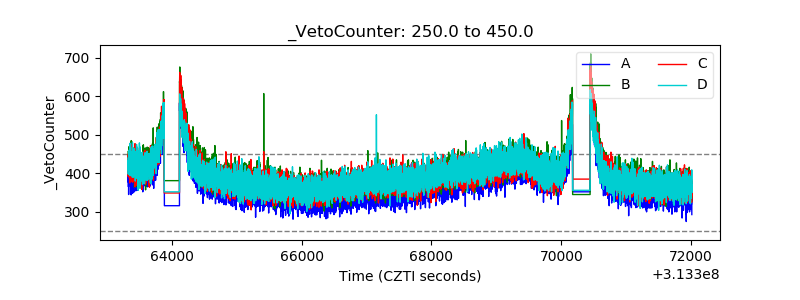 |