| Param | Original file | Final file |
|---|---|---|
| Filename | modeM0/AS1A08_007T01_9000003362_22664cztM0_level2.evt | modeM0/AS1A08_007T01_9000003362_22664cztM0_level2_quad_clean.evt |
| Size (bytes) | 723,890,880 | 135,731,520 |
| Size | 690.4 MB | 129.4 MB |
| Events in quadrant A | 4,384,188 | 890,224 |
| Events in quadrant B | 4,845,921 | 902,704 |
| Events in quadrant C | 4,491,614 | 862,509 |
| Events in quadrant D | 7,555,204 | 794,079 |
| Mode SS | |||
|---|---|---|---|
| Quadrant | BADHDUFLAG | Total packets | Discarded packets |
| A | 0 | 192 | 0 |
| B | 0 | 192 | 0 |
| C | 0 | 192 | 0 |
| D | 0 | 192 | 0 |
| Mode M0 | |||
|---|---|---|---|
| Quadrant | BADHDUFLAG | Total packets | Discarded packets |
| A | 0 | 19502 | 2 |
| B | 0 | 20808 | 2 |
| C | 0 | 19546 | 2 |
| D | 0 | 28971 | 2 |
| Mode M9 | |||
|---|---|---|---|
| Quadrant | BADHDUFLAG | Total packets | Discarded packets |
| A | 0 | 8 | 0 |
| B | 0 | 8 | 0 |
| C | 0 | 8 | 0 |
| D | 0 | 8 | 0 |
| Quadrant | Total seconds | Saturated seconds | Saturation percentage |
|---|---|---|---|
| A | 9544 | 39 | 0.408634% |
| B | 9544 | 104 | 1.089690% |
| C | 9544 | 107 | 1.121123% |
| D | 9544 | 1008 | 10.561609% |
Noise dominated data is calculated using 1-second bins in cleaned event files. If a bin has >2000 counts, and if more than 50% of those come from <1% of pixels, then it is considered to be noise-dominated and hence unusable.
| Quadrant | # 1 sec bins | Bins with >0 counts | Bins with >2000 counts | High rate bins dominated by noise | Noise dominated (total time) | Noise dominated (detector-on time) | Marked lightcurve |
|---|---|---|---|---|---|---|---|
| A | 10284 | 9546 | 0 | 0 | 0.00% | 0.00% | 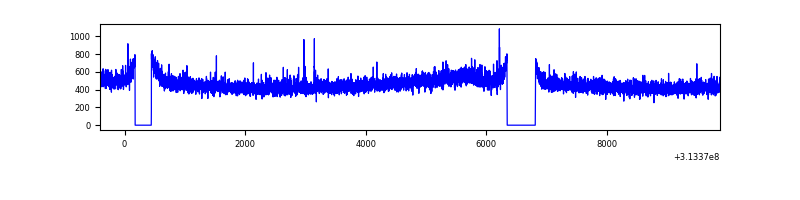 |
| B | 10284 | 9546 | 4 | 4 | 0.04% | 0.04% |  |
| C | 10284 | 9546 | 3 | 3 | 0.03% | 0.03% | 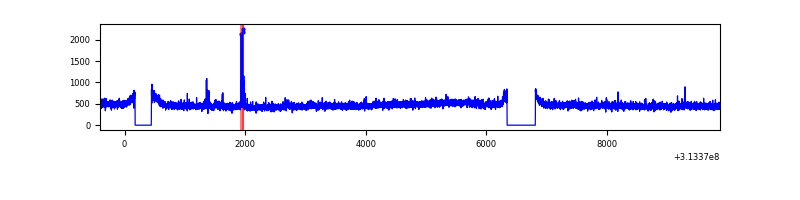 |
| D | 10284 | 9546 | 776 | 776 | 7.55% | 8.13% | 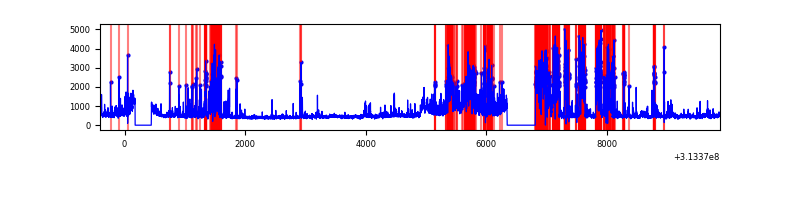 |
Top three noisy pixels from each quadrant. If the there are fewer than three noisy pixels in the level2.evt file, extra rows are filled as -1
| Pixel properties | Quadrant properties | ||||||
|---|---|---|---|---|---|---|---|
| Quadrant | DetID | PixID | Counts | Sigma | Mean | Median | Sigma |
| A | 14 | 235 | 21802 | 91.02 | 1130 | 1107 | 227.4 |
| A | 13 | 254 | 17555 | 72.34 | 1130 | 1107 | 227.4 |
| A | 0 | 226 | 9618 | 37.43 | 1130 | 1107 | 227.4 |
| B | 0 | 219 | 103678 | 477.19 | 1134 | 1105 | 215.0 |
| B | 0 | 230 | 79296 | 363.76 | 1134 | 1105 | 215.0 |
| B | 0 | 229 | 78553 | 360.3 | 1134 | 1105 | 215.0 |
| C | 14 | 238 | 171371 | 668.23 | 1090 | 1094 | 254.8 |
| C | 10 | 23 | 25913 | 97.4 | 1090 | 1094 | 254.8 |
| C | 0 | 239 | 21345 | 79.47 | 1090 | 1094 | 254.8 |
| D | 1 | 52 | 2186222 | 8671.11 | 1043 | 1013 | 252.0 |
| D | 9 | 1 | 495953 | 1963.97 | 1043 | 1013 | 252.0 |
| D | 12 | 33 | 316374 | 1251.38 | 1043 | 1013 | 252.0 |
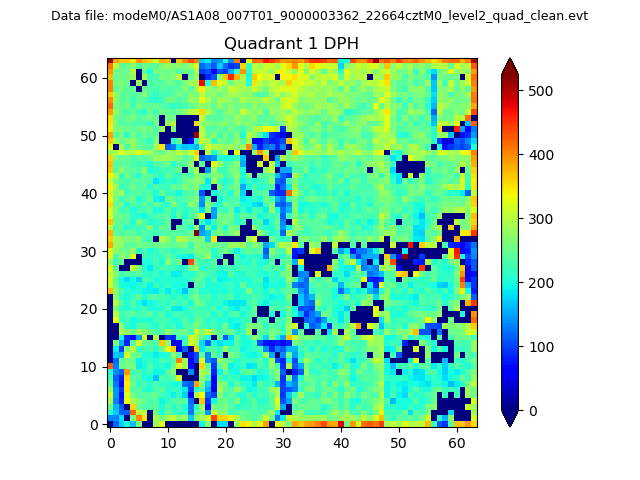
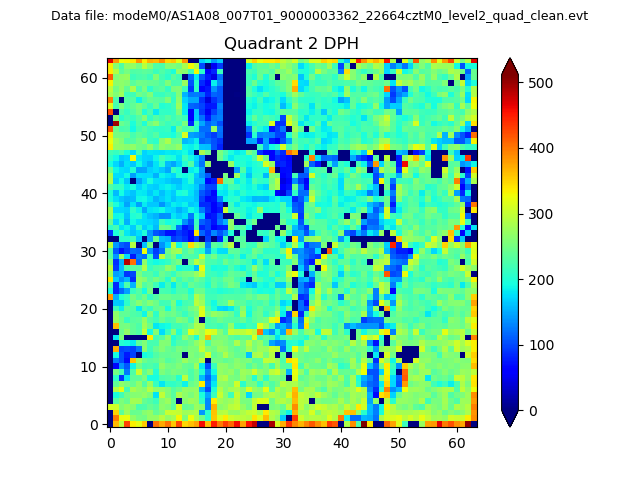
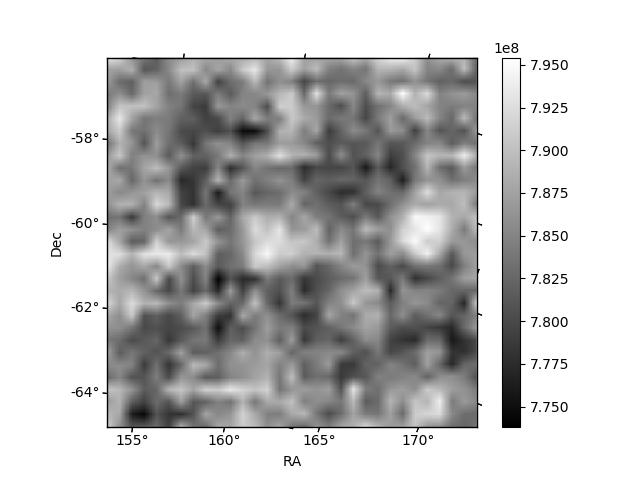
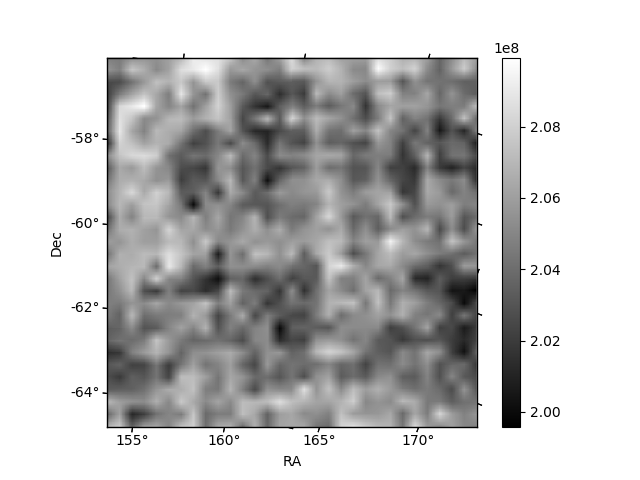
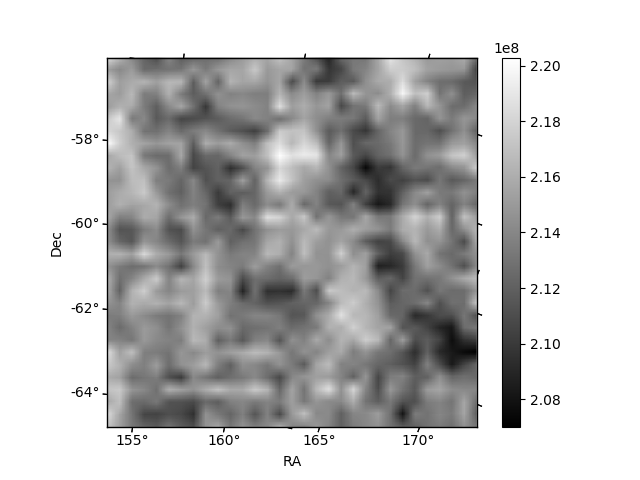
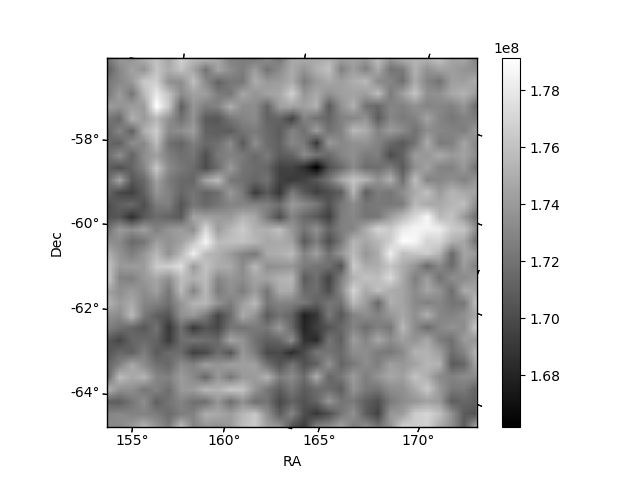
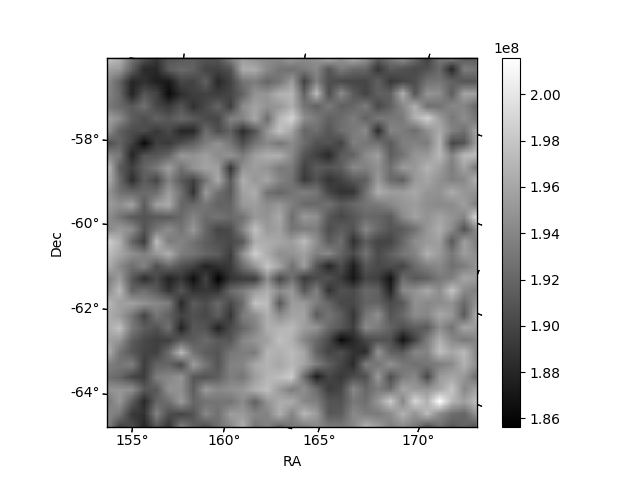
Histogram calculated using DETX and DETY for each event in the final _common_clean file
| Quadrant A | 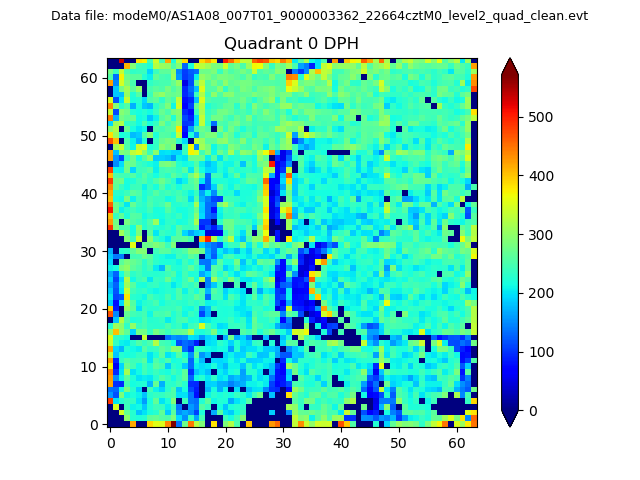 |
 |
Quadrant B |
|---|---|---|---|
| Quadrant D | 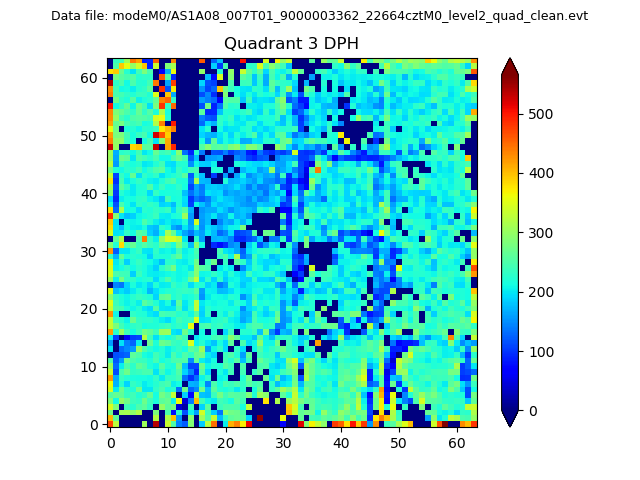 |
 |
Quadrant C |
| Plot type | Count rate plots | Images |
|---|---|---|
| Comparison with Poisson distribution Blue bars denote a histogram of data divided into 1 sec bins. Red curve is a Poisson curve with rate = median count rate of data. |
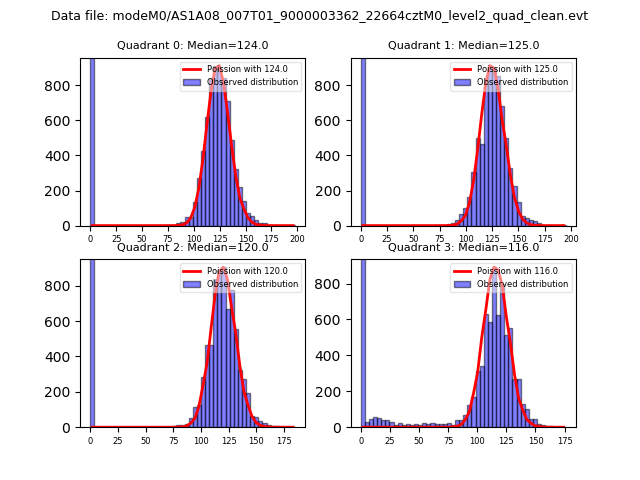 |
 |
| Quadrant-wise count rates Data is divided into 100 sec bins |
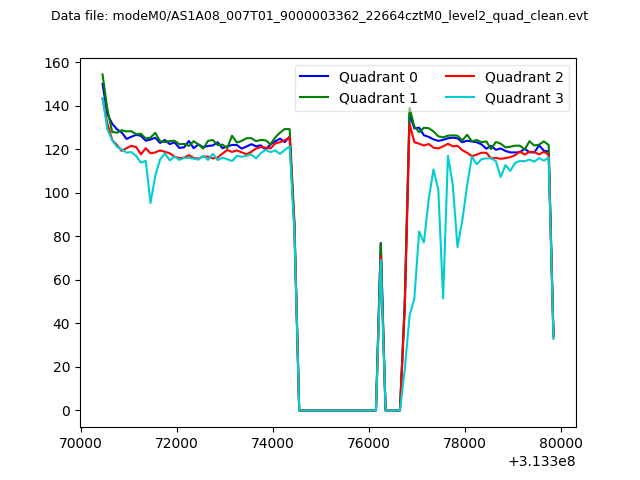 |
|
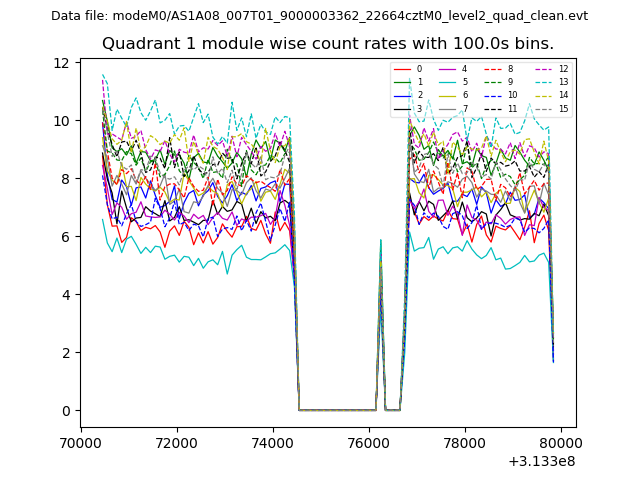
| Module-wise count rates for Quadrant A Data is divided into 100 sec bins |
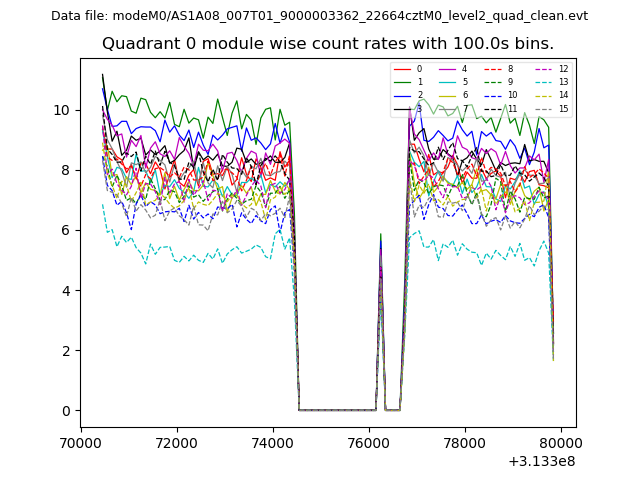 |
 |
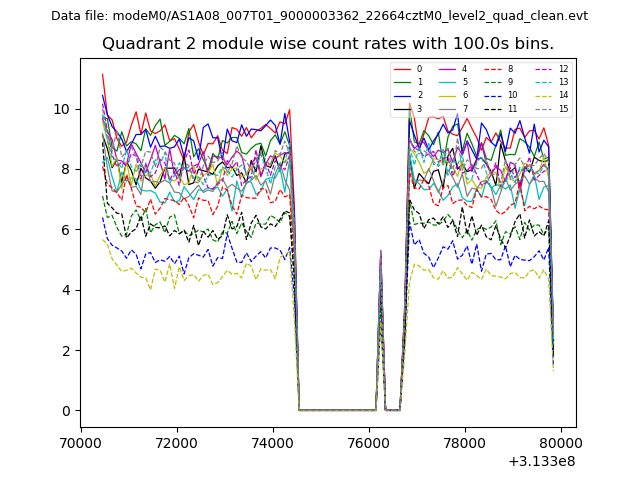
| Module-wise count rates for Quadrant B Data is divided into 100 sec bins |
 |
 |
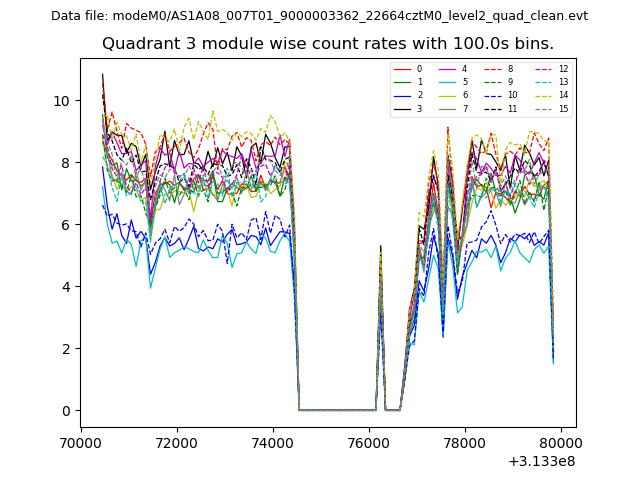
| Module-wise count rates for Quadrant C Data is divided into 100 sec bins |
 |
 |
| Module-wise count rates for Quadrant D Data is divided into 100 sec bins |
 |
 |
| Parameter | Plot |
|---|---|
| CZT HV Monitor | 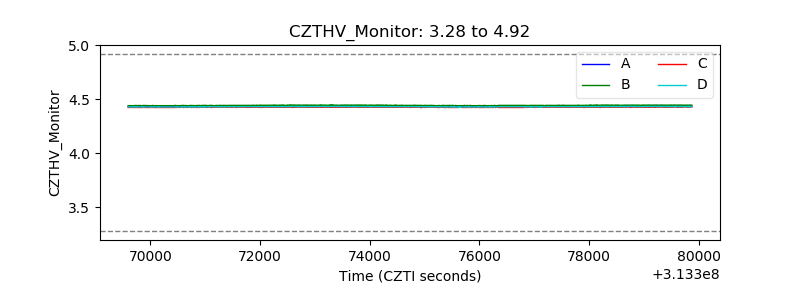 |
| D_VDD | 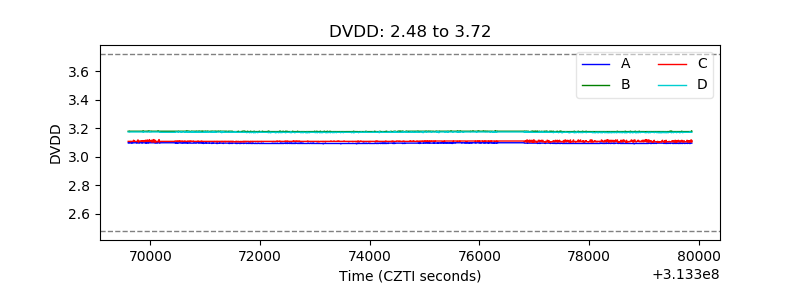 |
| Temperature 1 | 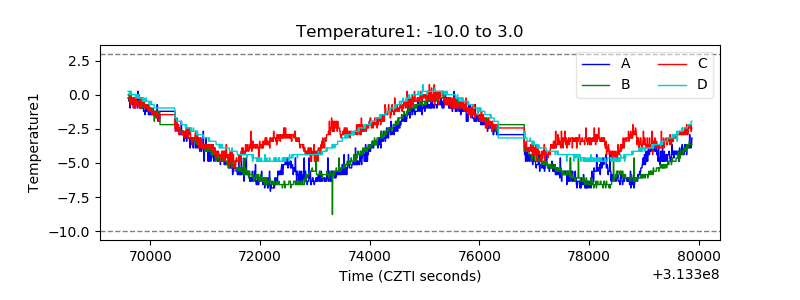 |
| Veto HV Monitor | 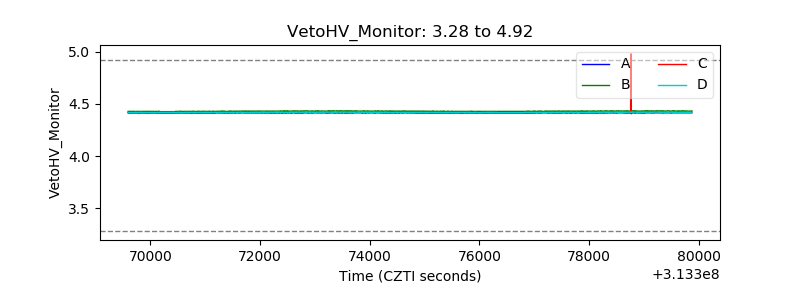 |
| Veto LLD | 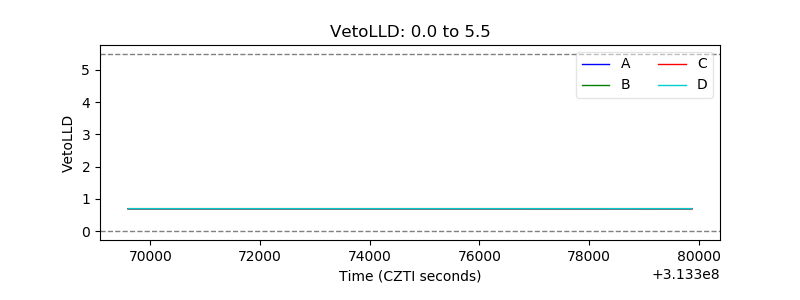 |
| Alpha Counter | 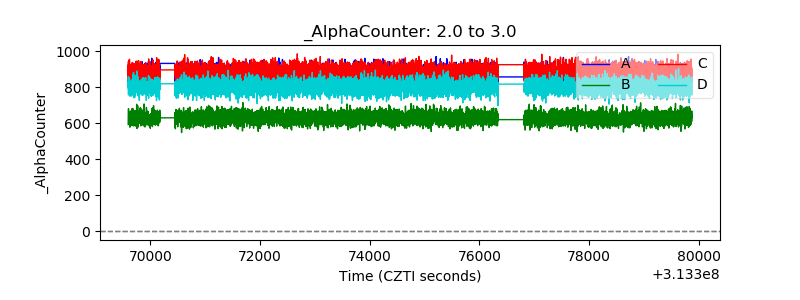 |
| _CPM_Rate |  |
| CZT Counter | 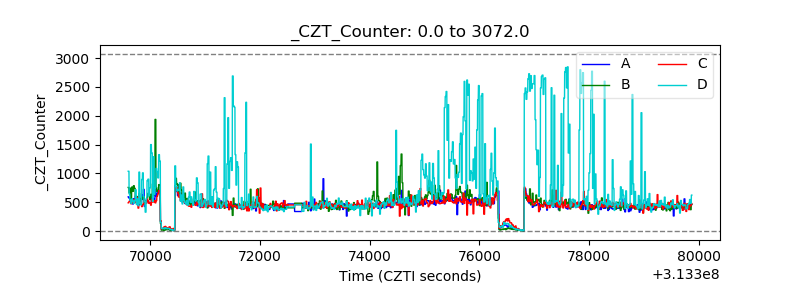 |
| +2.5 Volts monitor |  |
| +5 Volts monitor |  |
| _ROLL_ROT | 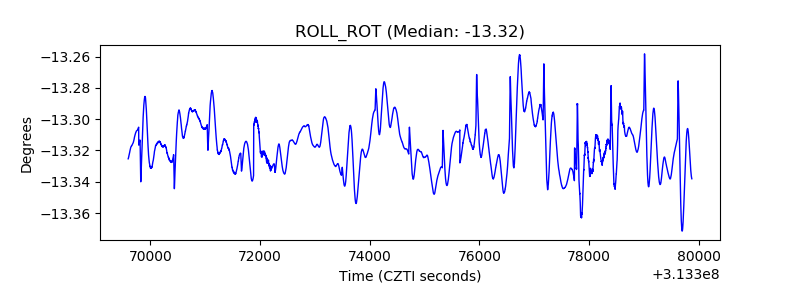 |
| _Roll_DEC | 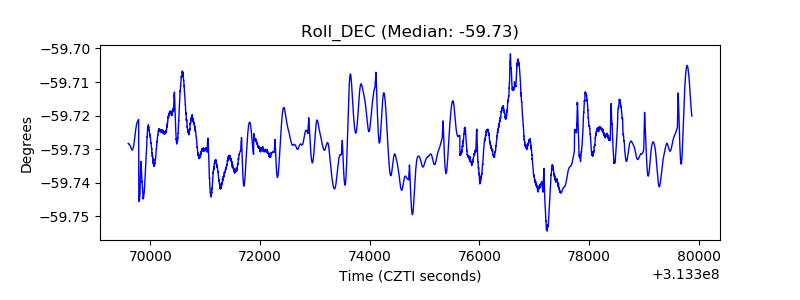 |
| _Roll_RA | 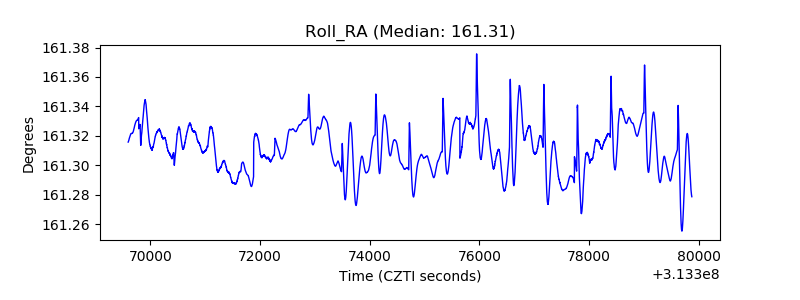 |
| Veto Counter | 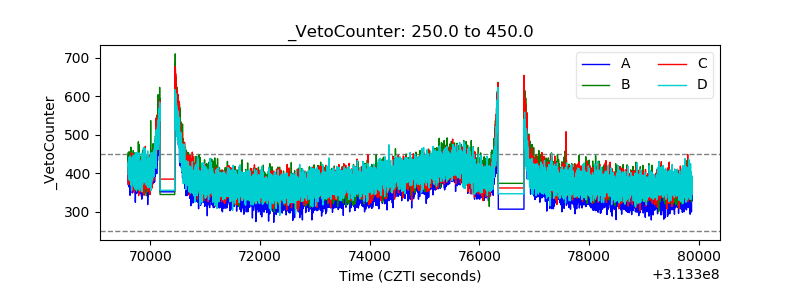 |