| Param | Original file | Final file |
|---|---|---|
| Filename | modeM0/AS1A08_007T01_9000003362_22665cztM0_level2.evt | modeM0/AS1A08_007T01_9000003362_22665cztM0_level2_quad_clean.evt |
| Size (bytes) | 1,935,555,840 | 347,120,640 |
| Size | 1.8 GB | 331.0 MB |
| Events in quadrant A | 12,108,374 | 2,242,105 |
| Events in quadrant B | 13,409,343 | 2,263,030 |
| Events in quadrant C | 12,342,259 | 2,185,033 |
| Events in quadrant D | 19,062,991 | 2,094,586 |
| Mode SS | |||
|---|---|---|---|
| Quadrant | BADHDUFLAG | Total packets | Discarded packets |
| A | 0 | 514 | 0 |
| B | 0 | 514 | 0 |
| C | 0 | 514 | 0 |
| D | 0 | 514 | 0 |
| Mode M0 | |||
|---|---|---|---|
| Quadrant | BADHDUFLAG | Total packets | Discarded packets |
| A | 0 | 51964 | 5 |
| B | 0 | 55817 | 5 |
| C | 0 | 52427 | 5 |
| D | 0 | 73437 | 5 |
| Mode M9 | |||
|---|---|---|---|
| Quadrant | BADHDUFLAG | Total packets | Discarded packets |
| A | 0 | 48 | 0 |
| B | 0 | 48 | 0 |
| C | 0 | 48 | 0 |
| D | 0 | 48 | 0 |
| Quadrant | Total seconds | Saturated seconds | Saturation percentage |
|---|---|---|---|
| A | 25130 | 101 | 0.401910% |
| B | 25131 | 296 | 1.177828% |
| C | 25131 | 278 | 1.106203% |
| D | 25131 | 1616 | 6.430305% |
Noise dominated data is calculated using 1-second bins in cleaned event files. If a bin has >2000 counts, and if more than 50% of those come from <1% of pixels, then it is considered to be noise-dominated and hence unusable.
| Quadrant | # 1 sec bins | Bins with >0 counts | Bins with >2000 counts | High rate bins dominated by noise | Noise dominated (total time) | Noise dominated (detector-on time) | Marked lightcurve |
|---|---|---|---|---|---|---|---|
| A | 29955 | 25135 | 0 | 0 | 0.00% | 0.00% | 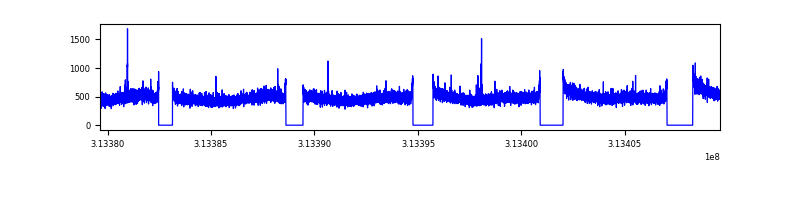 |
| B | 29956 | 25136 | 131 | 131 | 0.44% | 0.52% | 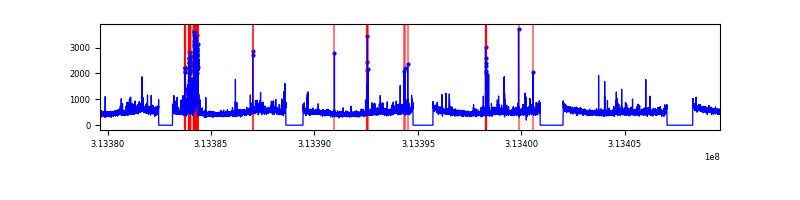 |
| C | 29956 | 25136 | 9 | 9 | 0.03% | 0.04% | 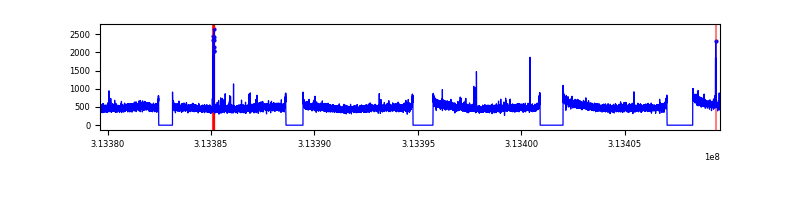 |
| D | 29956 | 25136 | 1248 | 1248 | 4.17% | 4.96% | 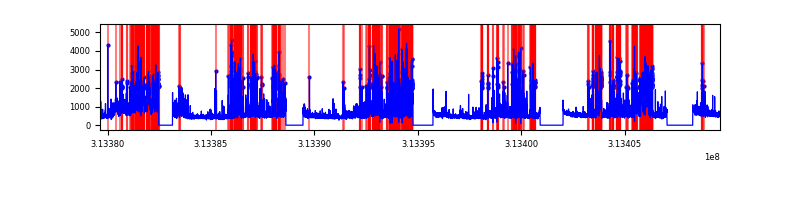 |
Top three noisy pixels from each quadrant. If the there are fewer than three noisy pixels in the level2.evt file, extra rows are filled as -1
| Pixel properties | Quadrant properties | ||||||
|---|---|---|---|---|---|---|---|
| Quadrant | DetID | PixID | Counts | Sigma | Mean | Median | Sigma |
| A | 13 | 254 | 44172 | 65.84 | 3131 | 3068 | 624.3 |
| A | 14 | 235 | 28393 | 40.56 | 3131 | 3068 | 624.3 |
| A | 0 | 226 | 27598 | 39.29 | 3131 | 3068 | 624.3 |
| B | 3 | 64 | 517942 | 896.01 | 3097 | 3020 | 574.7 |
| B | 0 | 219 | 186186 | 318.73 | 3097 | 3020 | 574.7 |
| B | 0 | 230 | 168234 | 287.49 | 3097 | 3020 | 574.7 |
| C | 14 | 238 | 474848 | 673.21 | 3015 | 3033 | 700.8 |
| C | 10 | 22 | 95621 | 132.11 | 3015 | 3033 | 700.8 |
| C | 13 | 61 | 20847 | 25.42 | 3015 | 3033 | 700.8 |
| D | 9 | 1 | 2243695 | 3102.44 | 3003 | 2924 | 722.3 |
| D | 12 | 33 | 1976179 | 2732.05 | 3003 | 2924 | 722.3 |
| D | 1 | 52 | 1714139 | 2369.25 | 3003 | 2924 | 722.3 |
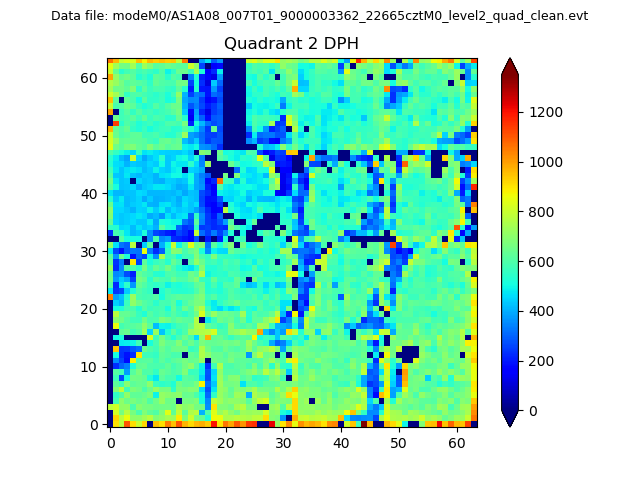
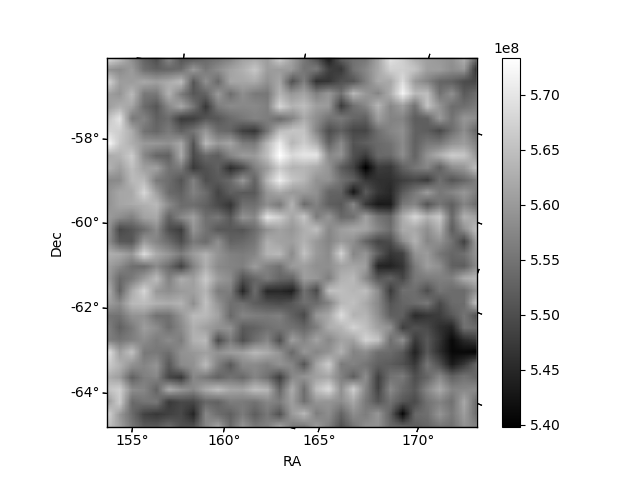
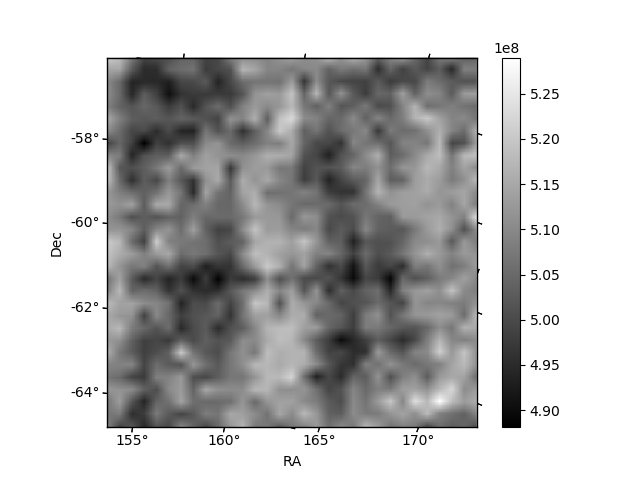
Histogram calculated using DETX and DETY for each event in the final _common_clean file
| Quadrant A | 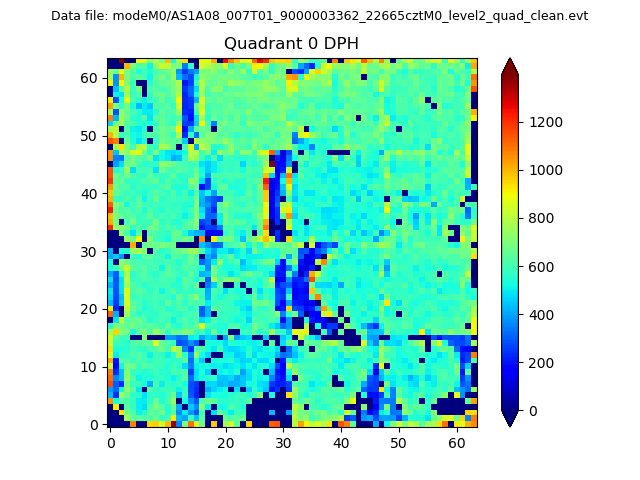 |
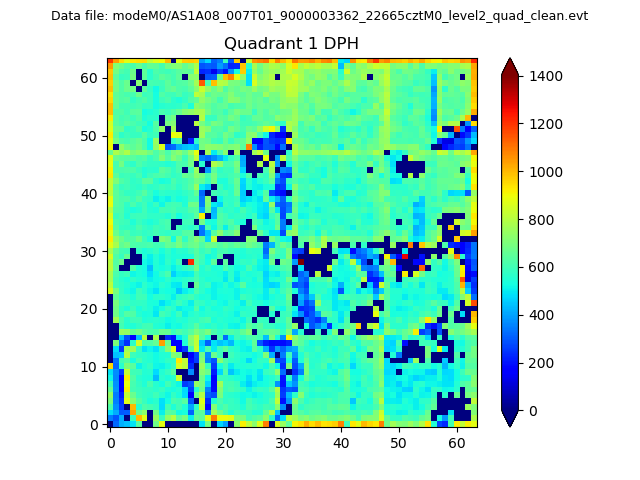 |
Quadrant B |
|---|---|---|---|
| Quadrant D | 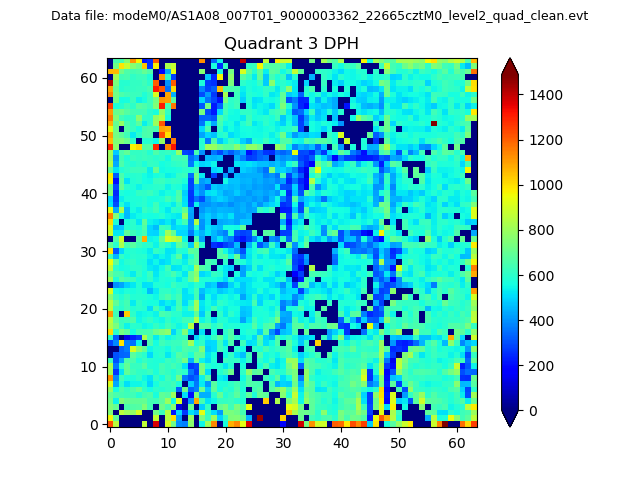 |
 |
Quadrant C |
| Plot type | Count rate plots | Images |
|---|---|---|
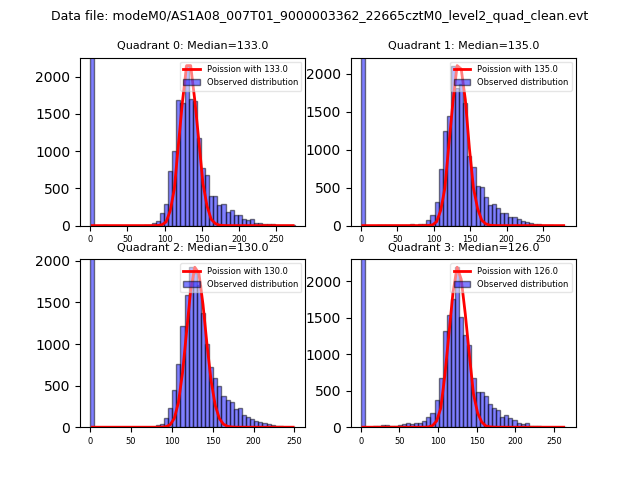
| Comparison with Poisson distribution Blue bars denote a histogram of data divided into 1 sec bins. Red curve is a Poisson curve with rate = median count rate of data. |
 |
 |
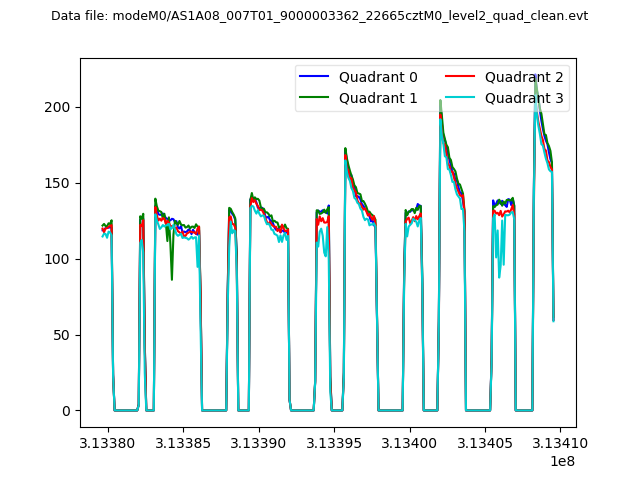
| Quadrant-wise count rates Data is divided into 100 sec bins |
 |
|
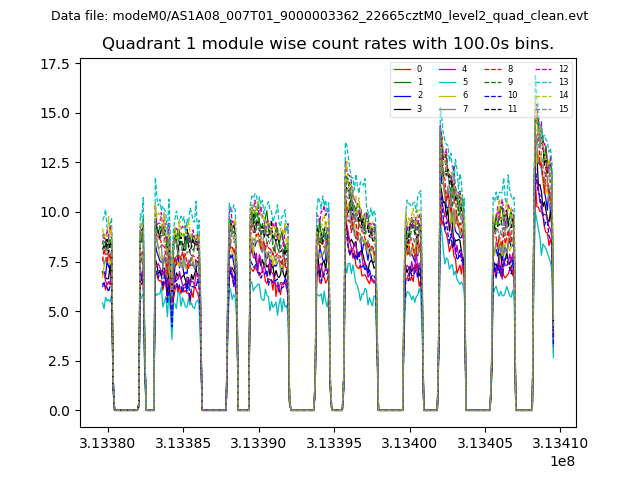
| Module-wise count rates for Quadrant A Data is divided into 100 sec bins |
 |
 |
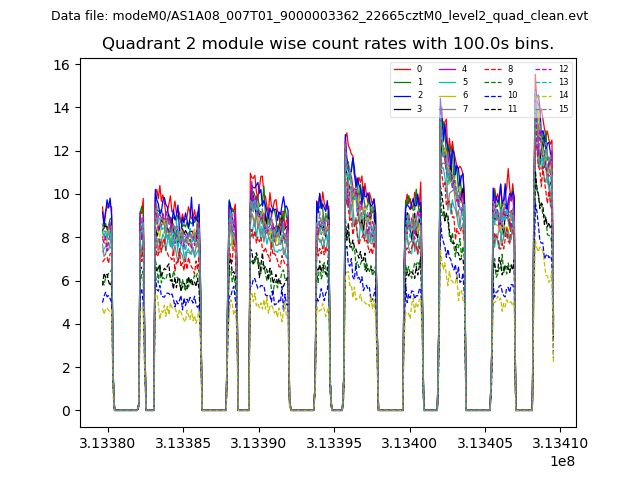
| Module-wise count rates for Quadrant B Data is divided into 100 sec bins |
 |
 |
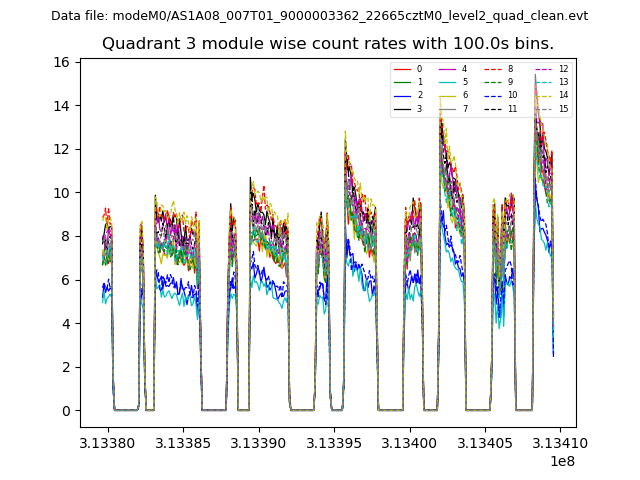
| Module-wise count rates for Quadrant C Data is divided into 100 sec bins |
 |
 |
| Module-wise count rates for Quadrant D Data is divided into 100 sec bins |
 |
 |
| Parameter | Plot |
|---|---|
| CZT HV Monitor | 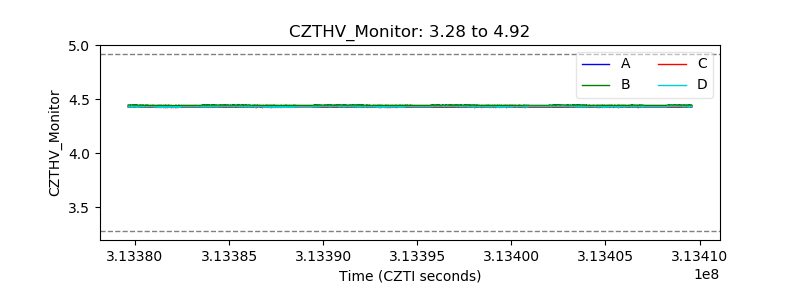 |
| D_VDD | 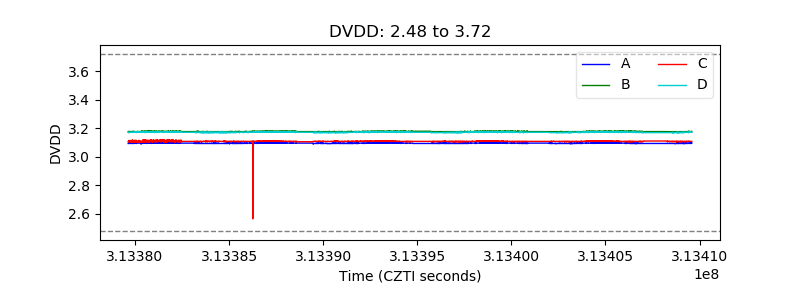 |
| Temperature 1 | 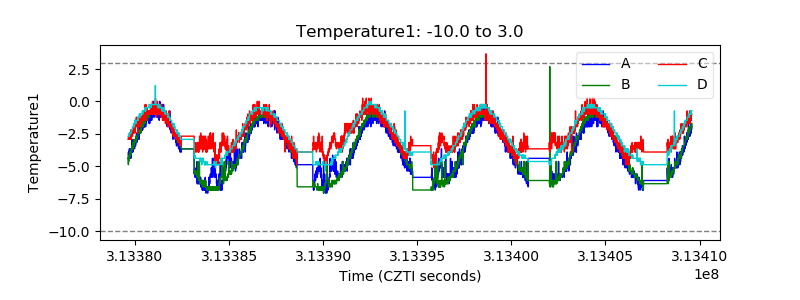 |
| Veto HV Monitor | 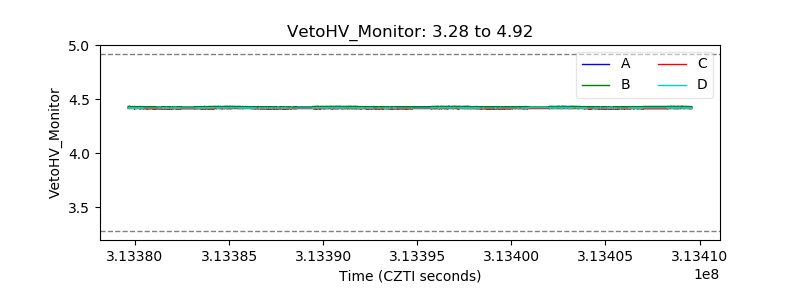 |
| Veto LLD | 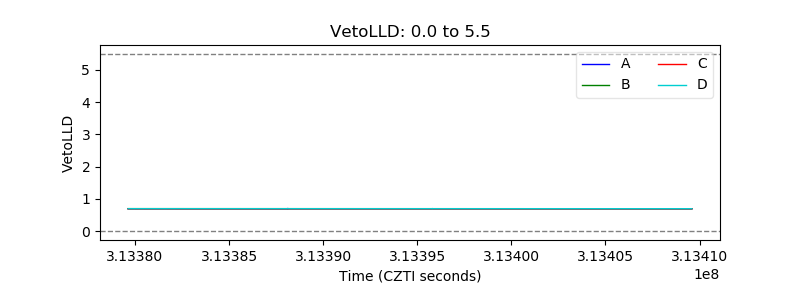 |
| Alpha Counter | 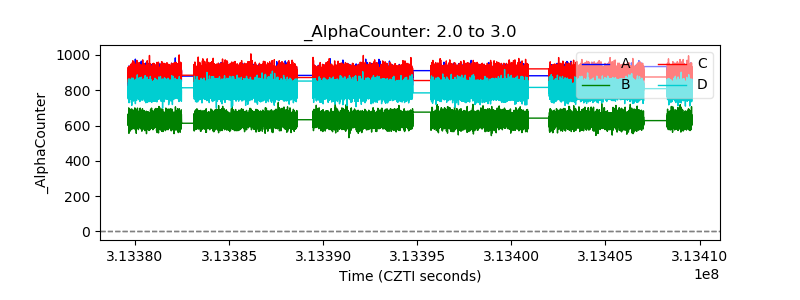 |
| _CPM_Rate | 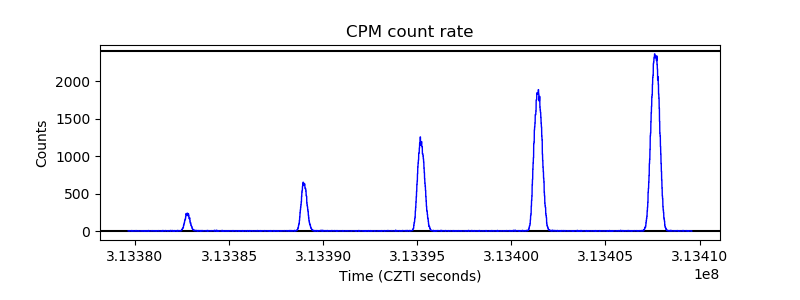 |
| CZT Counter | 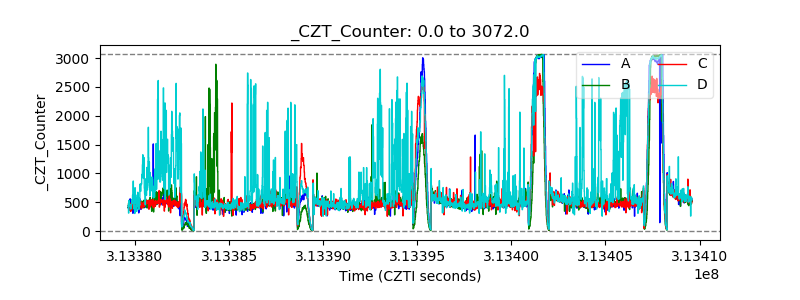 |
| +2.5 Volts monitor |  |
| +5 Volts monitor |  |
| _ROLL_ROT | 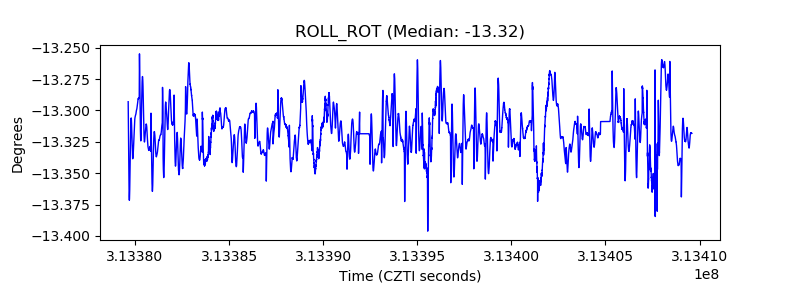 |
| _Roll_DEC | 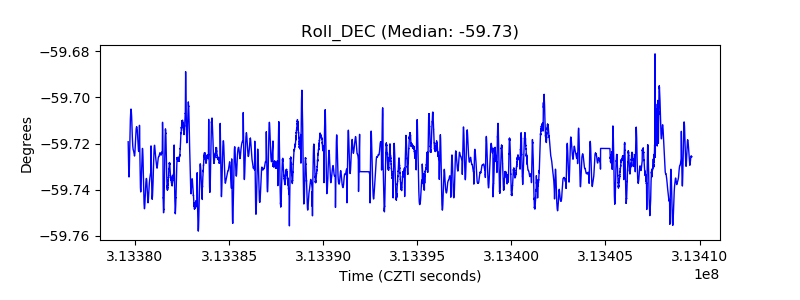 |
| _Roll_RA | 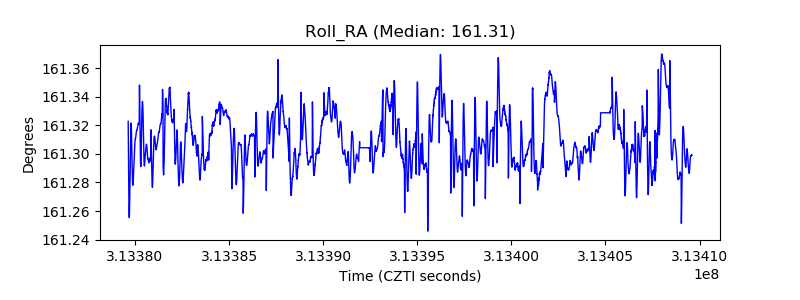 |
| Veto Counter | 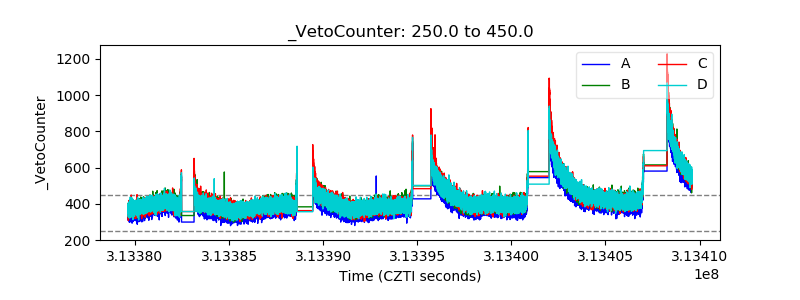 |