| Param | Original file | Final file |
|---|---|---|
| Filename | modeM0/AS1A08_007T01_9000003362_22666cztM0_level2.evt | modeM0/AS1A08_007T01_9000003362_22666cztM0_level2_quad_clean.evt |
| Size (bytes) | 539,285,760 | 92,154,240 |
| Size | 514.3 MB | 87.9 MB |
| Events in quadrant A | 3,320,481 | 608,854 |
| Events in quadrant B | 3,492,130 | 613,629 |
| Events in quadrant C | 3,325,452 | 576,769 |
| Events in quadrant D | 5,775,703 | 560,030 |
| Mode SS | |||
|---|---|---|---|
| Quadrant | BADHDUFLAG | Total packets | Discarded packets |
| A | 0 | 126 | 0 |
| B | 0 | 126 | 0 |
| C | 0 | 126 | 0 |
| D | 0 | 126 | 0 |
| Mode M0 | |||
|---|---|---|---|
| Quadrant | BADHDUFLAG | Total packets | Discarded packets |
| A | 0 | 13653 | 1 |
| B | 0 | 14172 | 1 |
| C | 0 | 13731 | 1 |
| D | 0 | 21556 | 7 |
| Mode M9 | |||
|---|---|---|---|
| Quadrant | BADHDUFLAG | Total packets | Discarded packets |
| A | 0 | 13 | 0 |
| B | 0 | 13 | 0 |
| C | 0 | 13 | 0 |
| D | 0 | 13 | 0 |
| Quadrant | Total seconds | Saturated seconds | Saturation percentage |
|---|---|---|---|
| A | 6178 | 69 | 1.116866% |
| B | 6178 | 65 | 1.052120% |
| C | 6179 | 104 | 1.683120% |
| D | 6178 | 555 | 8.983490% |
Noise dominated data is calculated using 1-second bins in cleaned event files. If a bin has >2000 counts, and if more than 50% of those come from <1% of pixels, then it is considered to be noise-dominated and hence unusable.
| Quadrant | # 1 sec bins | Bins with >0 counts | Bins with >2000 counts | High rate bins dominated by noise | Noise dominated (total time) | Noise dominated (detector-on time) | Marked lightcurve |
|---|---|---|---|---|---|---|---|
| A | 7487 | 6178 | 0 | 0 | 0.00% | 0.00% | 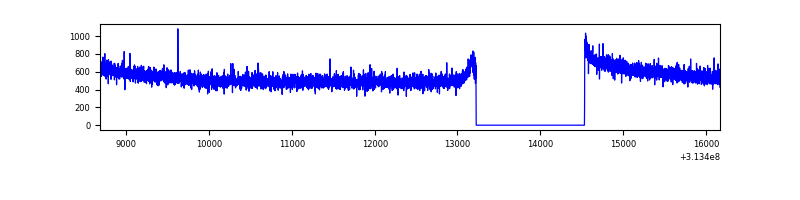 |
| B | 7487 | 6178 | 1 | 1 | 0.01% | 0.02% | 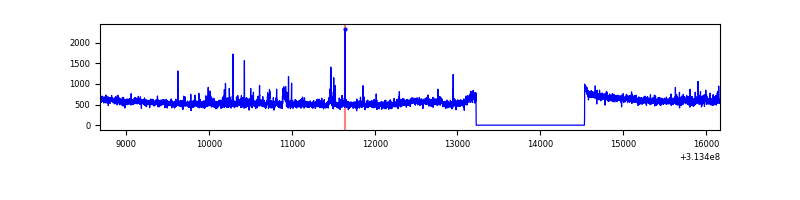 |
| C | 7489 | 6180 | 1 | 1 | 0.01% | 0.02% | 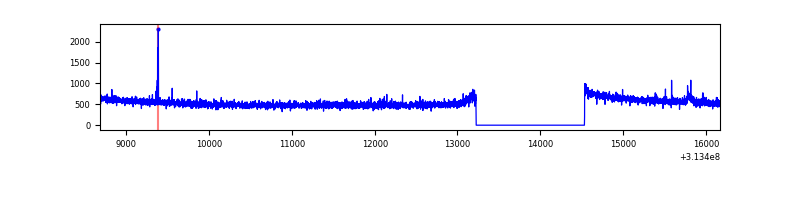 |
| D | 7488 | 6179 | 496 | 496 | 6.62% | 8.03% | 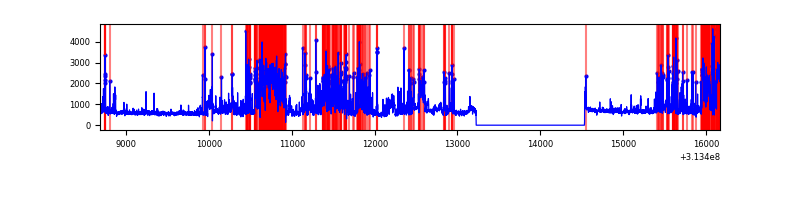 |
Top three noisy pixels from each quadrant. If the there are fewer than three noisy pixels in the level2.evt file, extra rows are filled as -1
| Pixel properties | Quadrant properties | ||||||
|---|---|---|---|---|---|---|---|
| Quadrant | DetID | PixID | Counts | Sigma | Mean | Median | Sigma |
| A | 13 | 254 | 11154 | 60.62 | 861 | 847 | 170.0 |
| A | 0 | 226 | 7711 | 40.37 | 861 | 847 | 170.0 |
| A | 12 | 194 | 6388 | 32.59 | 861 | 847 | 170.0 |
| B | 0 | 190 | 44326 | 284.63 | 844 | 828 | 152.8 |
| B | 0 | 229 | 35434 | 226.44 | 844 | 828 | 152.8 |
| B | 12 | 6 | 33234 | 212.05 | 844 | 828 | 152.8 |
| C | 14 | 238 | 132140 | 707.06 | 812 | 818 | 185.7 |
| C | 10 | 22 | 14650 | 74.47 | 812 | 818 | 185.7 |
| C | 8 | 222 | 10631 | 52.84 | 812 | 818 | 185.7 |
| D | 1 | 52 | 1419797 | 7244.09 | 816 | 794 | 195.9 |
| D | 15 | 0 | 547139 | 2789.12 | 816 | 794 | 195.9 |
| D | 12 | 227 | 296784 | 1511.04 | 816 | 794 | 195.9 |
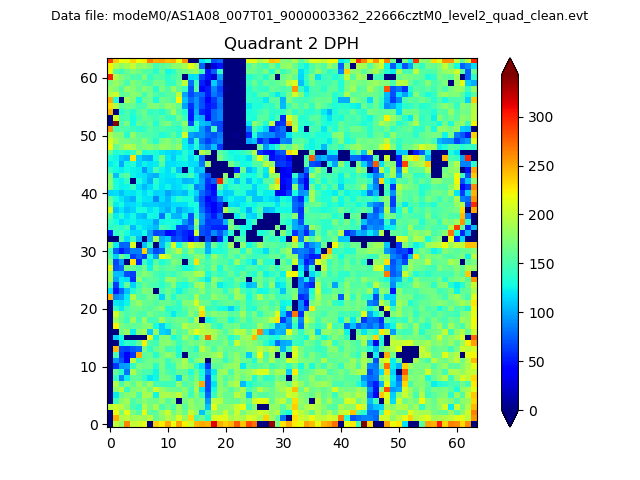
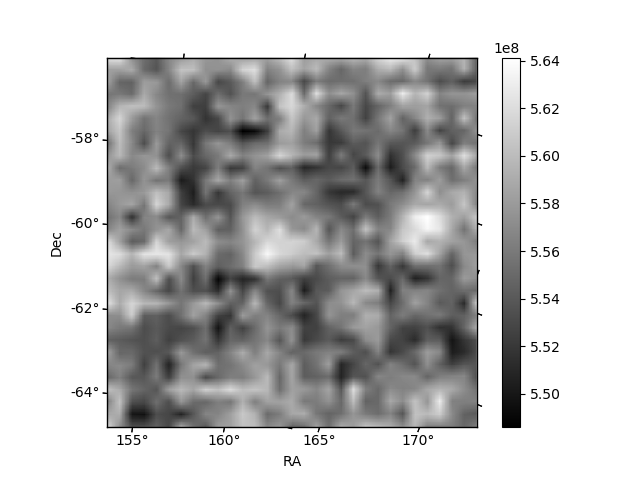
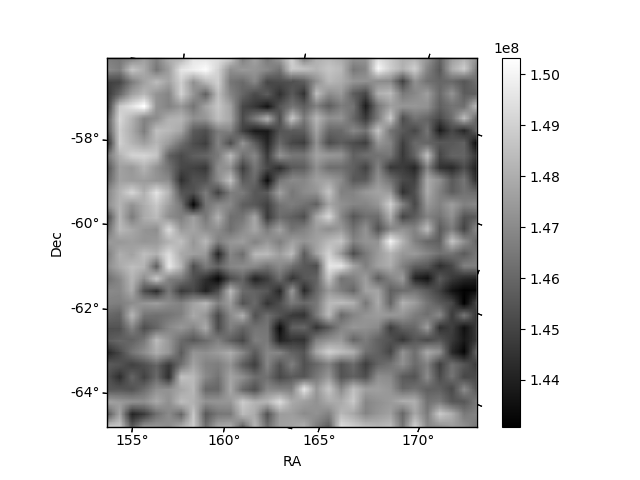
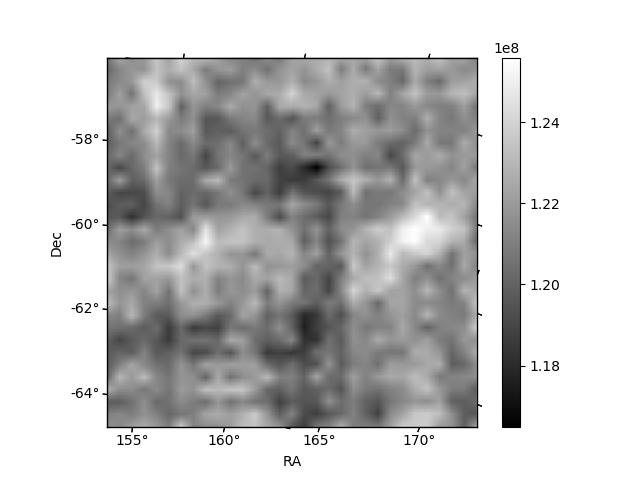
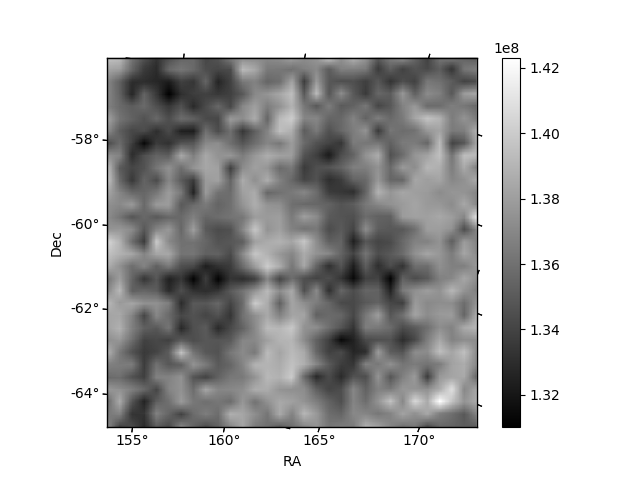
Histogram calculated using DETX and DETY for each event in the final _common_clean file
| Quadrant A | 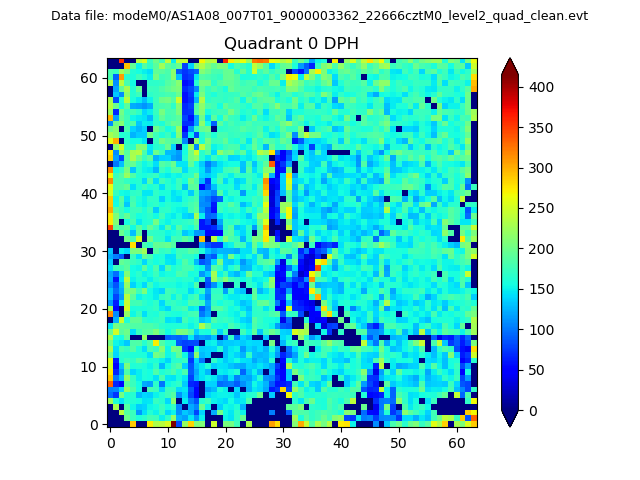 |
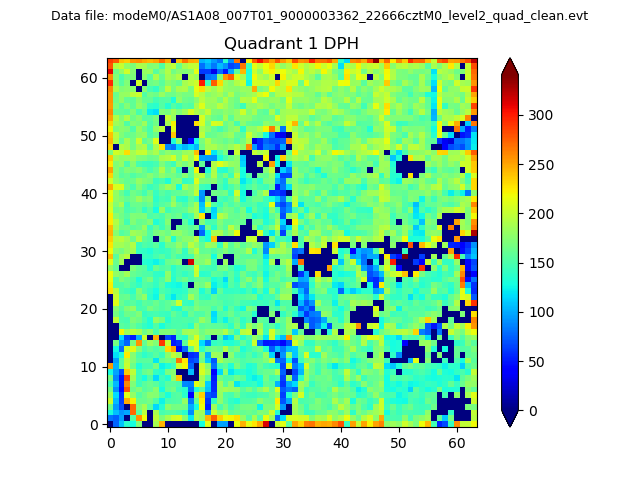 |
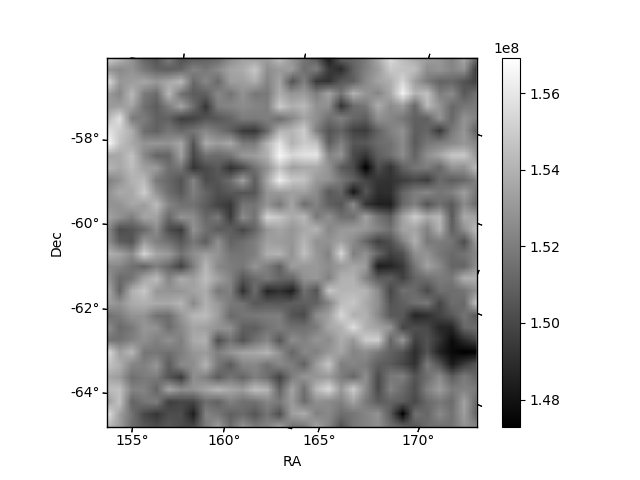
Quadrant B |
|---|---|---|---|
| Quadrant D | 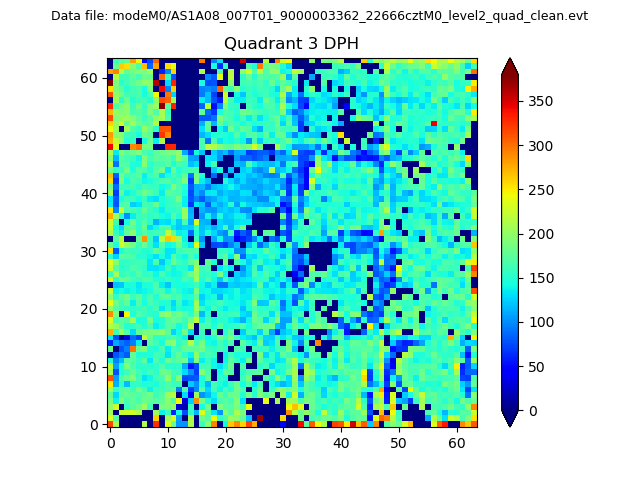 |
 |
Quadrant C |
| Plot type | Count rate plots | Images |
|---|---|---|
| Comparison with Poisson distribution Blue bars denote a histogram of data divided into 1 sec bins. Red curve is a Poisson curve with rate = median count rate of data. |
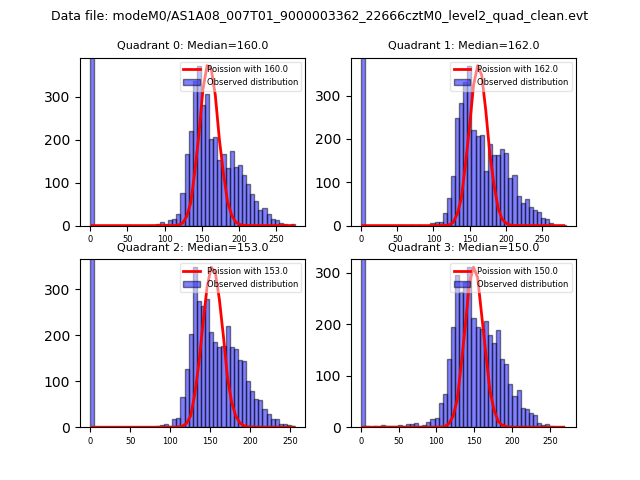 |
 |
| Quadrant-wise count rates Data is divided into 100 sec bins |
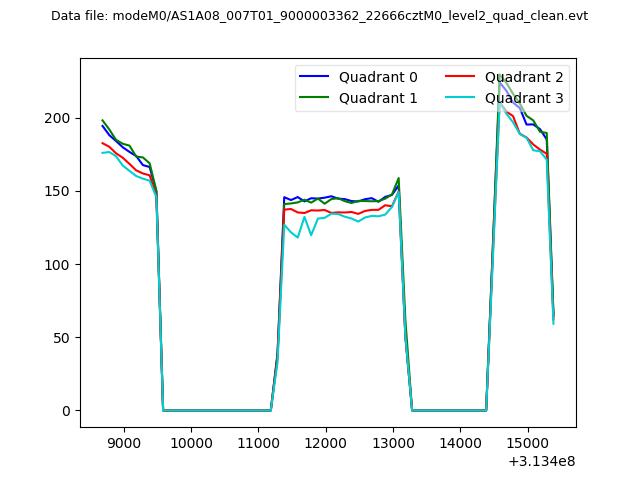 |
|
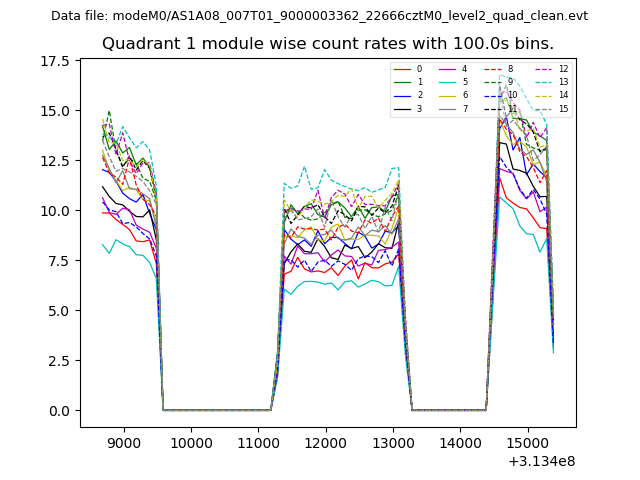
| Module-wise count rates for Quadrant A Data is divided into 100 sec bins |
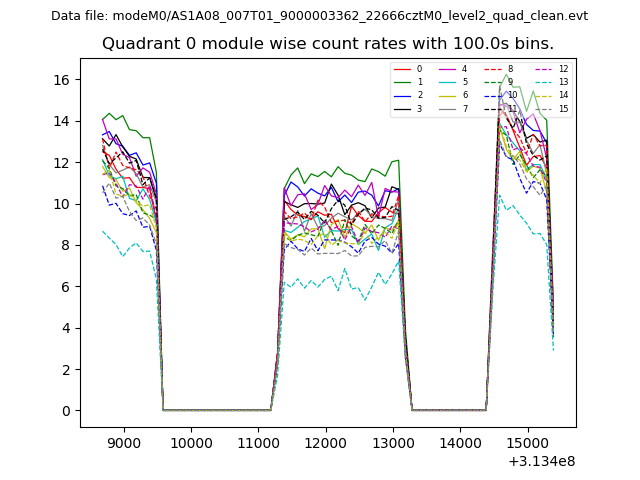 |
 |
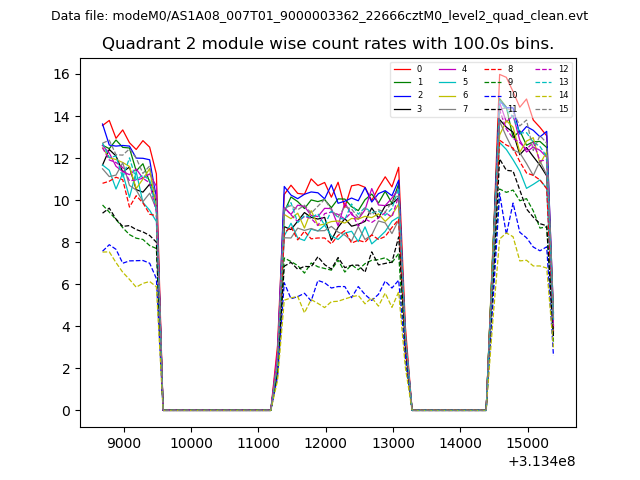
| Module-wise count rates for Quadrant B Data is divided into 100 sec bins |
 |
 |
| Module-wise count rates for Quadrant C Data is divided into 100 sec bins |
 |
 |
| Module-wise count rates for Quadrant D Data is divided into 100 sec bins |
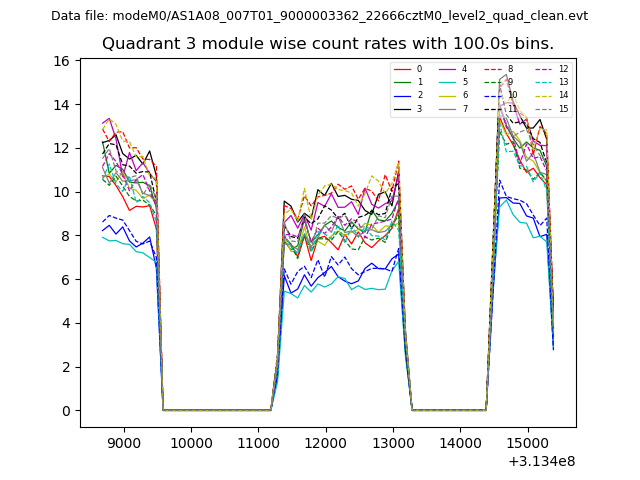 |
 |
| Parameter | Plot |
|---|---|
| CZT HV Monitor | 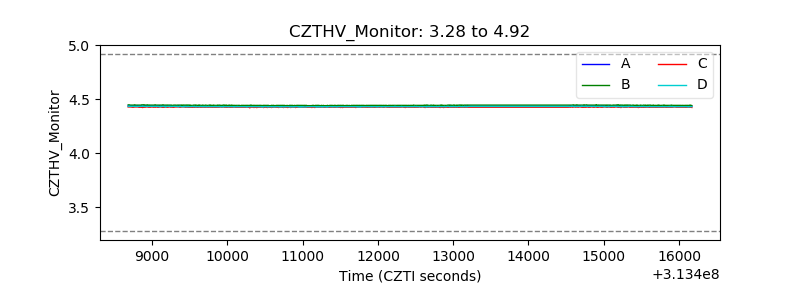 |
| D_VDD |  |
| Temperature 1 | 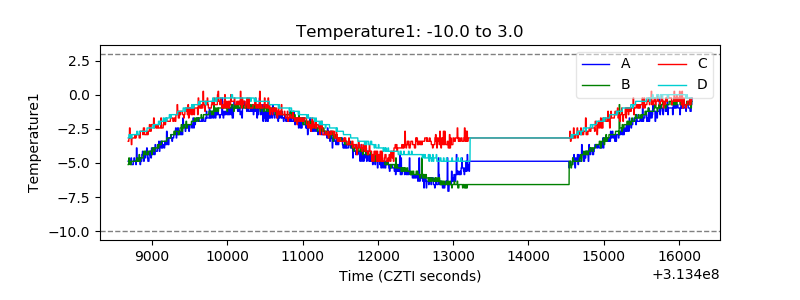 |
| Veto HV Monitor | 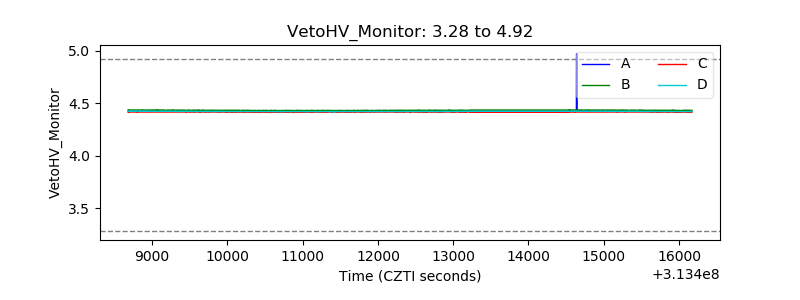 |
| Veto LLD | 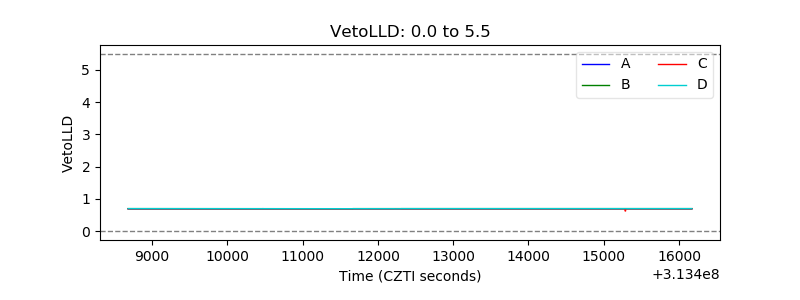 |
| Alpha Counter | 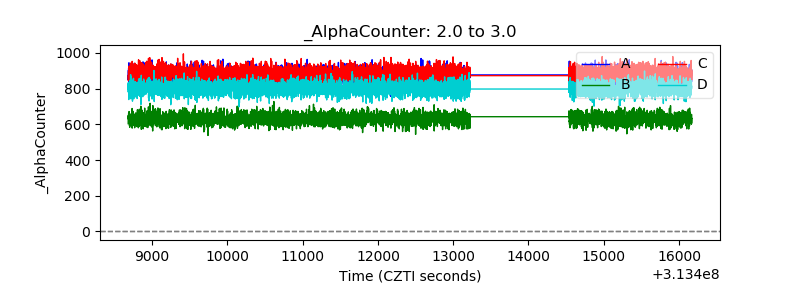 |
| _CPM_Rate | 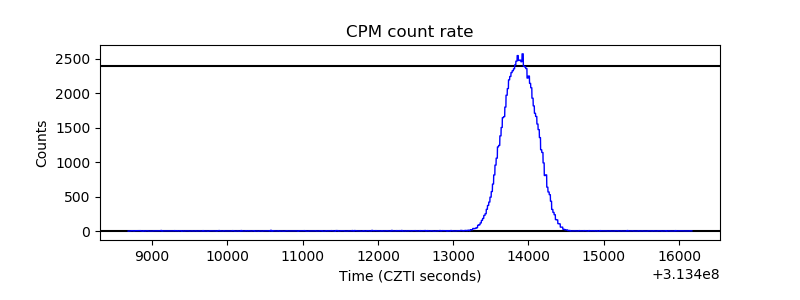 |
| CZT Counter | 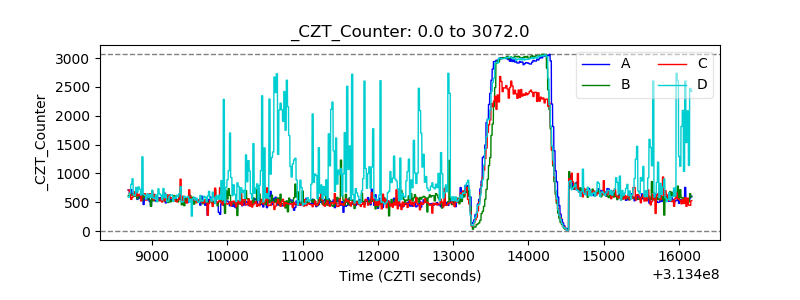 |
| +2.5 Volts monitor |  |
| +5 Volts monitor |  |
| _ROLL_ROT | 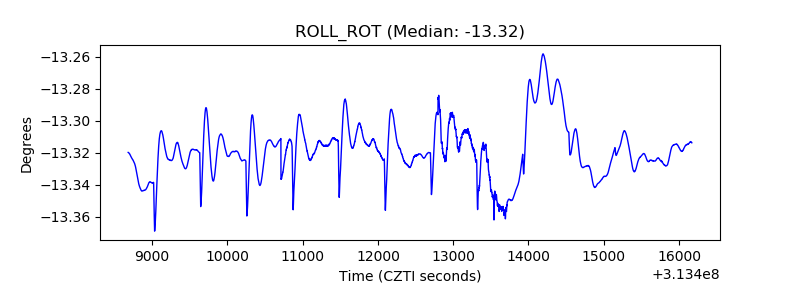 |
| _Roll_DEC | 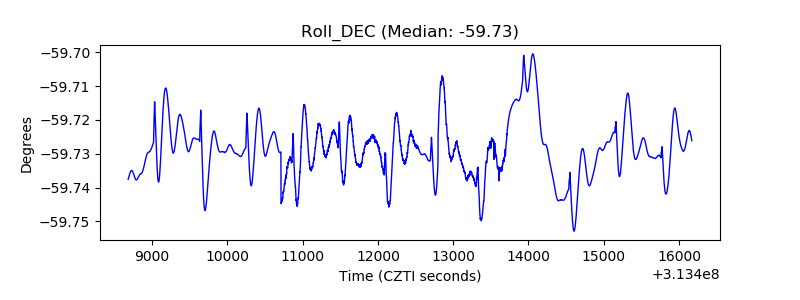 |
| _Roll_RA | 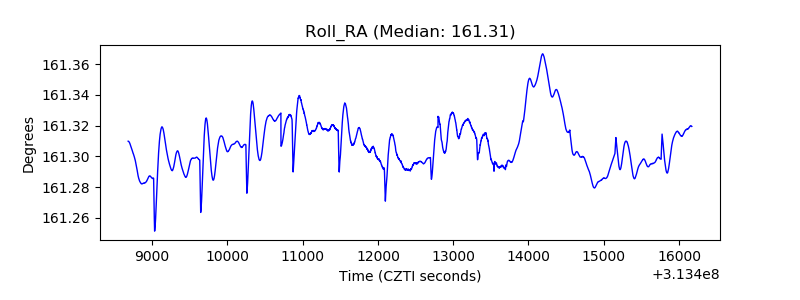 |
| Veto Counter | 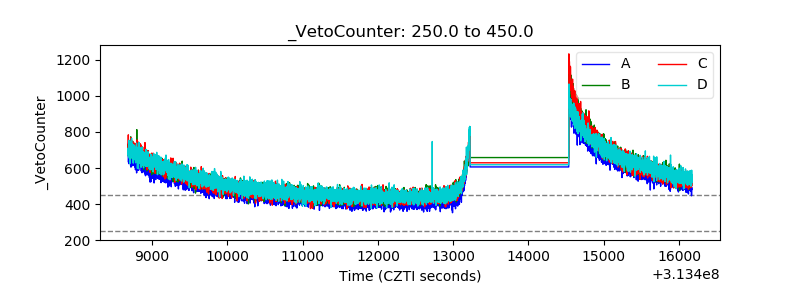 |