| Param | Original file | Final file |
|---|---|---|
| Filename | modeM0/AS1A08_007T01_9000003362_22667cztM0_level2.evt | modeM0/AS1A08_007T01_9000003362_22667cztM0_level2_quad_clean.evt |
| Size (bytes) | 547,346,880 | 84,205,440 |
| Size | 522.0 MB | 80.3 MB |
| Events in quadrant A | 3,381,266 | 548,769 |
| Events in quadrant B | 3,574,915 | 552,278 |
| Events in quadrant C | 3,353,517 | 515,034 |
| Events in quadrant D | 5,848,426 | 502,576 |
| Mode SS | |||
|---|---|---|---|
| Quadrant | BADHDUFLAG | Total packets | Discarded packets |
| A | 0 | 126 | 0 |
| B | 0 | 126 | 0 |
| C | 0 | 126 | 0 |
| D | 0 | 126 | 0 |
| Mode M0 | |||
|---|---|---|---|
| Quadrant | BADHDUFLAG | Total packets | Discarded packets |
| A | 0 | 13889 | 1 |
| B | 0 | 14613 | 1 |
| C | 0 | 13772 | 1 |
| D | 0 | 21910 | 1 |
| Mode M9 | |||
|---|---|---|---|
| Quadrant | BADHDUFLAG | Total packets | Discarded packets |
| A | 0 | 13 | 0 |
| B | 0 | 13 | 0 |
| C | 0 | 13 | 0 |
| D | 0 | 13 | 0 |
| Quadrant | Total seconds | Saturated seconds | Saturation percentage |
|---|---|---|---|
| A | 6175 | 101 | 1.635628% |
| B | 6176 | 106 | 1.716321% |
| C | 6176 | 136 | 2.202073% |
| D | 6176 | 589 | 9.536917% |
Noise dominated data is calculated using 1-second bins in cleaned event files. If a bin has >2000 counts, and if more than 50% of those come from <1% of pixels, then it is considered to be noise-dominated and hence unusable.
| Quadrant | # 1 sec bins | Bins with >0 counts | Bins with >2000 counts | High rate bins dominated by noise | Noise dominated (total time) | Noise dominated (detector-on time) | Marked lightcurve |
|---|---|---|---|---|---|---|---|
| A | 7505 | 6176 | 0 | 0 | 0.00% | 0.00% | 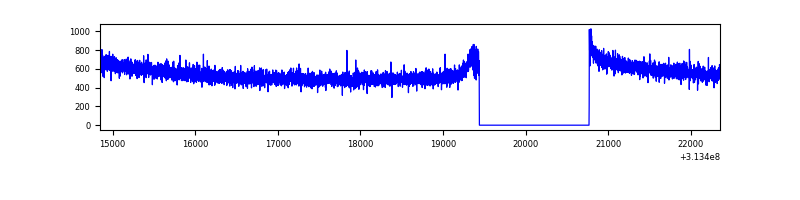 |
| B | 7506 | 6177 | 0 | 0 | 0.00% | 0.00% | 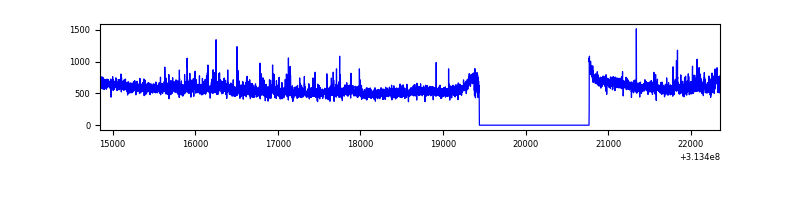 |
| C | 7506 | 6177 | 1 | 1 | 0.01% | 0.02% | 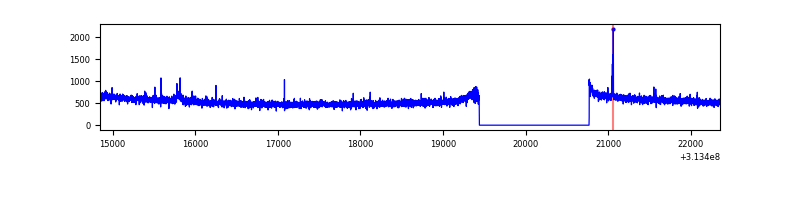 |
| D | 7506 | 6177 | 463 | 463 | 6.17% | 7.50% | 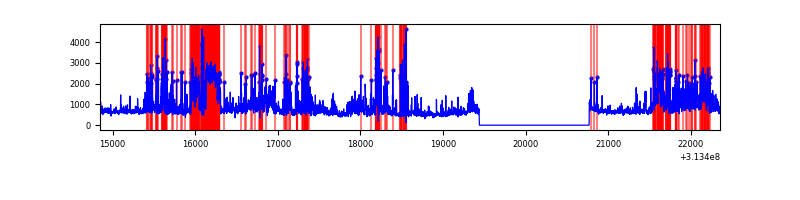 |
Top three noisy pixels from each quadrant. If the there are fewer than three noisy pixels in the level2.evt file, extra rows are filled as -1
| Pixel properties | Quadrant properties | ||||||
|---|---|---|---|---|---|---|---|
| Quadrant | DetID | PixID | Counts | Sigma | Mean | Median | Sigma |
| A | 13 | 254 | 11544 | 62.42 | 876 | 862 | 171.1 |
| A | 0 | 226 | 7914 | 41.21 | 876 | 862 | 171.1 |
| A | 12 | 194 | 6393 | 32.32 | 876 | 862 | 171.1 |
| B | 0 | 229 | 52917 | 331.62 | 861 | 843 | 157.0 |
| B | 0 | 190 | 51798 | 324.49 | 861 | 843 | 157.0 |
| B | 0 | 230 | 33284 | 206.59 | 861 | 843 | 157.0 |
| C | 14 | 238 | 132711 | 707.61 | 819 | 826 | 186.4 |
| C | 10 | 22 | 16285 | 82.94 | 819 | 826 | 186.4 |
| C | 8 | 222 | 10703 | 52.99 | 819 | 826 | 186.4 |
| D | 1 | 52 | 1335380 | 6741.74 | 825 | 805 | 198.0 |
| D | 15 | 0 | 611141 | 3083.17 | 825 | 805 | 198.0 |
| D | 12 | 227 | 498325 | 2513.27 | 825 | 805 | 198.0 |
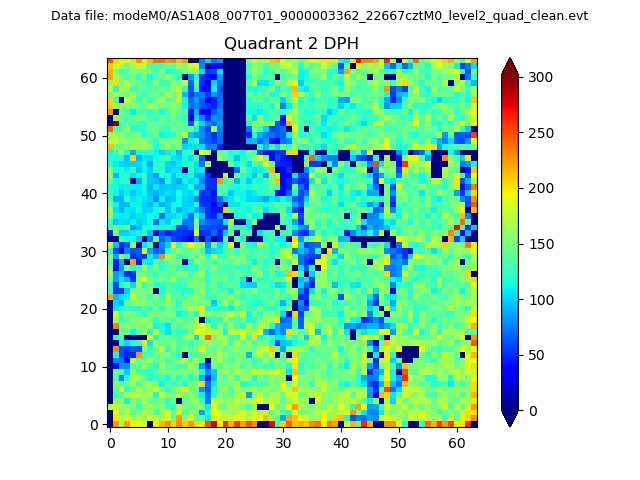
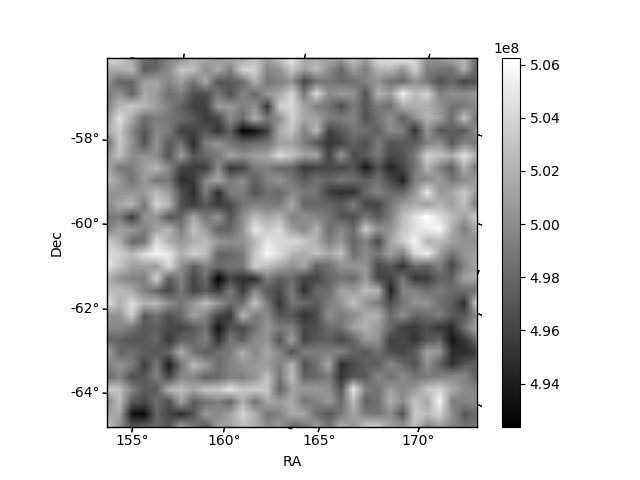
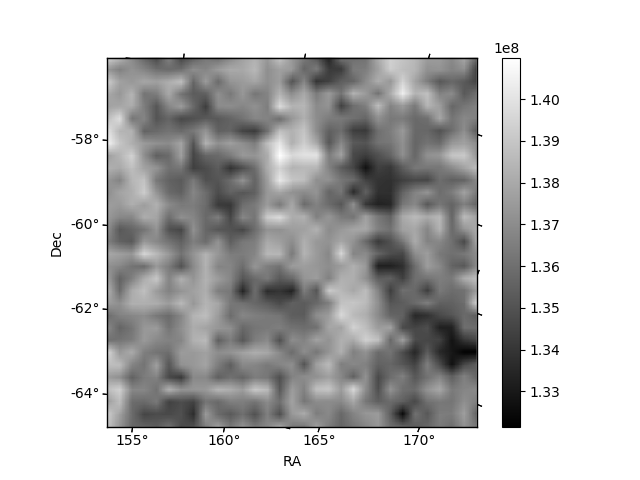
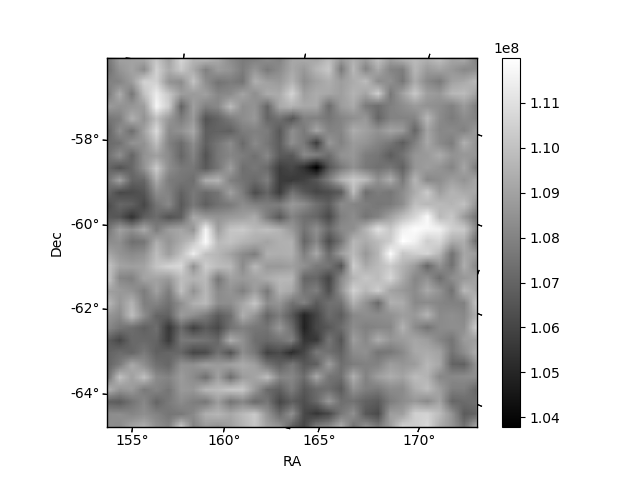
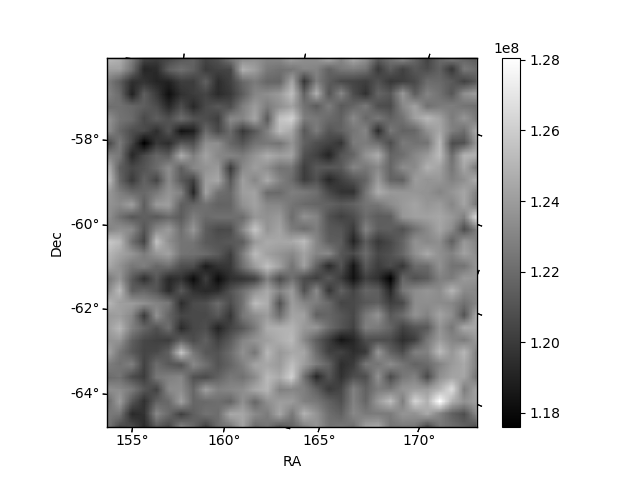
Histogram calculated using DETX and DETY for each event in the final _common_clean file
| Quadrant A | 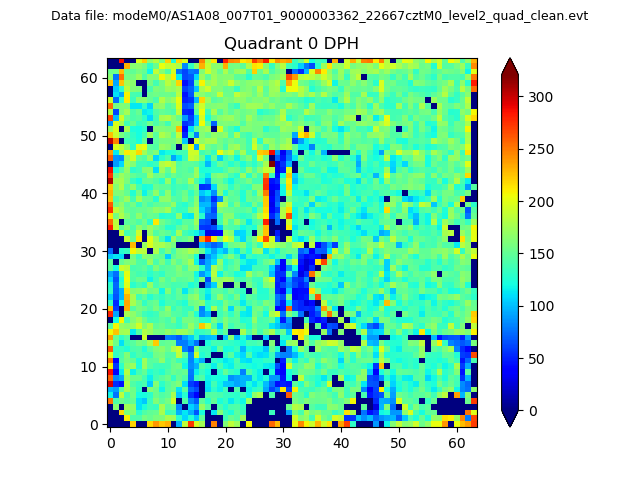 |
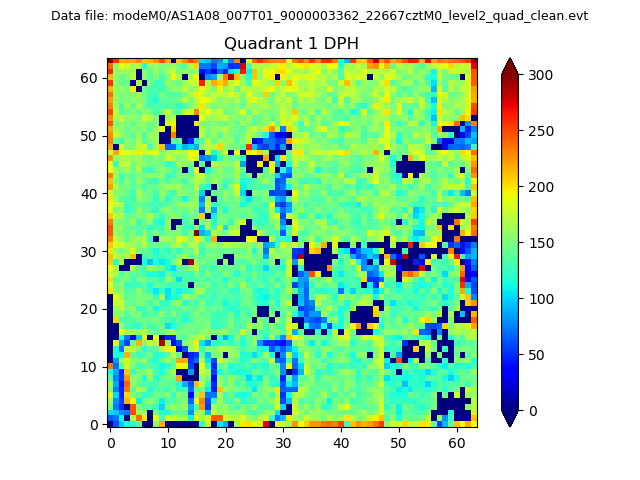 |
Quadrant B |
|---|---|---|---|
| Quadrant D | 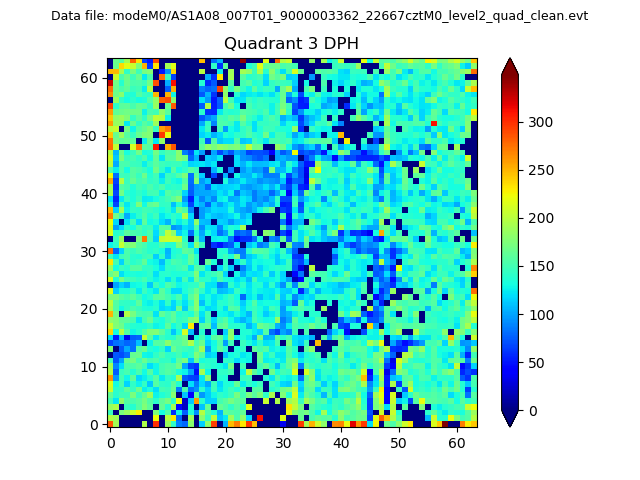 |
 |
Quadrant C |
| Plot type | Count rate plots | Images |
|---|---|---|
| Comparison with Poisson distribution Blue bars denote a histogram of data divided into 1 sec bins. Red curve is a Poisson curve with rate = median count rate of data. |
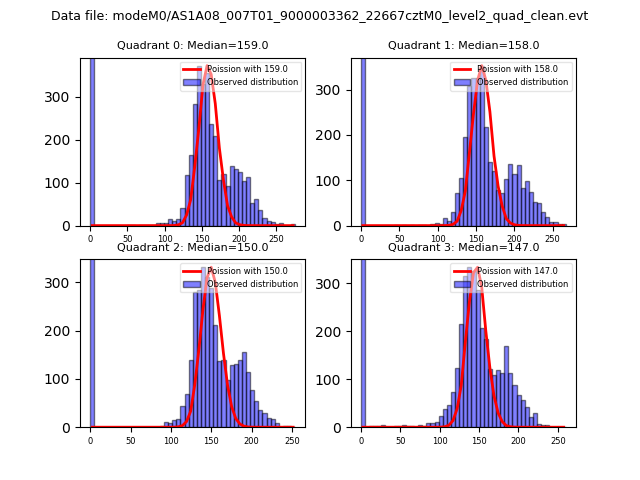 |
 |
| Quadrant-wise count rates Data is divided into 100 sec bins |
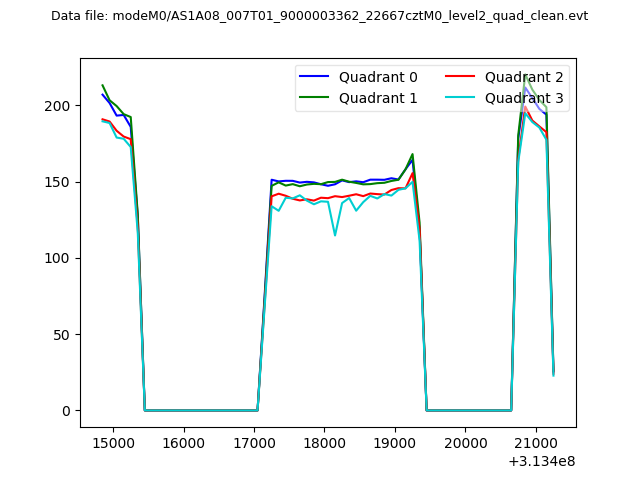 |
|
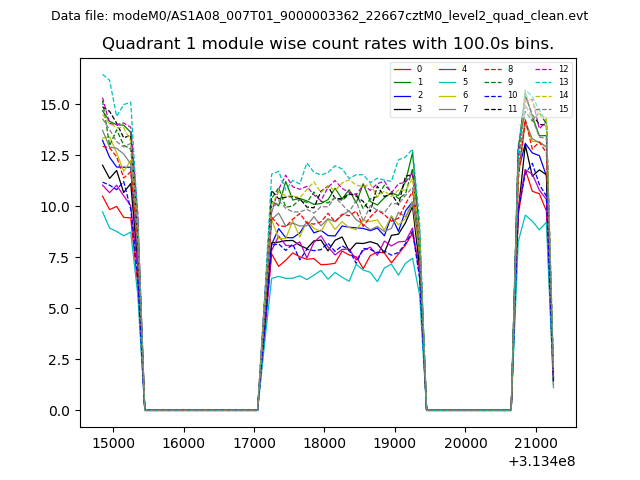
| Module-wise count rates for Quadrant A Data is divided into 100 sec bins |
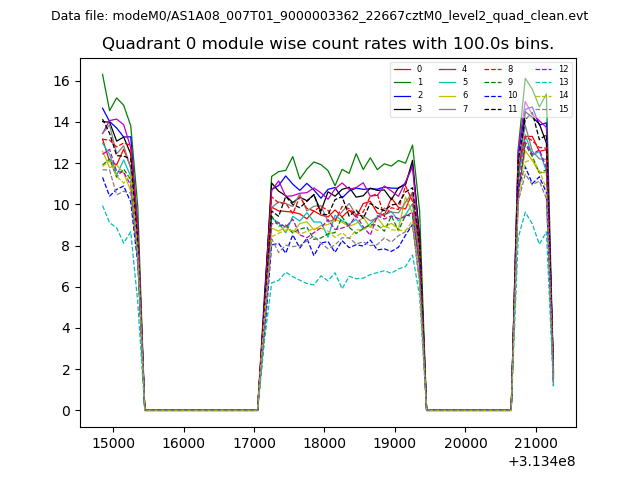 |
 |
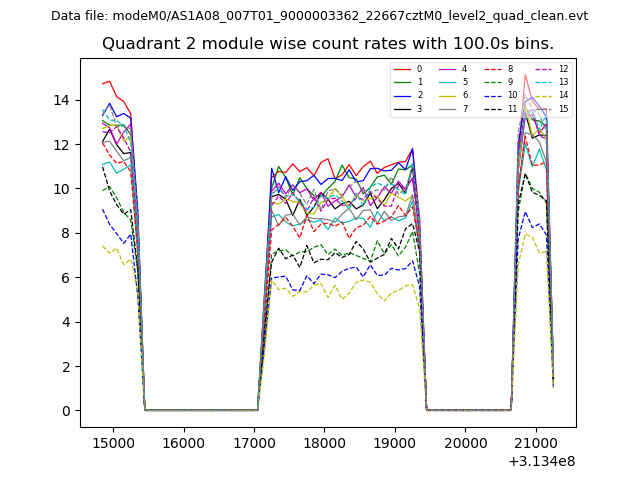
| Module-wise count rates for Quadrant B Data is divided into 100 sec bins |
 |
 |
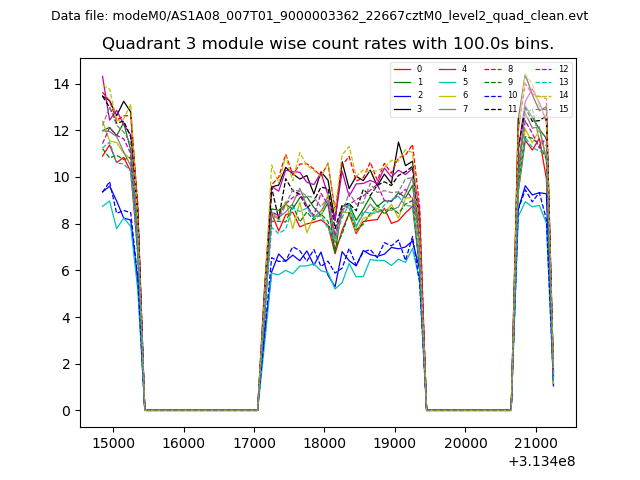
| Module-wise count rates for Quadrant C Data is divided into 100 sec bins |
 |
 |
| Module-wise count rates for Quadrant D Data is divided into 100 sec bins |
 |
 |
| Parameter | Plot |
|---|---|
| CZT HV Monitor | 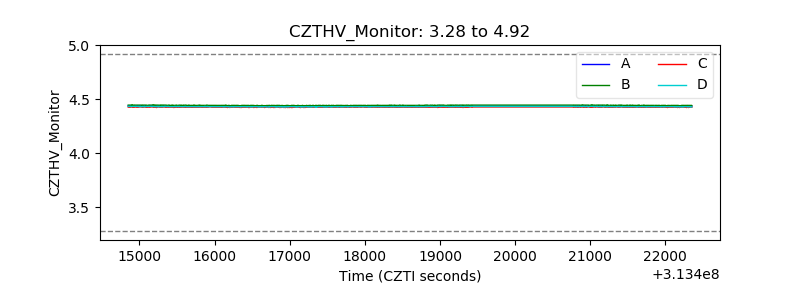 |
| D_VDD | 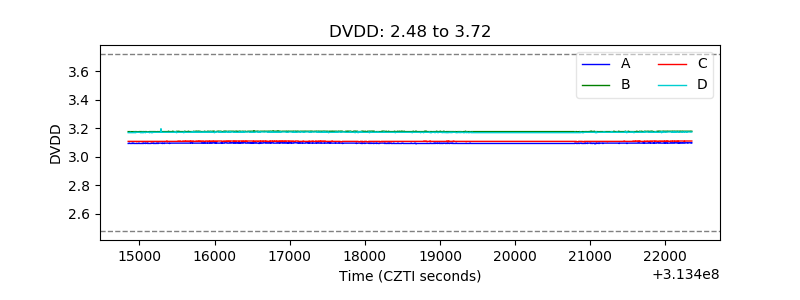 |
| Temperature 1 |  |
| Veto HV Monitor |  |
| Veto LLD | 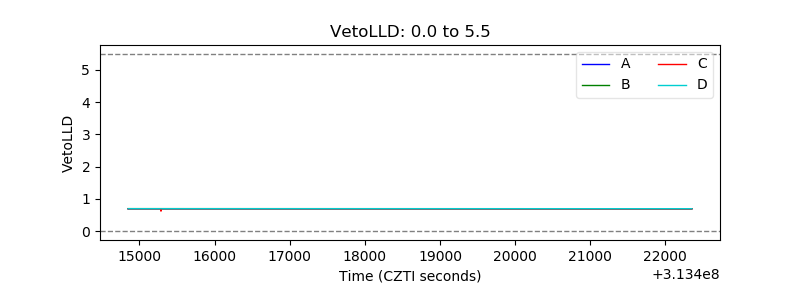 |
| Alpha Counter | 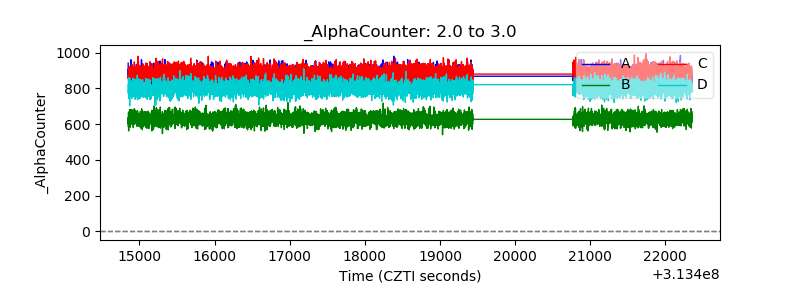 |
| _CPM_Rate | 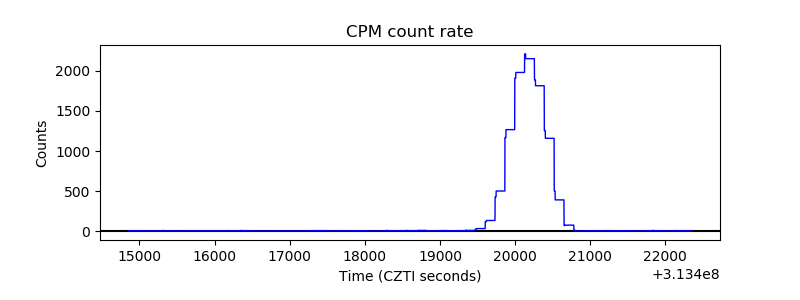 |
| CZT Counter | 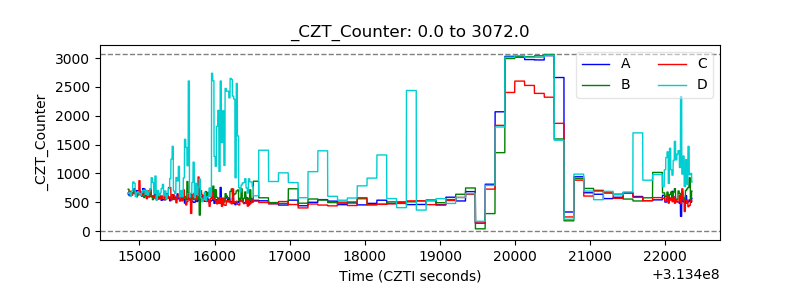 |
| +2.5 Volts monitor |  |
| +5 Volts monitor |  |
| _ROLL_ROT | 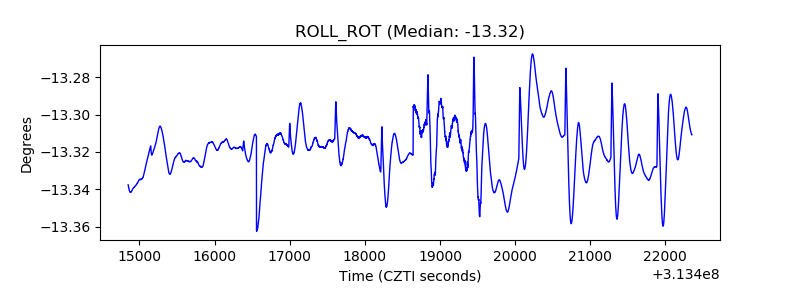 |
| _Roll_DEC |  |
| _Roll_RA | 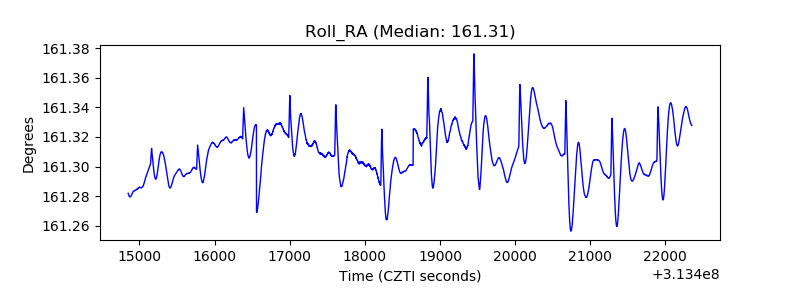 |
| Veto Counter | 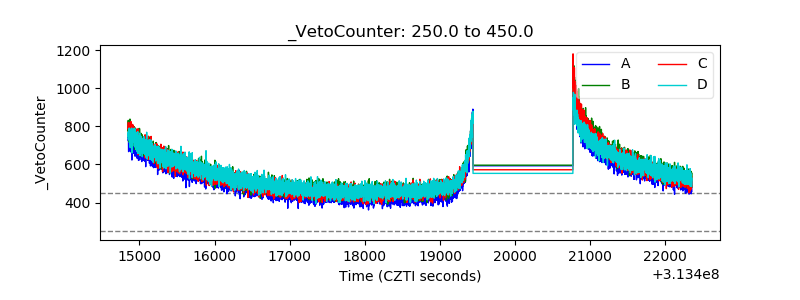 |