| Param | Original file | Final file |
|---|---|---|
| Filename | modeM0/AS1A08_007T01_9000003362_22668cztM0_level2.evt | modeM0/AS1A08_007T01_9000003362_22668cztM0_level2_quad_clean.evt |
| Size (bytes) | 567,138,240 | 72,259,200 |
| Size | 540.9 MB | 68.9 MB |
| Events in quadrant A | 3,292,835 | 455,665 |
| Events in quadrant B | 3,523,689 | 457,511 |
| Events in quadrant C | 3,262,420 | 427,785 |
| Events in quadrant D | 6,678,938 | 416,053 |
| Mode SS | |||
|---|---|---|---|
| Quadrant | BADHDUFLAG | Total packets | Discarded packets |
| A | 0 | 126 | 0 |
| B | 0 | 126 | 0 |
| C | 0 | 126 | 0 |
| D | 0 | 126 | 0 |
| Mode M0 | |||
|---|---|---|---|
| Quadrant | BADHDUFLAG | Total packets | Discarded packets |
| A | 0 | 13476 | 1 |
| B | 0 | 14487 | 1 |
| C | 0 | 13312 | 1 |
| D | 0 | 24167 | 4 |
| Mode M9 | |||
|---|---|---|---|
| Quadrant | BADHDUFLAG | Total packets | Discarded packets |
| A | 0 | 13 | 0 |
| B | 0 | 13 | 0 |
| C | 0 | 13 | 0 |
| D | 0 | 13 | 0 |
| Quadrant | Total seconds | Saturated seconds | Saturation percentage |
|---|---|---|---|
| A | 6168 | 110 | 1.783398% |
| B | 6169 | 141 | 2.285622% |
| C | 6169 | 155 | 2.512563% |
| D | 6168 | 868 | 14.072633% |
Noise dominated data is calculated using 1-second bins in cleaned event files. If a bin has >2000 counts, and if more than 50% of those come from <1% of pixels, then it is considered to be noise-dominated and hence unusable.
| Quadrant | # 1 sec bins | Bins with >0 counts | Bins with >2000 counts | High rate bins dominated by noise | Noise dominated (total time) | Noise dominated (detector-on time) | Marked lightcurve |
|---|---|---|---|---|---|---|---|
| A | 7468 | 6169 | 0 | 0 | 0.00% | 0.00% | 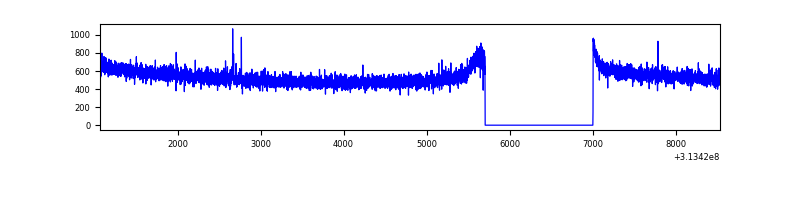 |
| B | 7469 | 6170 | 3 | 3 | 0.04% | 0.05% | 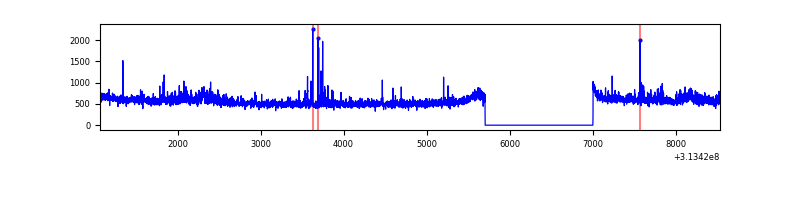 |
| C | 7469 | 6170 | 1 | 1 | 0.01% | 0.02% | 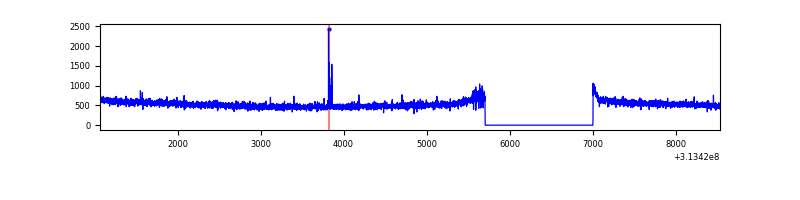 |
| D | 7468 | 6169 | 658 | 658 | 8.81% | 10.67% | 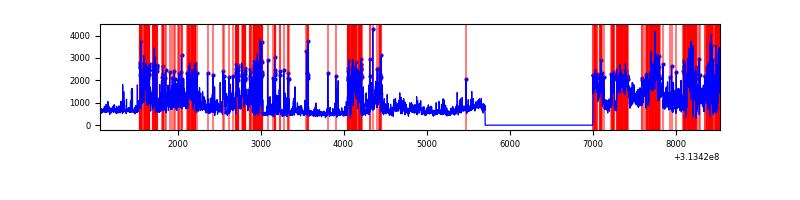 |
Top three noisy pixels from each quadrant. If the there are fewer than three noisy pixels in the level2.evt file, extra rows are filled as -1
| Pixel properties | Quadrant properties | ||||||
|---|---|---|---|---|---|---|---|
| Quadrant | DetID | PixID | Counts | Sigma | Mean | Median | Sigma |
| A | 13 | 254 | 11776 | 65.3 | 851 | 836 | 167.5 |
| A | 0 | 226 | 7538 | 40.01 | 851 | 836 | 167.5 |
| A | 12 | 194 | 6334 | 32.82 | 851 | 836 | 167.5 |
| B | 0 | 230 | 66081 | 426.42 | 842 | 825 | 153.0 |
| B | 0 | 229 | 40127 | 256.82 | 842 | 825 | 153.0 |
| B | 0 | 190 | 36897 | 235.72 | 842 | 825 | 153.0 |
| C | 14 | 238 | 129403 | 702.94 | 796 | 803 | 182.9 |
| C | 0 | 239 | 17736 | 92.56 | 796 | 803 | 182.9 |
| C | 10 | 22 | 11396 | 57.9 | 796 | 803 | 182.9 |
| D | 1 | 52 | 2623085 | 13783.79 | 788 | 768 | 190.2 |
| D | 12 | 227 | 580575 | 3047.66 | 788 | 768 | 190.2 |
| D | 12 | 233 | 186578 | 976.68 | 788 | 768 | 190.2 |
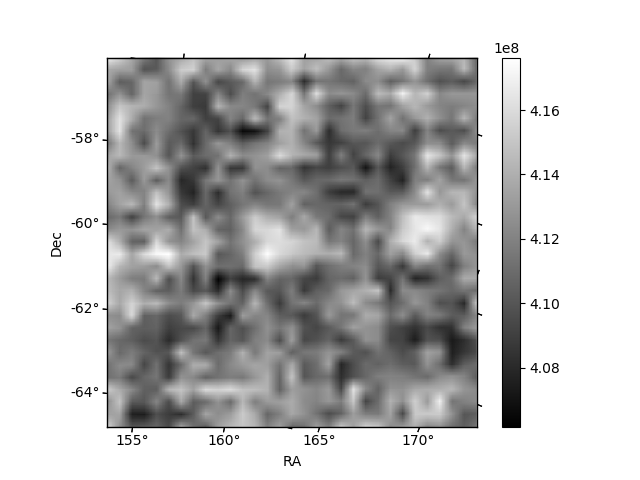
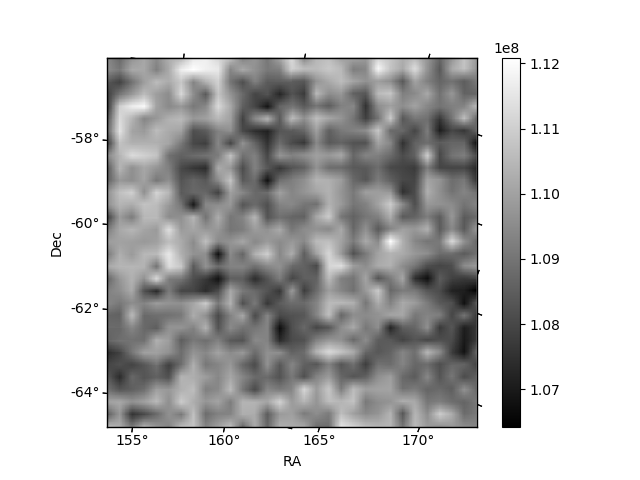
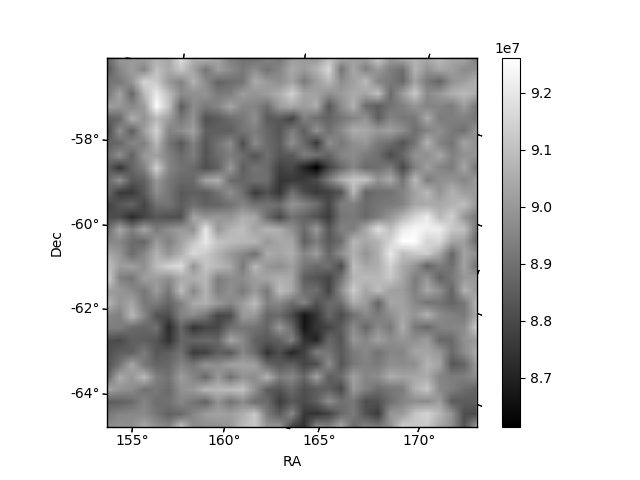
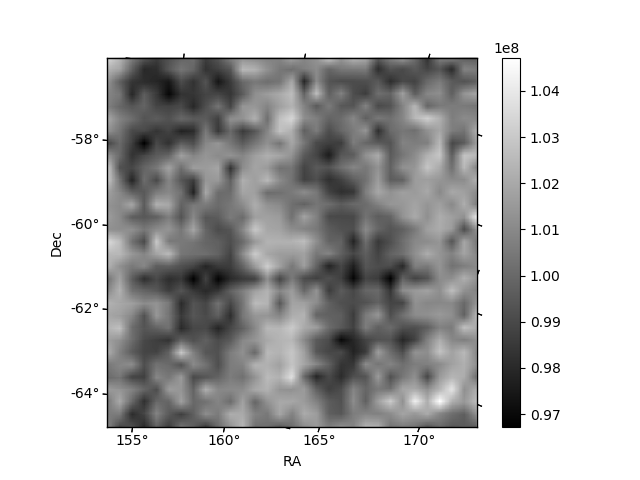
Histogram calculated using DETX and DETY for each event in the final _common_clean file
| Quadrant A | 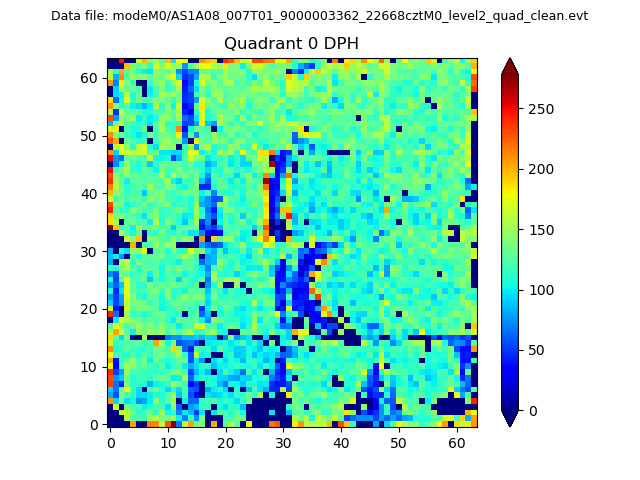 |
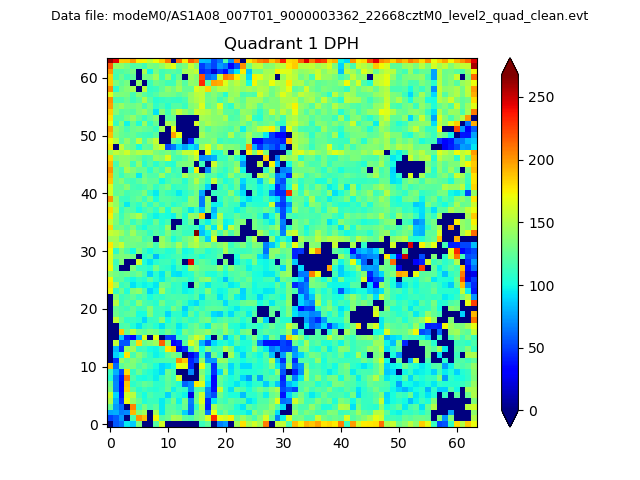 |
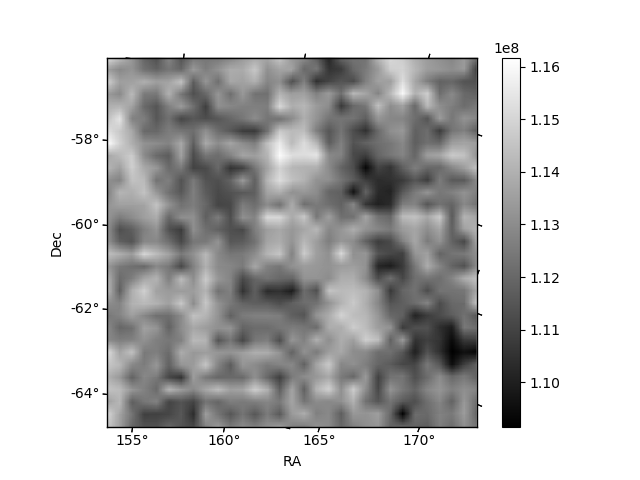
Quadrant B |
|---|---|---|---|
| Quadrant D | 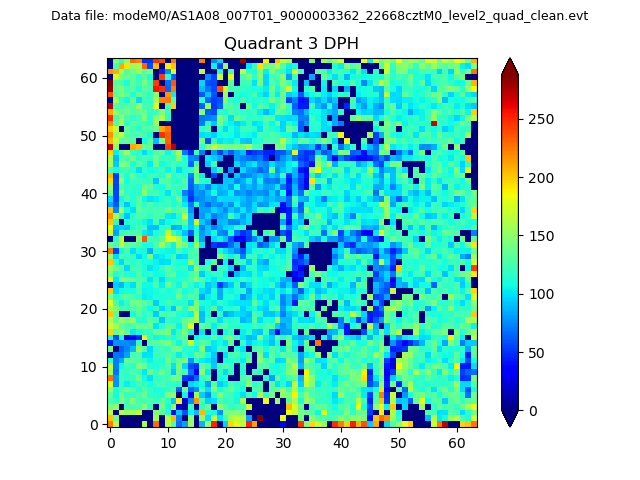 |
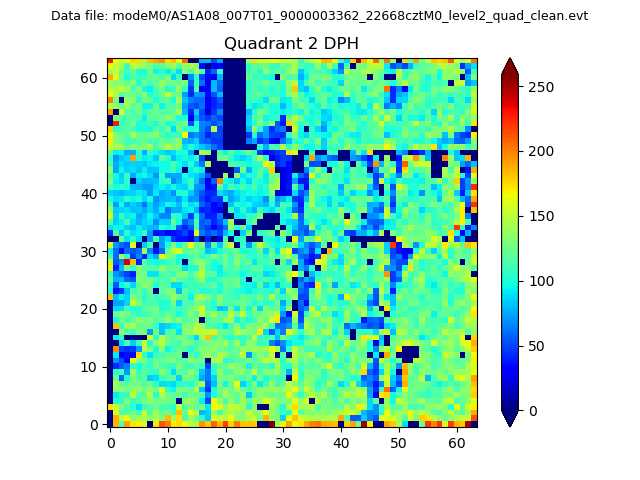 |
Quadrant C |
| Plot type | Count rate plots | Images |
|---|---|---|
| Comparison with Poisson distribution Blue bars denote a histogram of data divided into 1 sec bins. Red curve is a Poisson curve with rate = median count rate of data. |
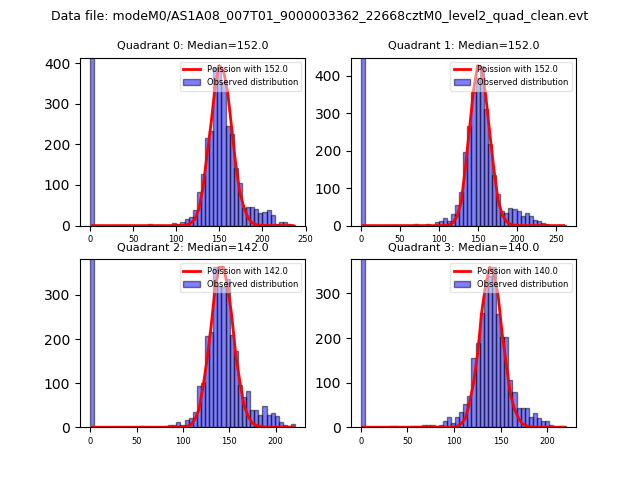 |
 |
| Quadrant-wise count rates Data is divided into 100 sec bins |
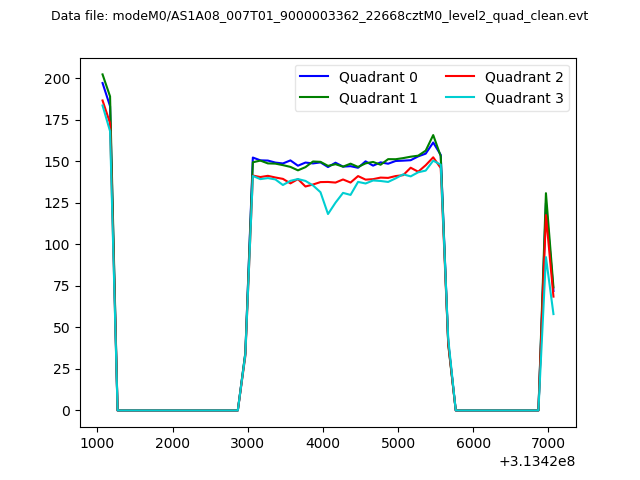 |
|
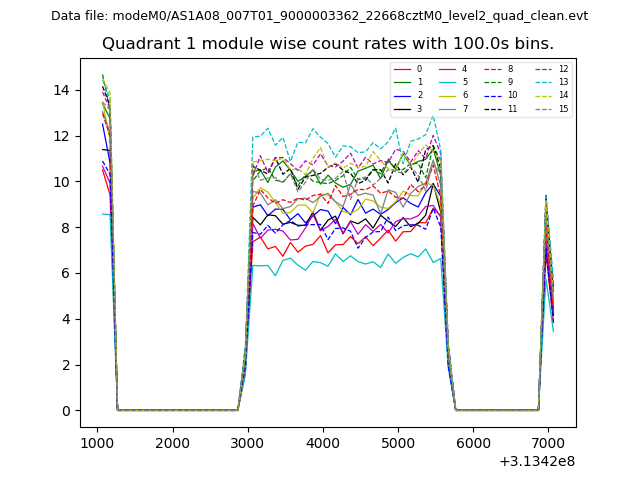
| Module-wise count rates for Quadrant A Data is divided into 100 sec bins |
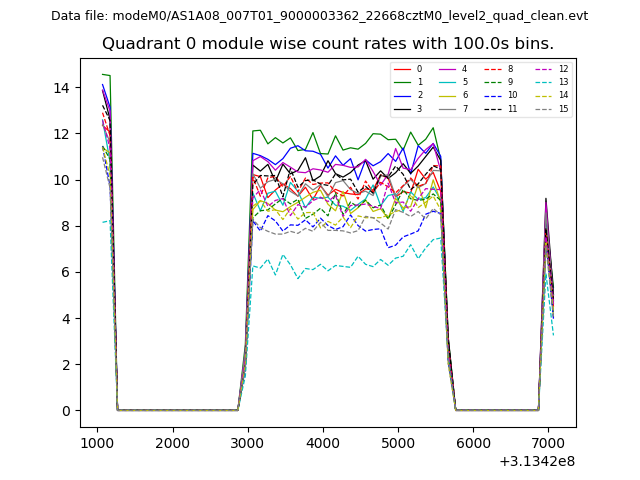 |
 |
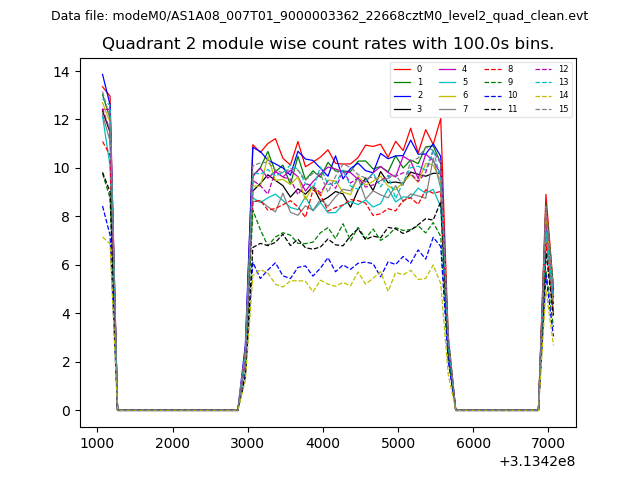
| Module-wise count rates for Quadrant B Data is divided into 100 sec bins |
 |
 |
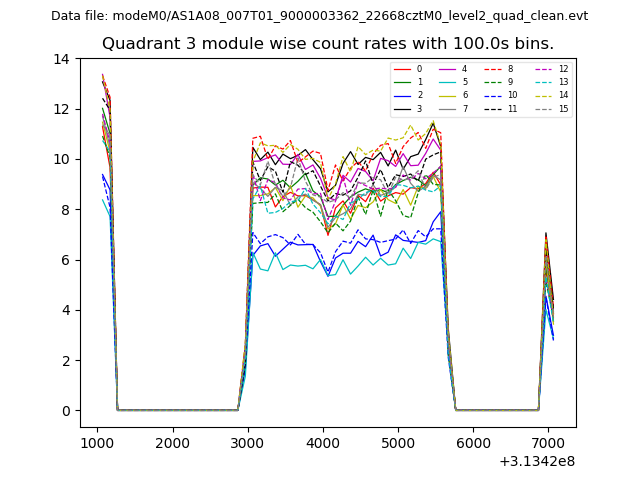
| Module-wise count rates for Quadrant C Data is divided into 100 sec bins |
 |
 |
| Module-wise count rates for Quadrant D Data is divided into 100 sec bins |
 |
 |
| Parameter | Plot |
|---|---|
| CZT HV Monitor | 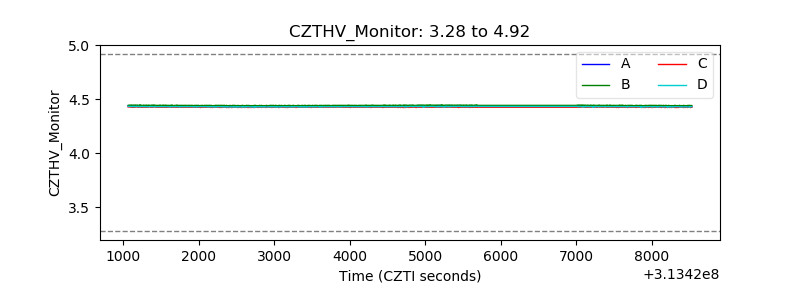 |
| D_VDD | 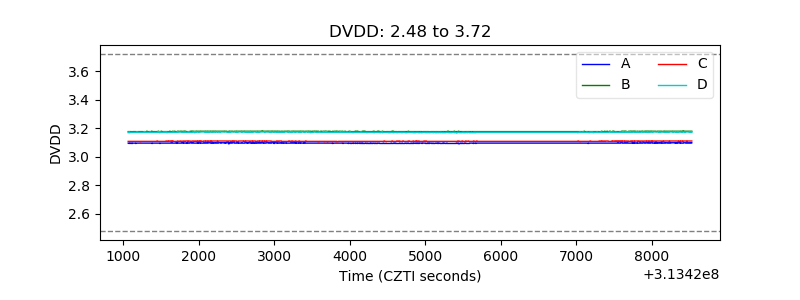 |
| Temperature 1 | 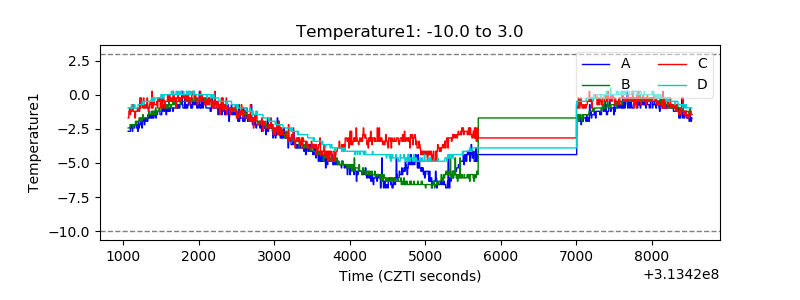 |
| Veto HV Monitor | 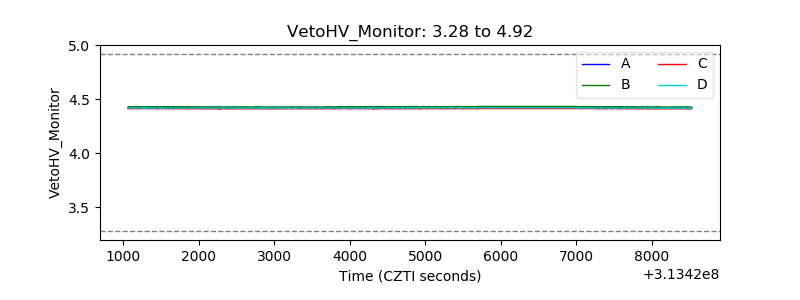 |
| Veto LLD | 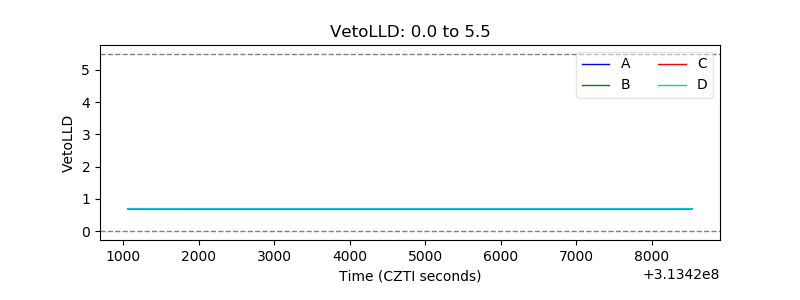 |
| Alpha Counter | 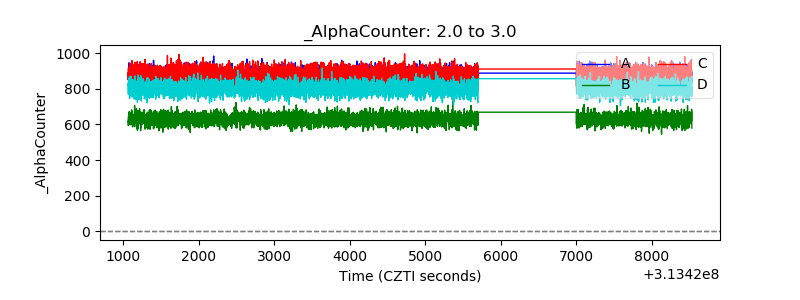 |
| _CPM_Rate | 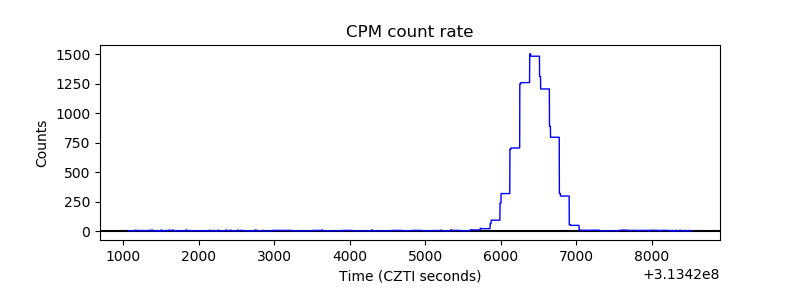 |
| CZT Counter | 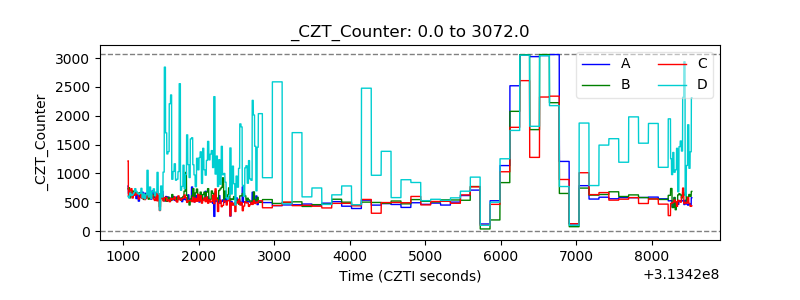 |
| +2.5 Volts monitor | 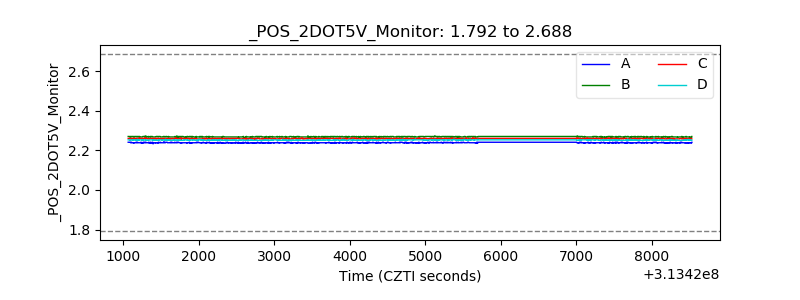 |
| +5 Volts monitor | 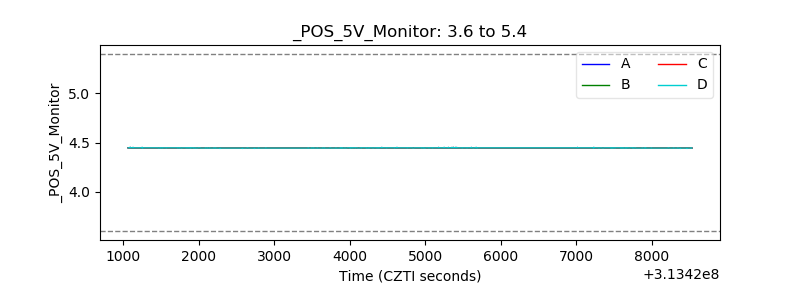 |
| _ROLL_ROT | 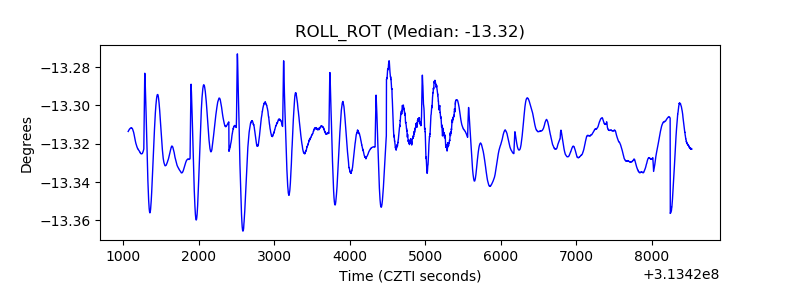 |
| _Roll_DEC | 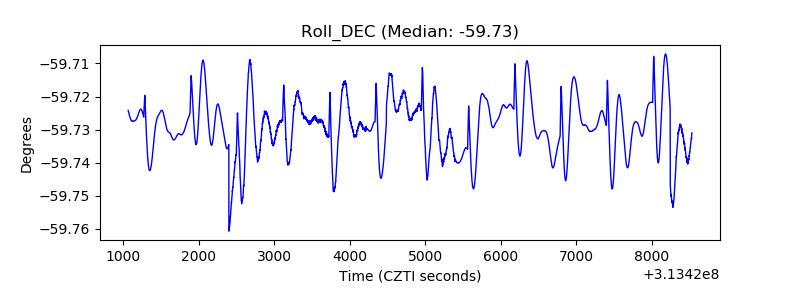 |
| _Roll_RA | 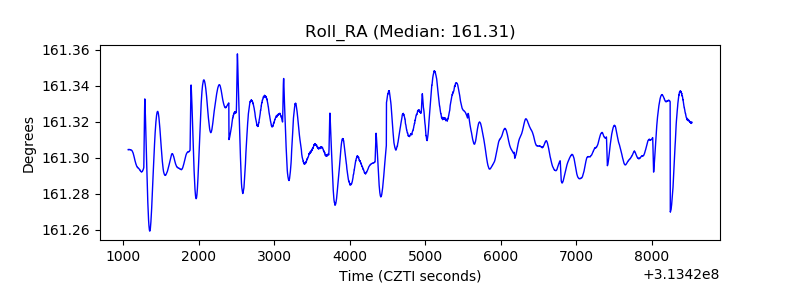 |
| Veto Counter | 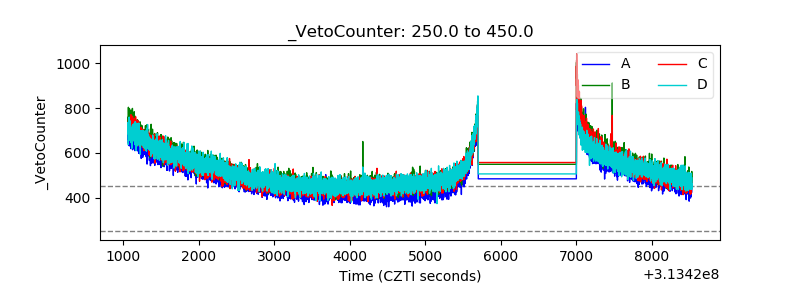 |