| Param | Original file | Final file |
|---|---|---|
| Filename | modeM0/AS1A08_007T01_9000003362_22670cztM0_level2.evt | modeM0/AS1A08_007T01_9000003362_22670cztM0_level2_quad_clean.evt |
| Size (bytes) | 474,914,880 | 87,200,640 |
| Size | 452.9 MB | 83.2 MB |
| Events in quadrant A | 3,014,418 | 565,930 |
| Events in quadrant B | 3,288,225 | 567,523 |
| Events in quadrant C | 3,025,683 | 540,145 |
| Events in quadrant D | 4,628,960 | 530,045 |
| Mode SS | |||
|---|---|---|---|
| Quadrant | BADHDUFLAG | Total packets | Discarded packets |
| A | 0 | 128 | 0 |
| B | 0 | 128 | 0 |
| C | 0 | 128 | 0 |
| D | 0 | 128 | 0 |
| Mode M0 | |||
|---|---|---|---|
| Quadrant | BADHDUFLAG | Total packets | Discarded packets |
| A | 0 | 12882 | 1 |
| B | 0 | 13693 | 1 |
| C | 0 | 12915 | 1 |
| D | 0 | 17868 | 1 |
| Mode M9 | |||
|---|---|---|---|
| Quadrant | BADHDUFLAG | Total packets | Discarded packets |
| A | 0 | 7 | 0 |
| B | 0 | 7 | 0 |
| C | 0 | 7 | 0 |
| D | 0 | 7 | 0 |
| Quadrant | Total seconds | Saturated seconds | Saturation percentage |
|---|---|---|---|
| A | 6258 | 95 | 1.518057% |
| B | 6259 | 119 | 1.901262% |
| C | 6259 | 106 | 1.693561% |
| D | 6259 | 535 | 8.547691% |
Noise dominated data is calculated using 1-second bins in cleaned event files. If a bin has >2000 counts, and if more than 50% of those come from <1% of pixels, then it is considered to be noise-dominated and hence unusable.
| Quadrant | # 1 sec bins | Bins with >0 counts | Bins with >2000 counts | High rate bins dominated by noise | Noise dominated (total time) | Noise dominated (detector-on time) | Marked lightcurve |
|---|---|---|---|---|---|---|---|
| A | 6998 | 6259 | 0 | 0 | 0.00% | 0.00% | 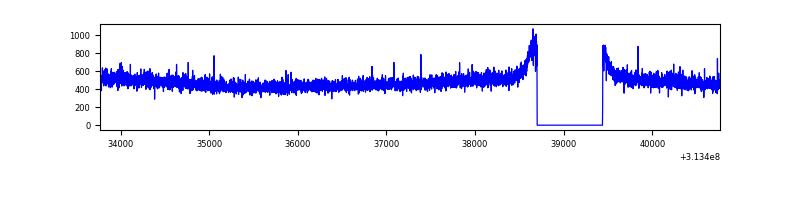 |
| B | 6999 | 6260 | 0 | 0 | 0.00% | 0.00% | 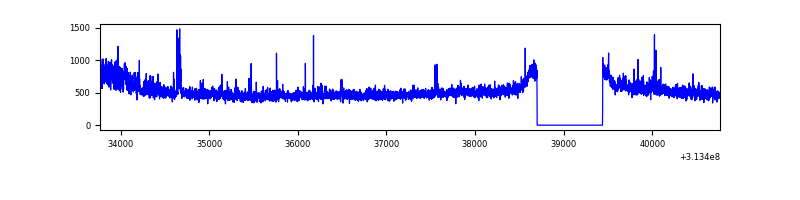 |
| C | 6999 | 6260 | 1 | 1 | 0.01% | 0.02% | 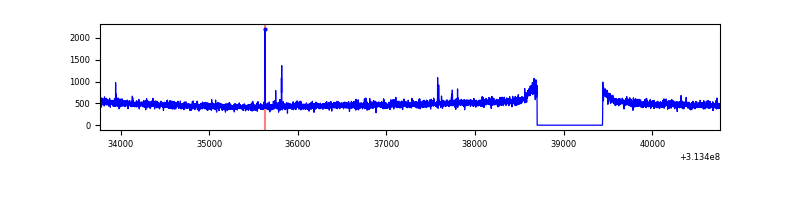 |
| D | 6999 | 6260 | 381 | 381 | 5.44% | 6.09% | 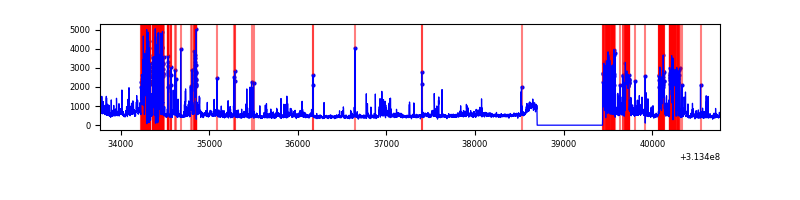 |
Top three noisy pixels from each quadrant. If the there are fewer than three noisy pixels in the level2.evt file, extra rows are filled as -1
| Pixel properties | Quadrant properties | ||||||
|---|---|---|---|---|---|---|---|
| Quadrant | DetID | PixID | Counts | Sigma | Mean | Median | Sigma |
| A | 13 | 254 | 11808 | 70.41 | 781 | 765 | 156.8 |
| A | 0 | 226 | 6902 | 39.13 | 781 | 765 | 156.8 |
| A | 3 | 137 | 6176 | 34.5 | 781 | 765 | 156.8 |
| B | 0 | 230 | 85066 | 582.38 | 776 | 759 | 144.8 |
| B | 0 | 219 | 58409 | 398.24 | 776 | 759 | 144.8 |
| B | 0 | 229 | 39295 | 266.2 | 776 | 759 | 144.8 |
| C | 14 | 238 | 117729 | 683.75 | 740 | 744 | 171.1 |
| C | 10 | 22 | 16556 | 92.42 | 740 | 744 | 171.1 |
| C | 13 | 61 | 5199 | 26.04 | 740 | 744 | 171.1 |
| D | 1 | 52 | 1002873 | 5723.73 | 726 | 708 | 175.1 |
| D | 5 | 32 | 329994 | 1880.67 | 726 | 708 | 175.1 |
| D | 12 | 227 | 216143 | 1230.43 | 726 | 708 | 175.1 |
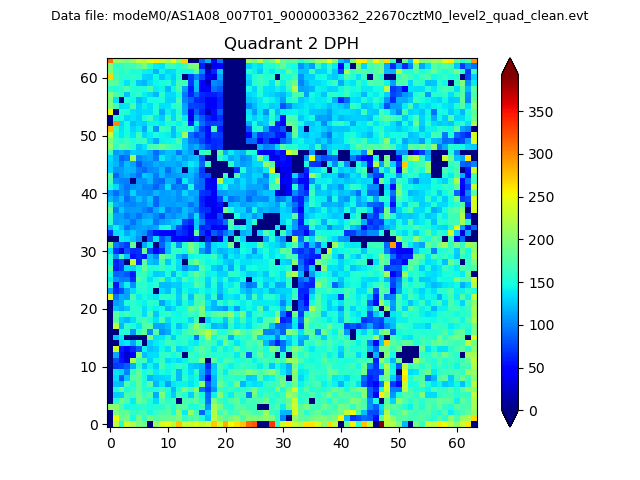
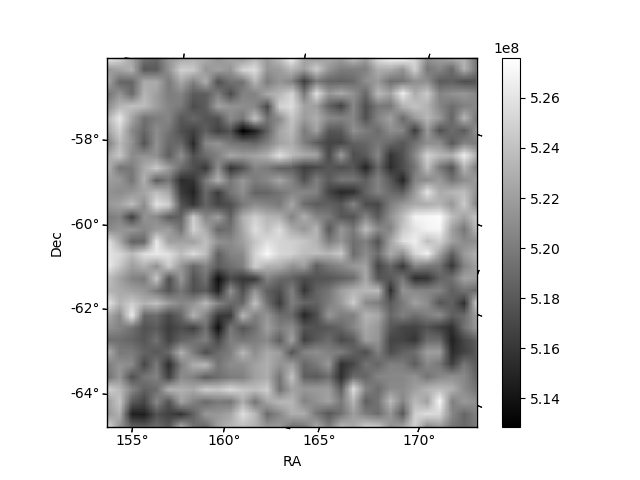
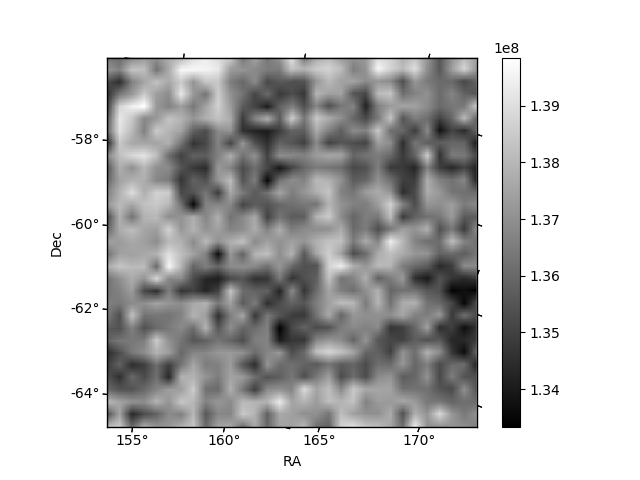
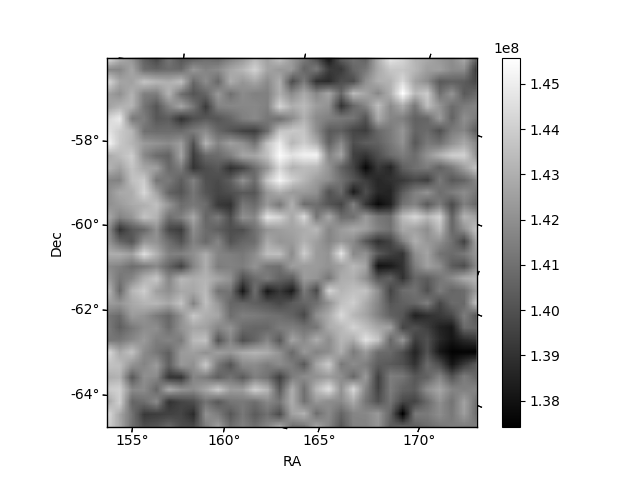
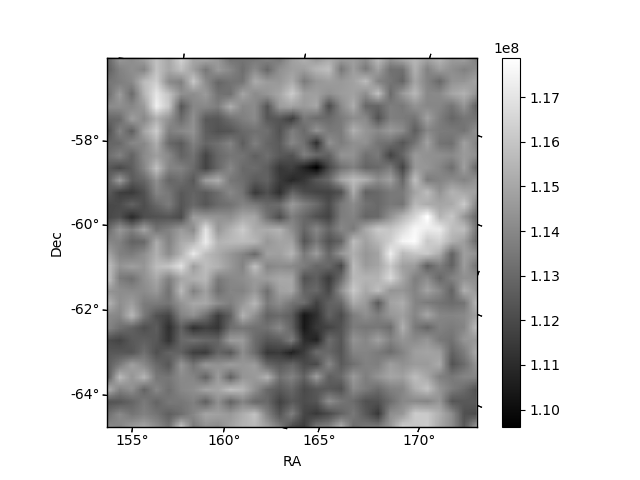
Histogram calculated using DETX and DETY for each event in the final _common_clean file
| Quadrant A | 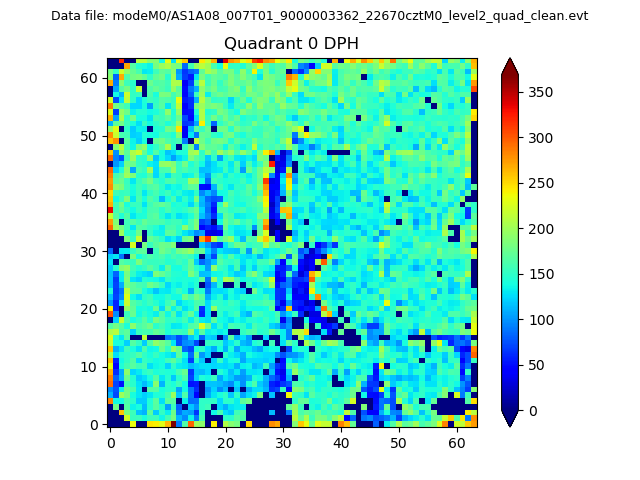 |
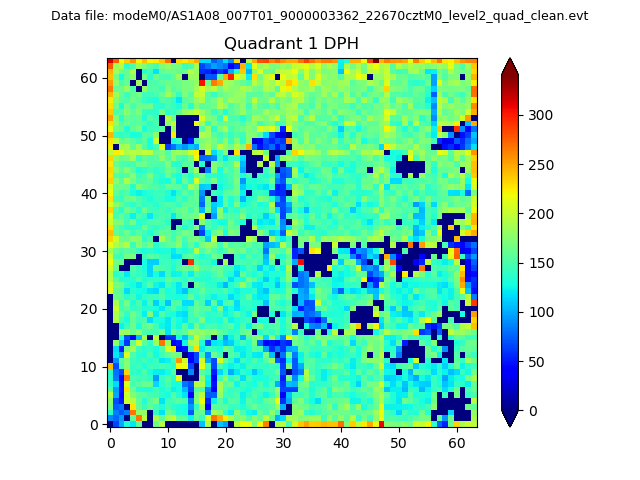 |
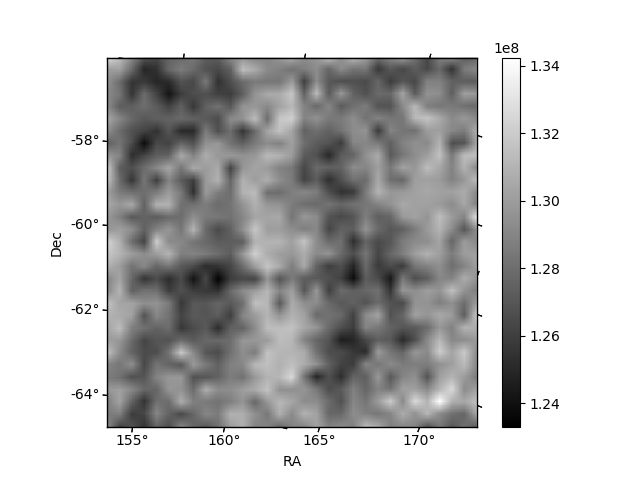
Quadrant B |
|---|---|---|---|
| Quadrant D | 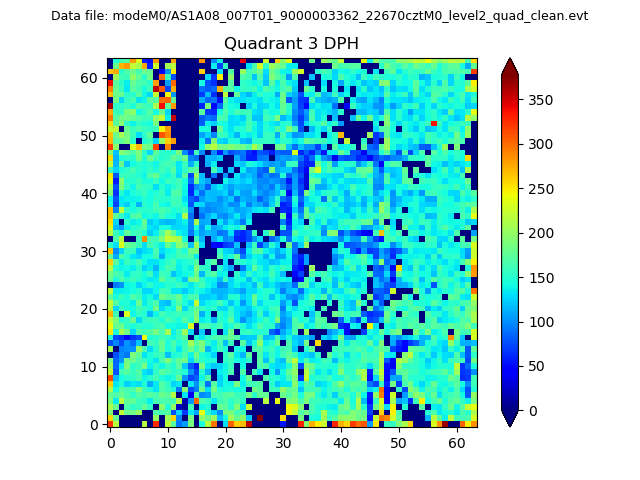 |
 |
Quadrant C |
| Plot type | Count rate plots | Images |
|---|---|---|
| Comparison with Poisson distribution Blue bars denote a histogram of data divided into 1 sec bins. Red curve is a Poisson curve with rate = median count rate of data. |
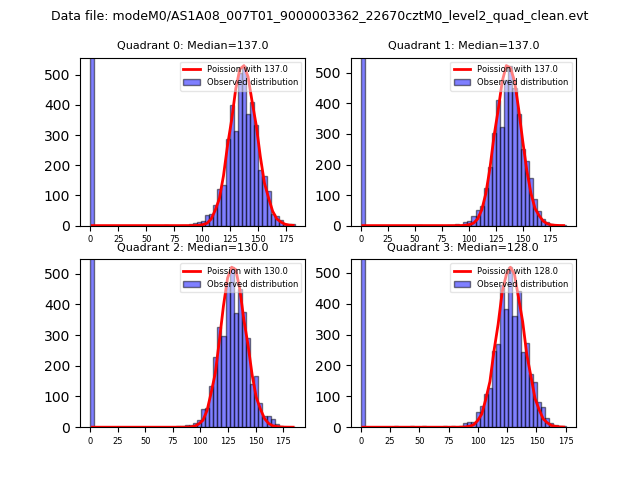 |
 |
| Quadrant-wise count rates Data is divided into 100 sec bins |
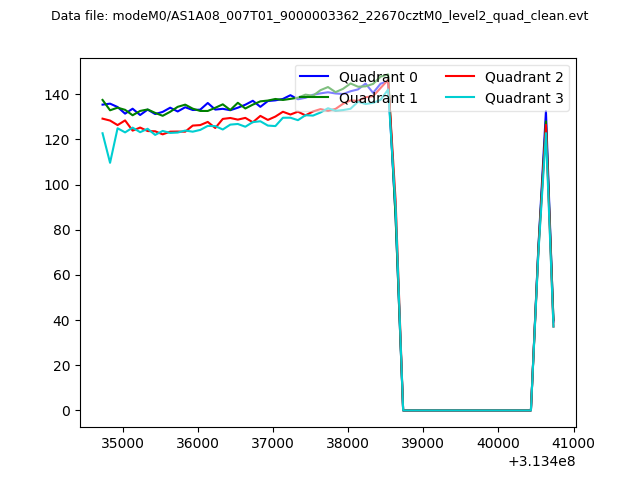 |
|
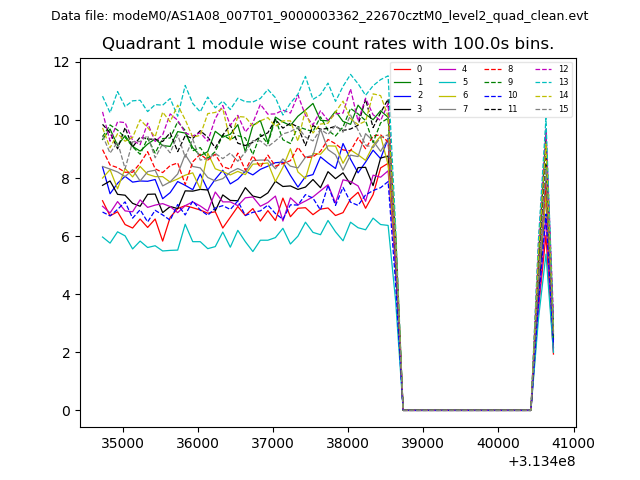
| Module-wise count rates for Quadrant A Data is divided into 100 sec bins |
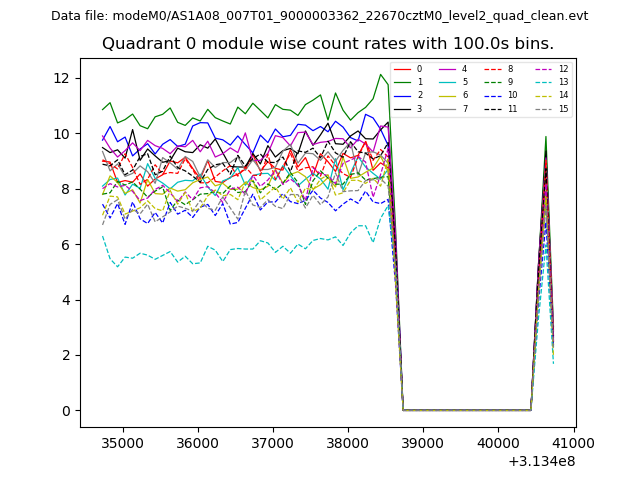 |
 |
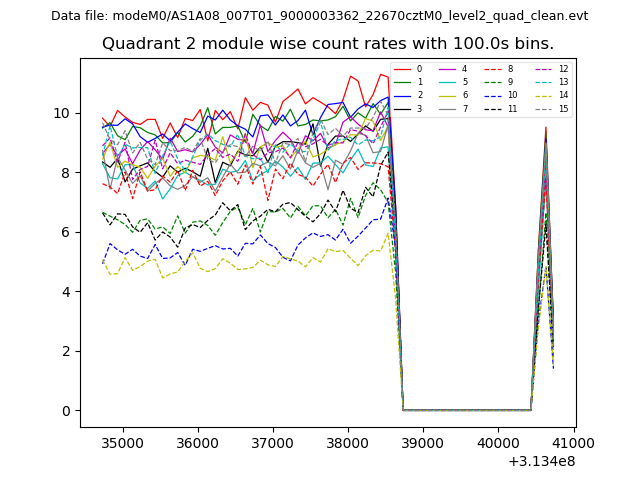
| Module-wise count rates for Quadrant B Data is divided into 100 sec bins |
 |
 |
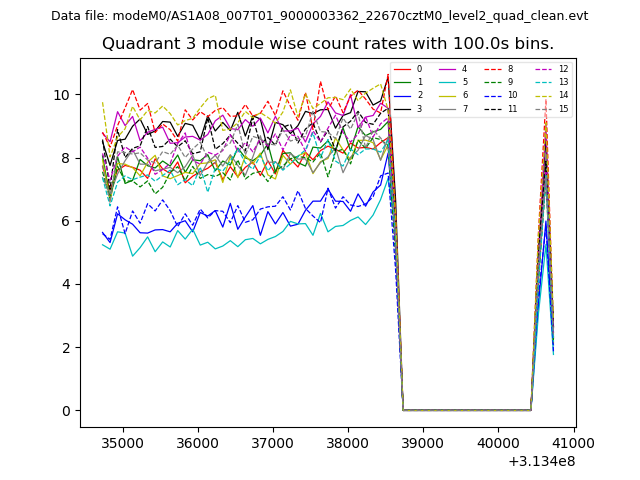
| Module-wise count rates for Quadrant C Data is divided into 100 sec bins |
 |
 |
| Module-wise count rates for Quadrant D Data is divided into 100 sec bins |
 |
 |
| Parameter | Plot |
|---|---|
| CZT HV Monitor | 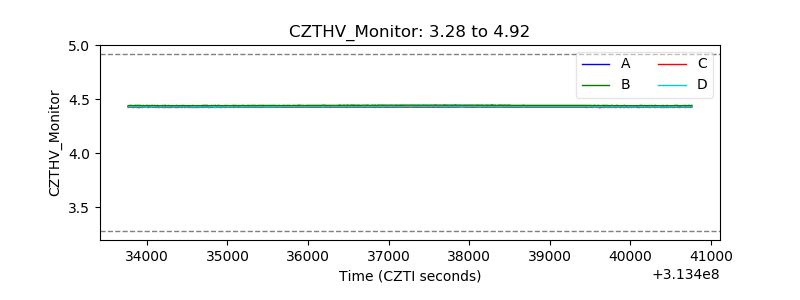 |
| D_VDD | 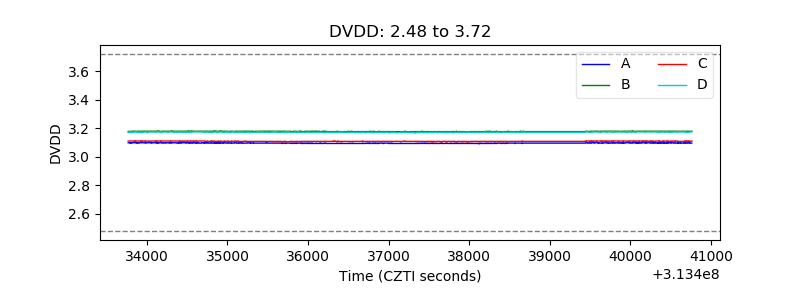 |
| Temperature 1 | 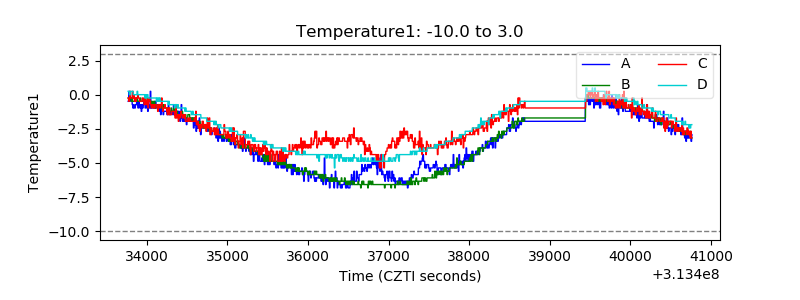 |
| Veto HV Monitor | 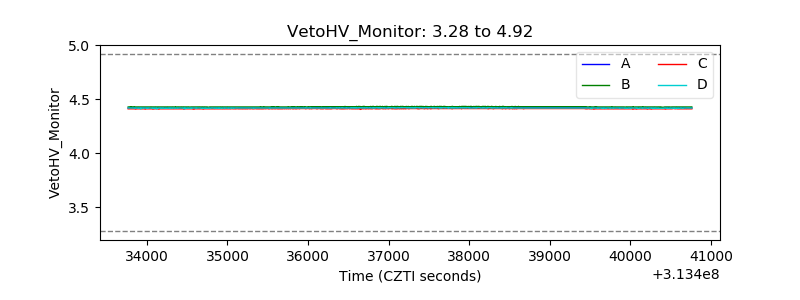 |
| Veto LLD | 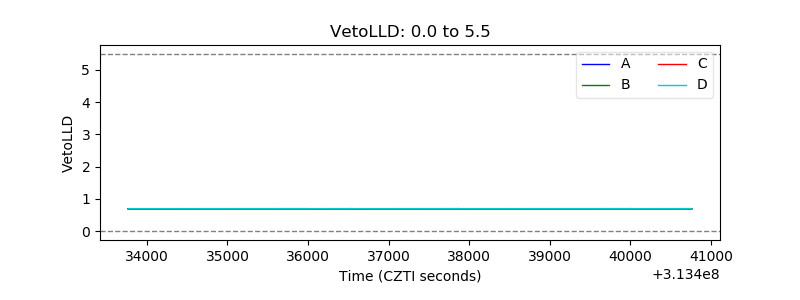 |
| Alpha Counter |  |
| _CPM_Rate | 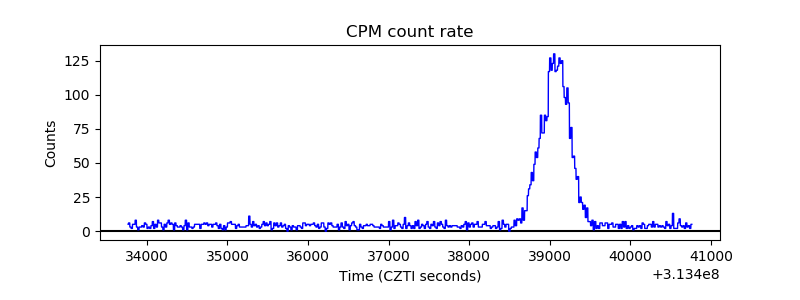 |
| CZT Counter | 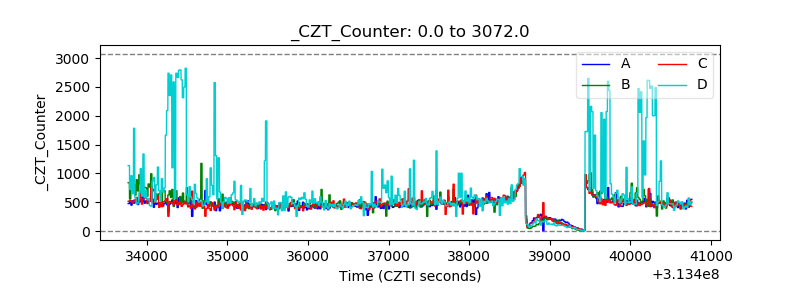 |
| +2.5 Volts monitor |  |
| +5 Volts monitor |  |
| _ROLL_ROT | 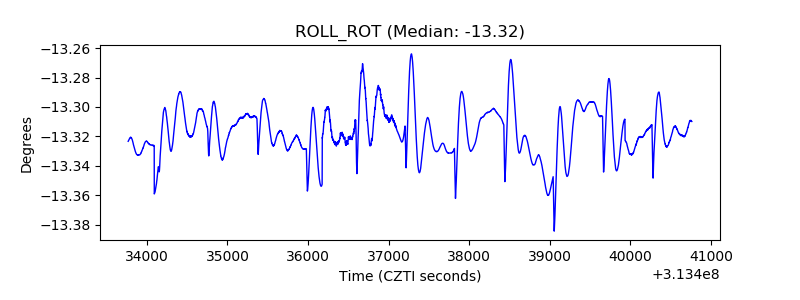 |
| _Roll_DEC | 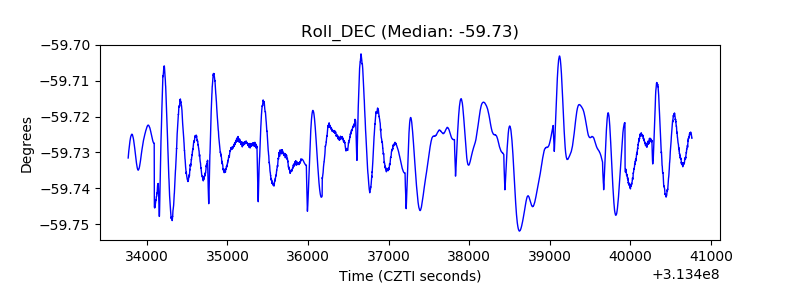 |
| _Roll_RA | 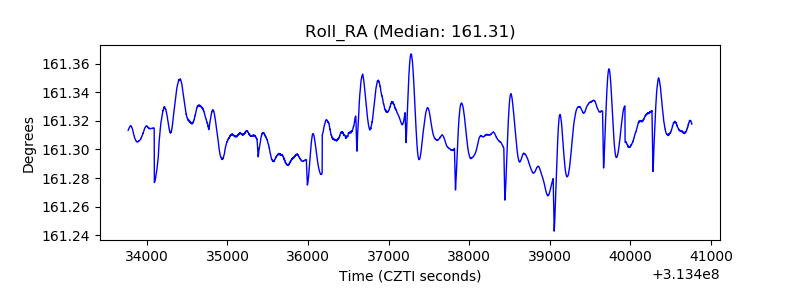 |
| Veto Counter | 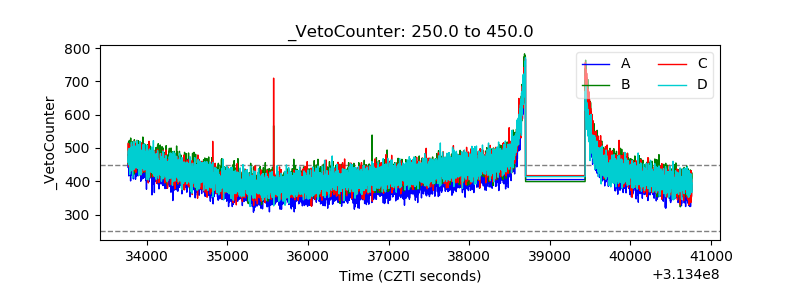 |