| Param | Original file | Final file |
|---|---|---|
| Filename | modeM0/AS1A08_007T01_9000003362_22671cztM0_level2.evt | modeM0/AS1A08_007T01_9000003362_22671cztM0_level2_quad_clean.evt |
| Size (bytes) | 570,971,520 | 98,524,800 |
| Size | 544.5 MB | 94.0 MB |
| Events in quadrant A | 3,553,171 | 633,145 |
| Events in quadrant B | 3,831,401 | 636,264 |
| Events in quadrant C | 3,575,617 | 606,784 |
| Events in quadrant D | 5,827,842 | 590,776 |
| Mode SS | |||
|---|---|---|---|
| Quadrant | BADHDUFLAG | Total packets | Discarded packets |
| A | 0 | 152 | 0 |
| B | 0 | 152 | 0 |
| C | 0 | 152 | 0 |
| D | 0 | 152 | 0 |
| Mode M0 | |||
|---|---|---|---|
| Quadrant | BADHDUFLAG | Total packets | Discarded packets |
| A | 0 | 15399 | 2 |
| B | 0 | 16091 | 2 |
| C | 0 | 15434 | 2 |
| D | 0 | 22452 | 5 |
| Mode M9 | |||
|---|---|---|---|
| Quadrant | BADHDUFLAG | Total packets | Discarded packets |
| A | 0 | 11 | 0 |
| B | 0 | 11 | 0 |
| C | 0 | 11 | 0 |
| D | 0 | 11 | 0 |
| Quadrant | Total seconds | Saturated seconds | Saturation percentage |
|---|---|---|---|
| A | 7426 | 131 | 1.764072% |
| B | 7427 | 168 | 2.262017% |
| C | 7427 | 130 | 1.750370% |
| D | 7426 | 667 | 8.981955% |
Noise dominated data is calculated using 1-second bins in cleaned event files. If a bin has >2000 counts, and if more than 50% of those come from <1% of pixels, then it is considered to be noise-dominated and hence unusable.
| Quadrant | # 1 sec bins | Bins with >0 counts | Bins with >2000 counts | High rate bins dominated by noise | Noise dominated (total time) | Noise dominated (detector-on time) | Marked lightcurve |
|---|---|---|---|---|---|---|---|
| A | 8541 | 7428 | 0 | 0 | 0.00% | 0.00% | 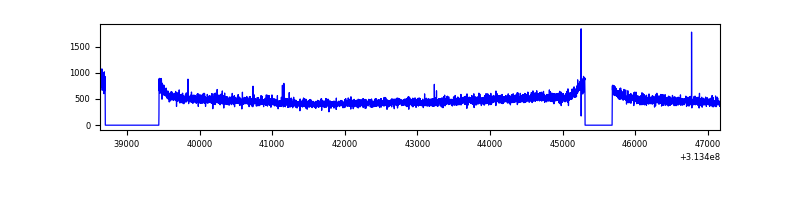 |
| B | 8542 | 7429 | 4 | 4 | 0.05% | 0.05% | 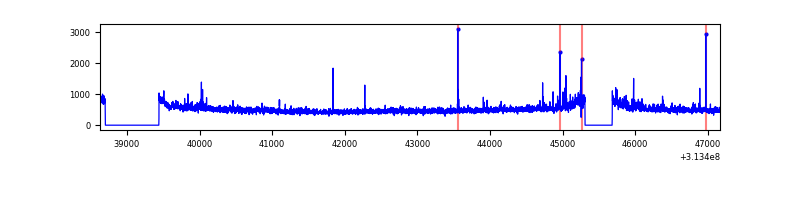 |
| C | 8542 | 7429 | 3 | 3 | 0.04% | 0.04% | 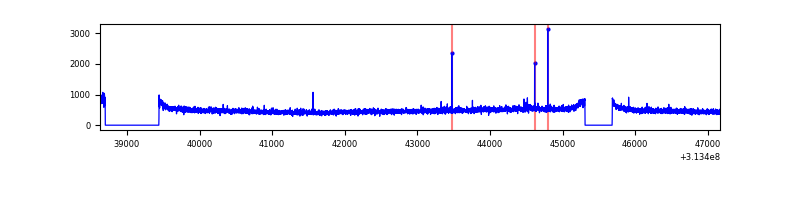 |
| D | 8541 | 7428 | 479 | 479 | 5.61% | 6.45% | 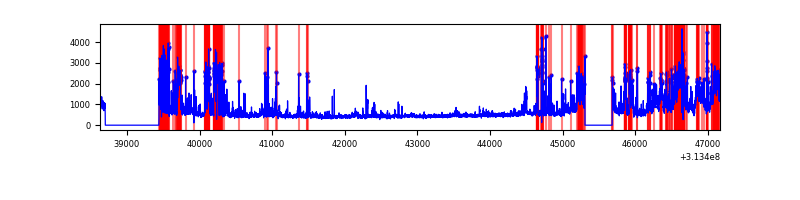 |
Top three noisy pixels from each quadrant. If the there are fewer than three noisy pixels in the level2.evt file, extra rows are filled as -1
| Pixel properties | Quadrant properties | ||||||
|---|---|---|---|---|---|---|---|
| Quadrant | DetID | PixID | Counts | Sigma | Mean | Median | Sigma |
| A | 13 | 254 | 14152 | 71.81 | 920 | 895 | 184.6 |
| A | 0 | 226 | 8256 | 39.87 | 920 | 895 | 184.6 |
| A | 3 | 137 | 7458 | 35.55 | 920 | 895 | 184.6 |
| B | 0 | 219 | 76216 | 437.82 | 912 | 888 | 172.1 |
| B | 0 | 229 | 57183 | 327.2 | 912 | 888 | 172.1 |
| B | 0 | 190 | 56508 | 323.27 | 912 | 888 | 172.1 |
| C | 14 | 238 | 136469 | 664.54 | 872 | 873 | 204.0 |
| C | 0 | 239 | 12184 | 55.43 | 872 | 873 | 204.0 |
| C | 10 | 22 | 10339 | 46.39 | 872 | 873 | 204.0 |
| D | 12 | 235 | 834858 | 3973.49 | 862 | 835 | 209.9 |
| D | 1 | 52 | 468498 | 2228.06 | 862 | 835 | 209.9 |
| D | 5 | 32 | 299619 | 1423.48 | 862 | 835 | 209.9 |
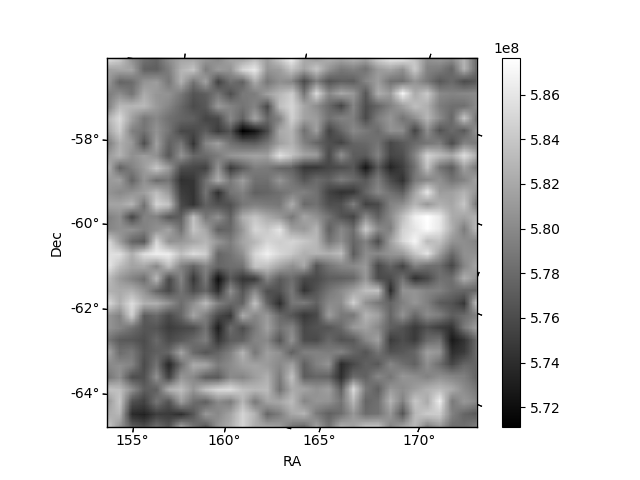
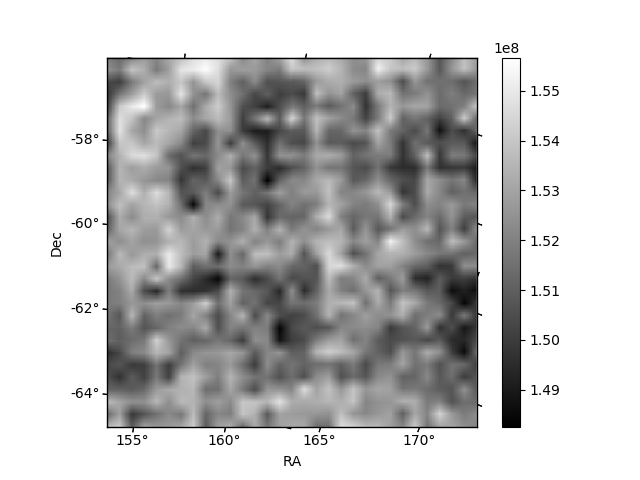
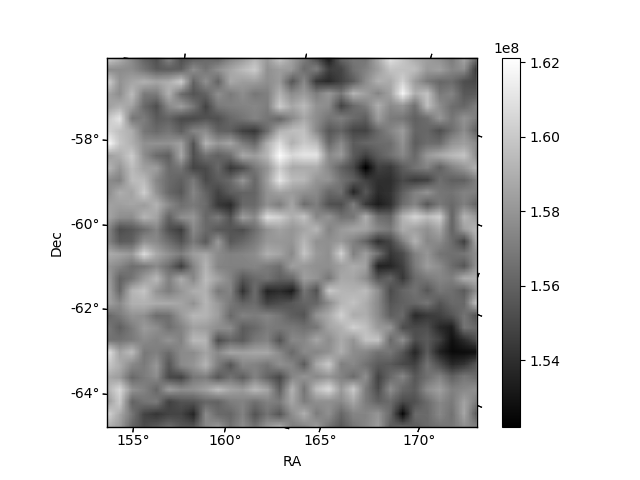
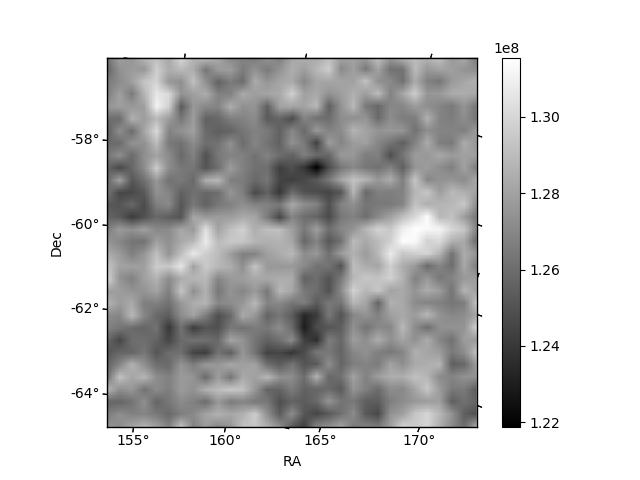
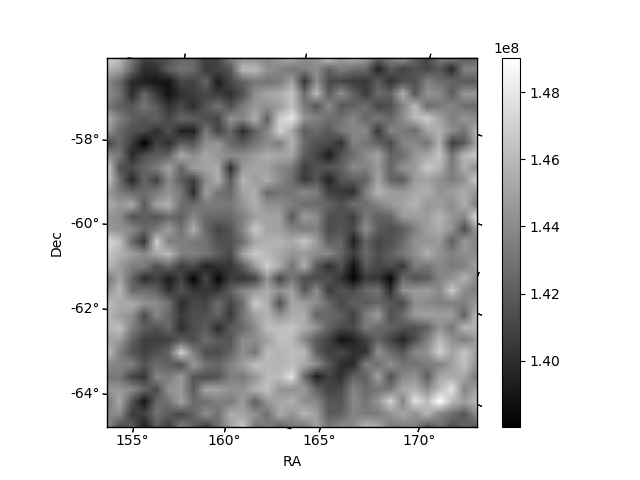
Histogram calculated using DETX and DETY for each event in the final _common_clean file
| Quadrant A | 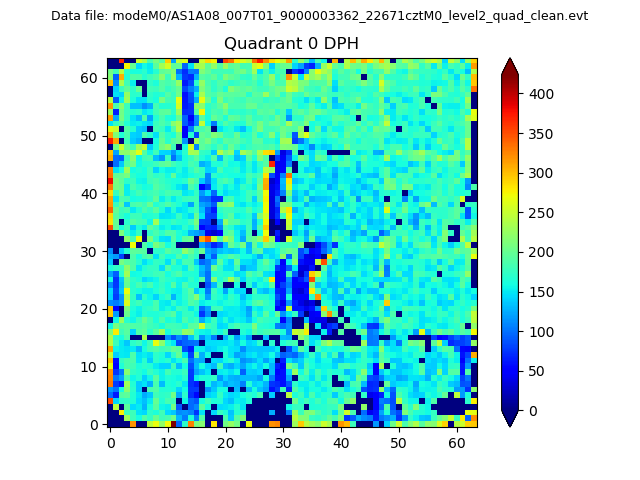 |
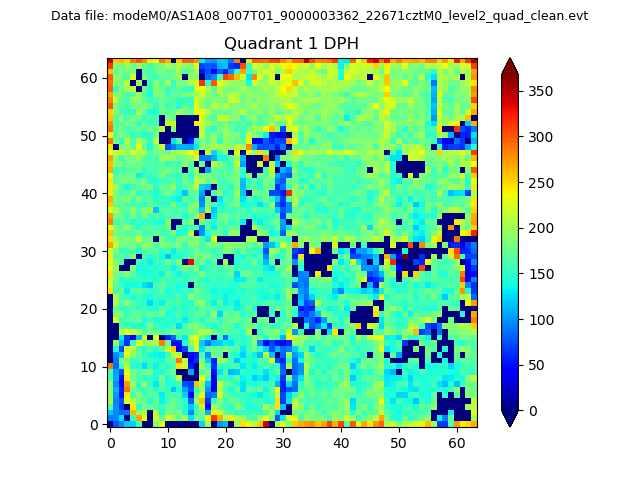 |
Quadrant B |
|---|---|---|---|
| Quadrant D | 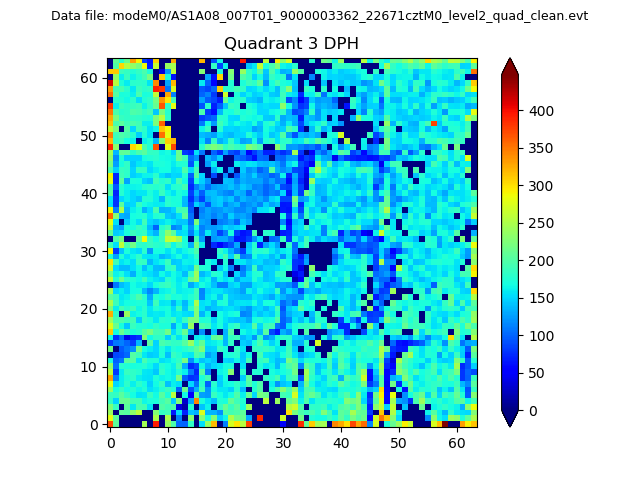 |
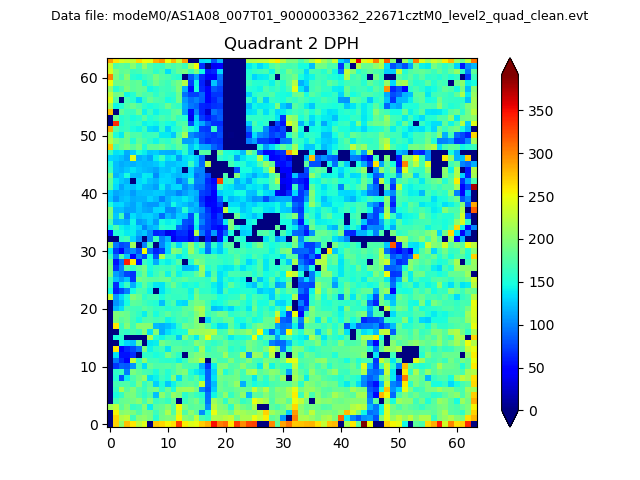 |
Quadrant C |
| Plot type | Count rate plots | Images |
|---|---|---|
| Comparison with Poisson distribution Blue bars denote a histogram of data divided into 1 sec bins. Red curve is a Poisson curve with rate = median count rate of data. |
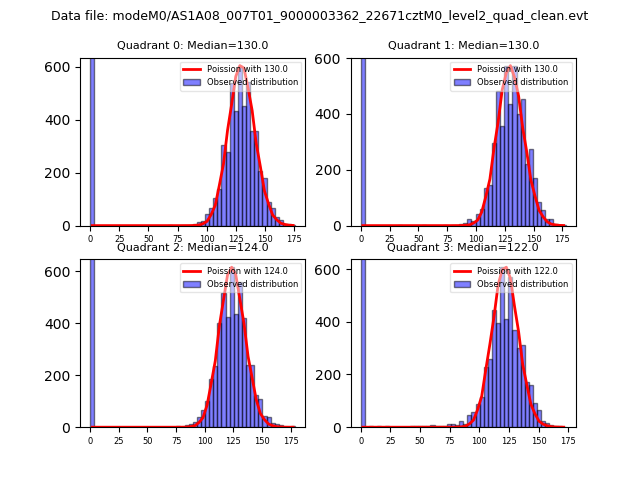 |
 |
| Quadrant-wise count rates Data is divided into 100 sec bins |
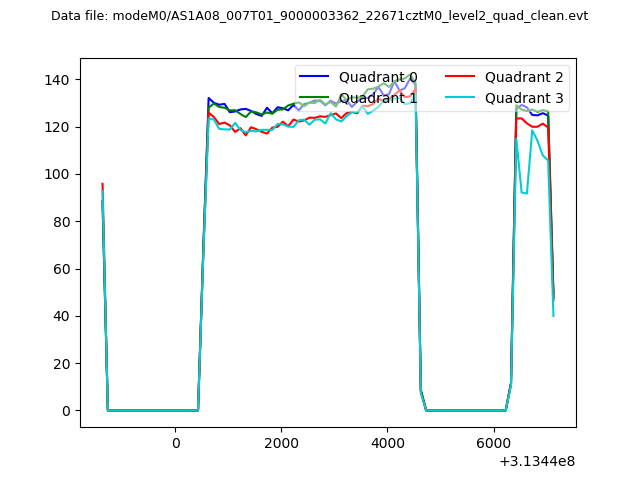 |
|
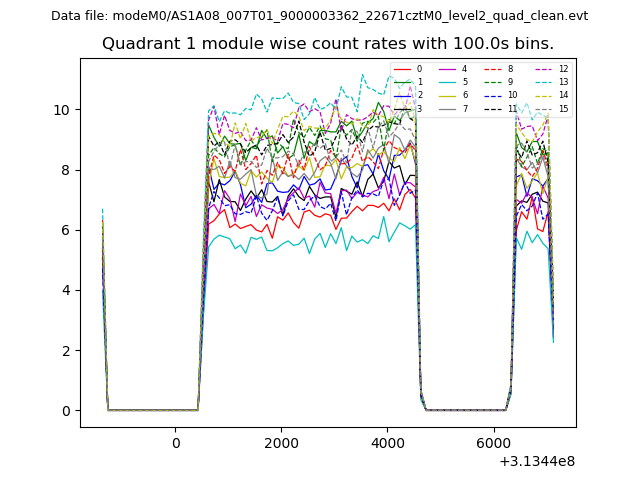
| Module-wise count rates for Quadrant A Data is divided into 100 sec bins |
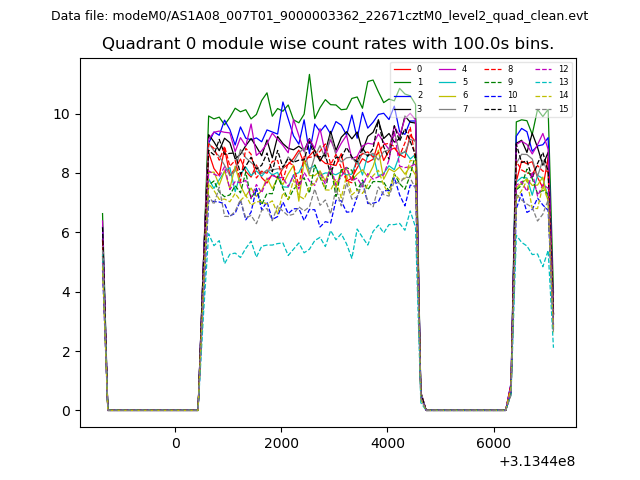 |
 |
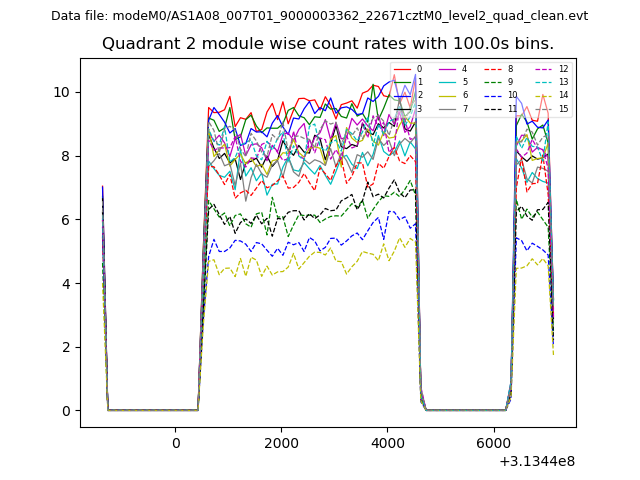
| Module-wise count rates for Quadrant B Data is divided into 100 sec bins |
 |
 |
| Module-wise count rates for Quadrant C Data is divided into 100 sec bins |
 |
 |
| Module-wise count rates for Quadrant D Data is divided into 100 sec bins |
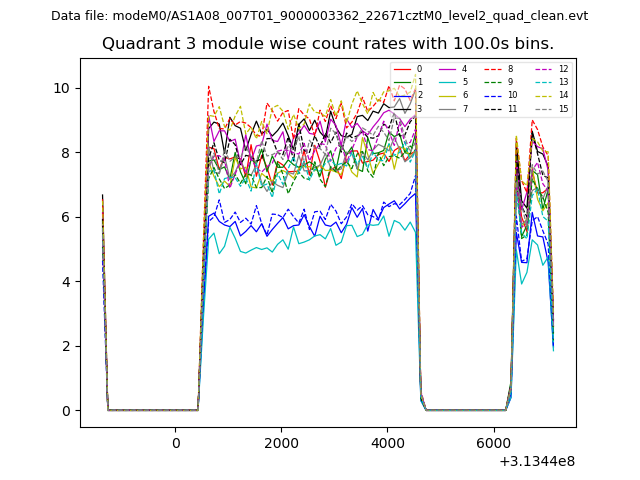 |
 |
| Parameter | Plot |
|---|---|
| CZT HV Monitor | 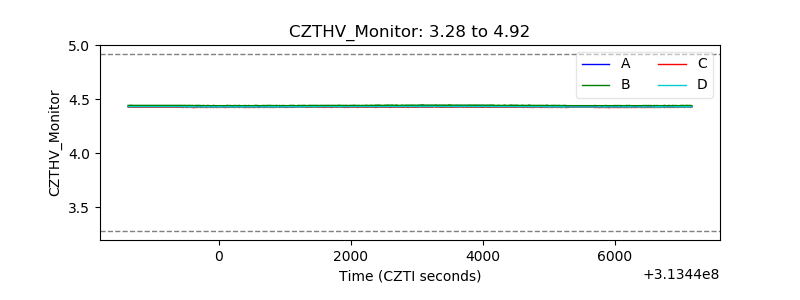 |
| D_VDD | 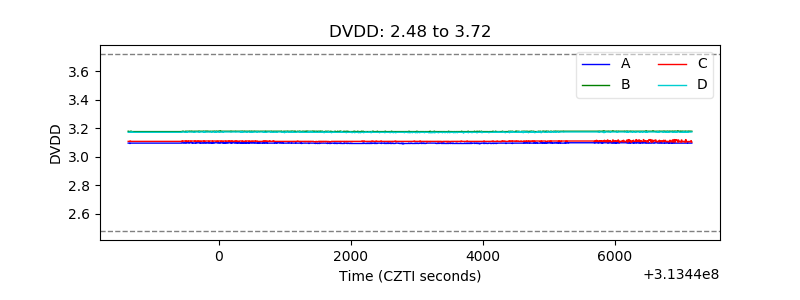 |
| Temperature 1 | 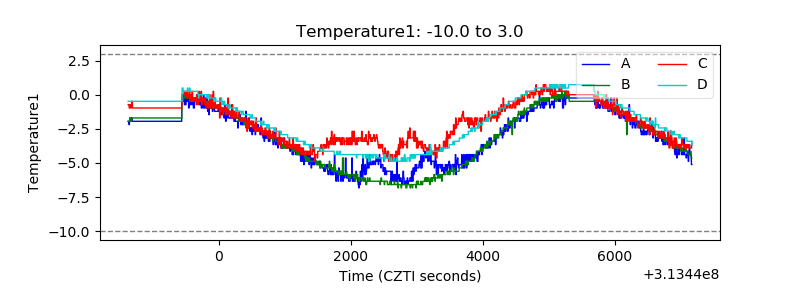 |
| Veto HV Monitor | 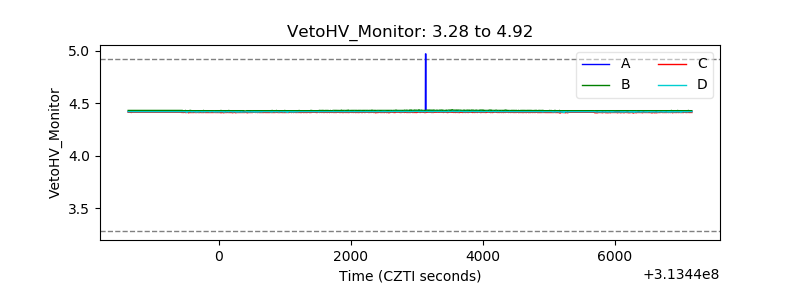 |
| Veto LLD | 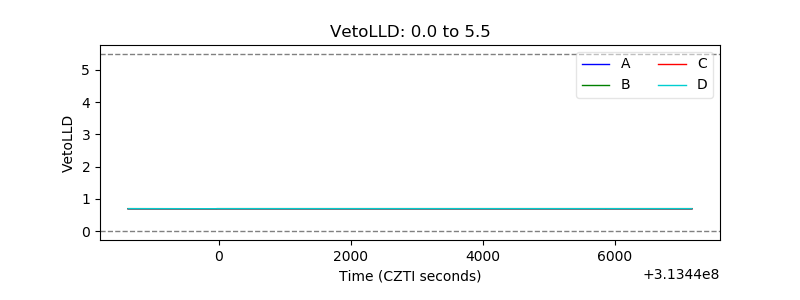 |
| Alpha Counter | 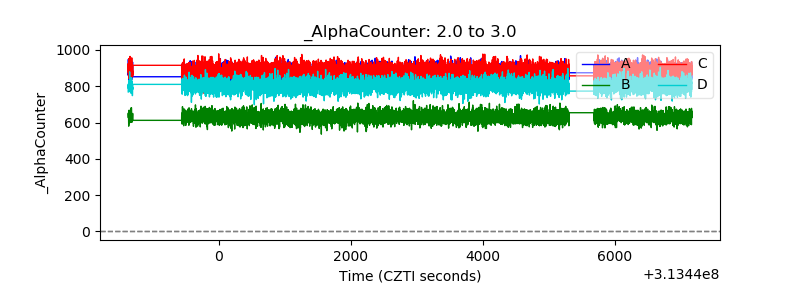 |
| _CPM_Rate | 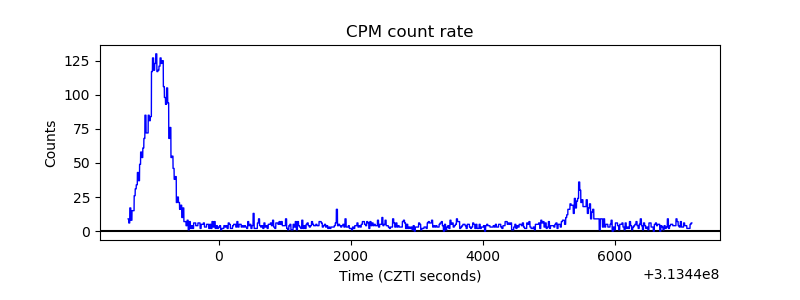 |
| CZT Counter | 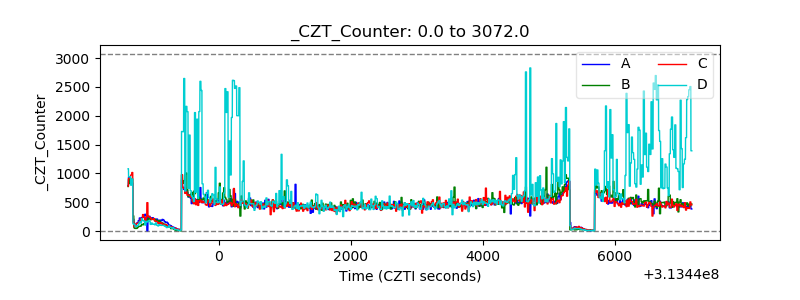 |
| +2.5 Volts monitor | 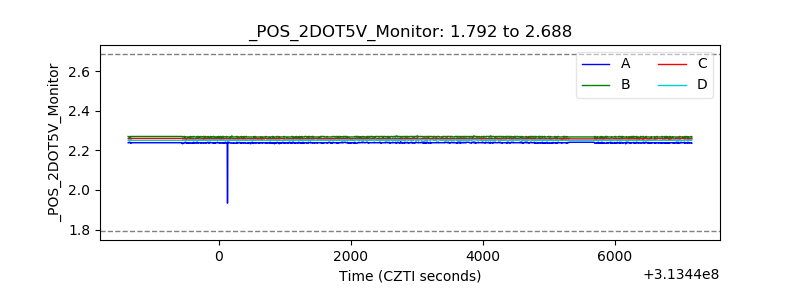 |
| +5 Volts monitor | 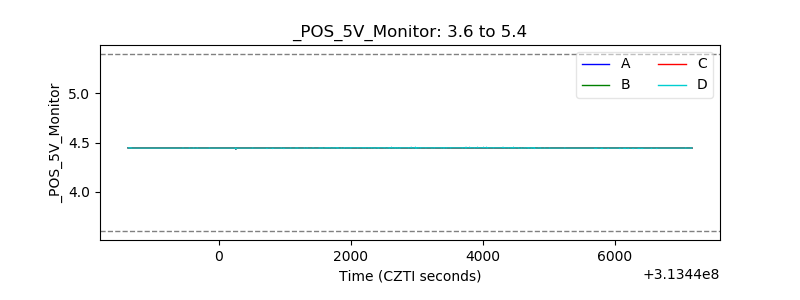 |
| _ROLL_ROT | 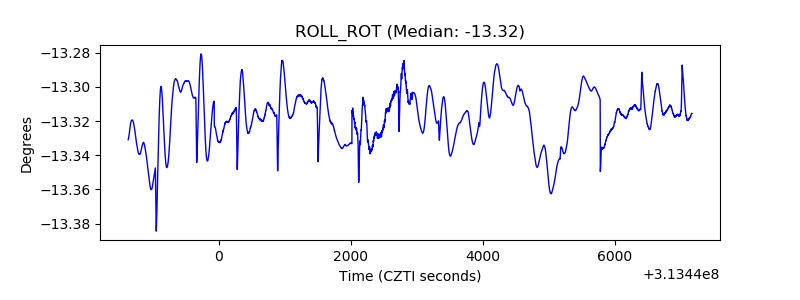 |
| _Roll_DEC | 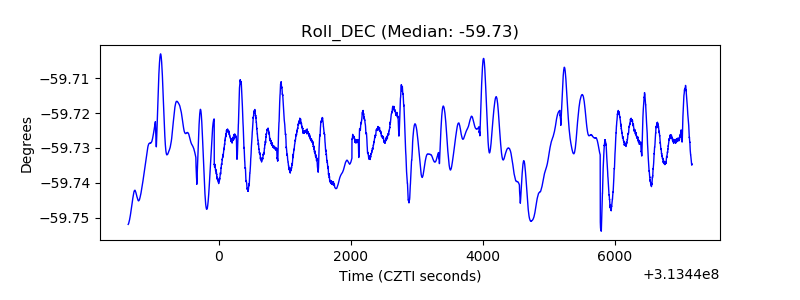 |
| _Roll_RA | 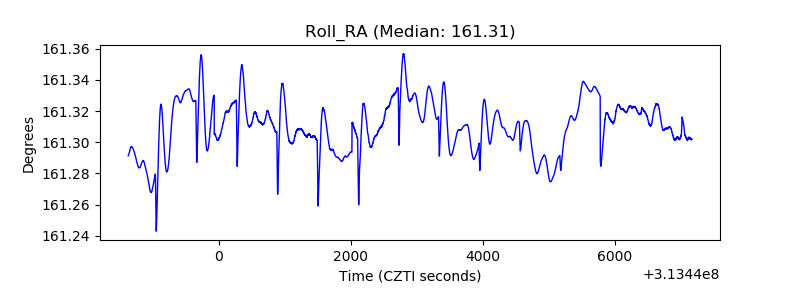 |
| Veto Counter | 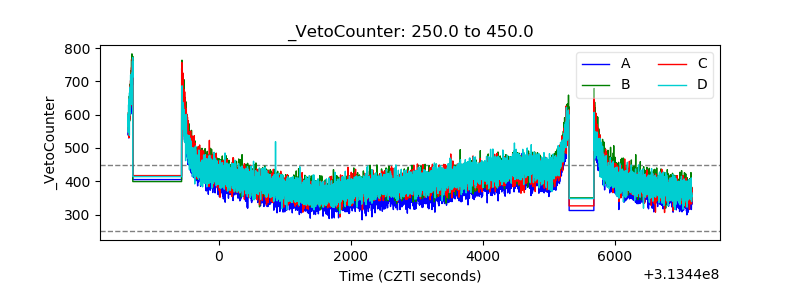 |