| Param | Original file | Final file |
|---|---|---|
| Filename | modeM0/AS1A08_007T01_9000003362_22672cztM0_level2.evt | modeM0/AS1A08_007T01_9000003362_22672cztM0_level2_quad_clean.evt |
| Size (bytes) | 680,126,400 | 102,957,120 |
| Size | 648.6 MB | 98.2 MB |
| Events in quadrant A | 3,894,792 | 660,903 |
| Events in quadrant B | 4,286,433 | 665,125 |
| Events in quadrant C | 3,926,318 | 634,418 |
| Events in quadrant D | 7,939,580 | 592,448 |
| Mode SS | |||
|---|---|---|---|
| Quadrant | BADHDUFLAG | Total packets | Discarded packets |
| A | 0 | 168 | 0 |
| B | 0 | 168 | 0 |
| C | 0 | 168 | 0 |
| D | 0 | 168 | 0 |
| Mode M0 | |||
|---|---|---|---|
| Quadrant | BADHDUFLAG | Total packets | Discarded packets |
| A | 0 | 16877 | 4 |
| B | 0 | 18049 | 4 |
| C | 0 | 16909 | 4 |
| D | 0 | 29154 | 4 |
| Mode M9 | |||
|---|---|---|---|
| Quadrant | BADHDUFLAG | Total packets | Discarded packets |
| A | 0 | 4 | 0 |
| B | 0 | 4 | 0 |
| C | 0 | 4 | 0 |
| D | 0 | 4 | 0 |
| Quadrant | Total seconds | Saturated seconds | Saturation percentage |
|---|---|---|---|
| A | 8115 | 99 | 1.219963% |
| B | 8116 | 182 | 2.242484% |
| C | 8116 | 150 | 1.848201% |
| D | 8116 | 1129 | 13.910793% |
Noise dominated data is calculated using 1-second bins in cleaned event files. If a bin has >2000 counts, and if more than 50% of those come from <1% of pixels, then it is considered to be noise-dominated and hence unusable.
| Quadrant | # 1 sec bins | Bins with >0 counts | Bins with >2000 counts | High rate bins dominated by noise | Noise dominated (total time) | Noise dominated (detector-on time) | Marked lightcurve |
|---|---|---|---|---|---|---|---|
| A | 8650 | 8119 | 0 | 0 | 0.00% | 0.00% | 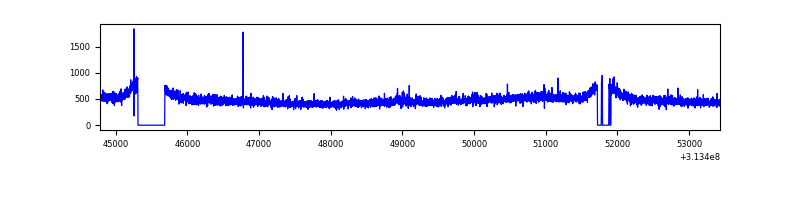 |
| B | 8651 | 8120 | 5 | 5 | 0.06% | 0.06% | 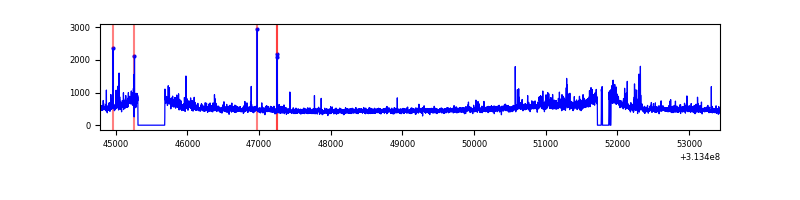 |
| C | 8651 | 8120 | 2 | 2 | 0.02% | 0.02% | 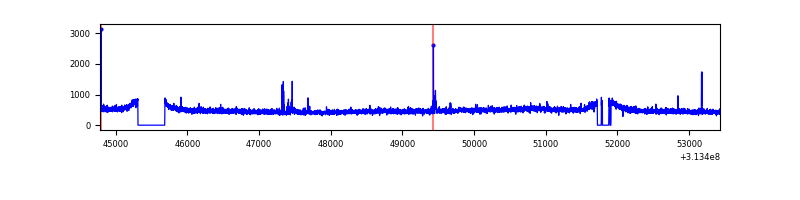 |
| D | 8651 | 8119 | 796 | 796 | 9.20% | 9.80% | 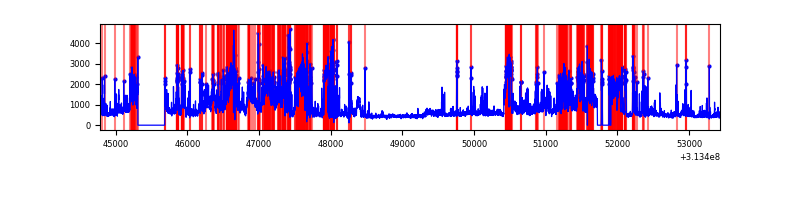 |
Top three noisy pixels from each quadrant. If the there are fewer than three noisy pixels in the level2.evt file, extra rows are filled as -1
| Pixel properties | Quadrant properties | ||||||
|---|---|---|---|---|---|---|---|
| Quadrant | DetID | PixID | Counts | Sigma | Mean | Median | Sigma |
| A | 14 | 235 | 21387 | 100.6 | 1002 | 979 | 202.9 |
| A | 13 | 254 | 15630 | 72.22 | 1002 | 979 | 202.9 |
| A | 0 | 226 | 8926 | 39.17 | 1002 | 979 | 202.9 |
| B | 0 | 219 | 89002 | 467.46 | 996 | 970 | 188.3 |
| B | 0 | 190 | 85278 | 447.68 | 996 | 970 | 188.3 |
| B | 0 | 229 | 79245 | 415.65 | 996 | 970 | 188.3 |
| C | 14 | 238 | 152536 | 679.35 | 952 | 955 | 223.1 |
| C | 10 | 22 | 39069 | 170.82 | 952 | 955 | 223.1 |
| C | 8 | 128 | 7963 | 31.41 | 952 | 955 | 223.1 |
| D | 12 | 235 | 1122867 | 4989.23 | 920 | 890 | 224.9 |
| D | 1 | 52 | 861295 | 3826.07 | 920 | 890 | 224.9 |
| D | 12 | 233 | 677500 | 3008.76 | 920 | 890 | 224.9 |
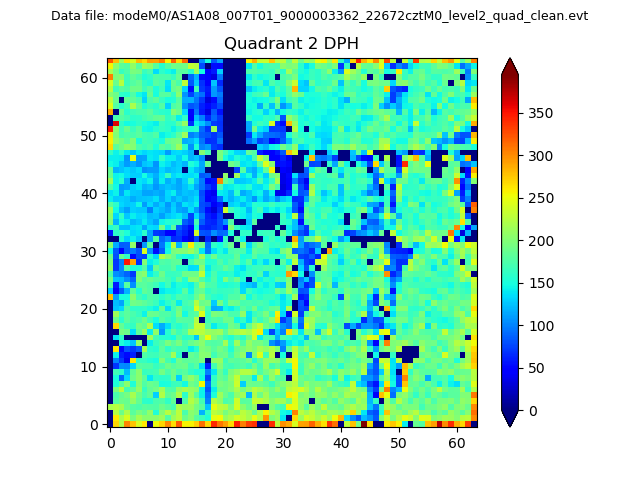
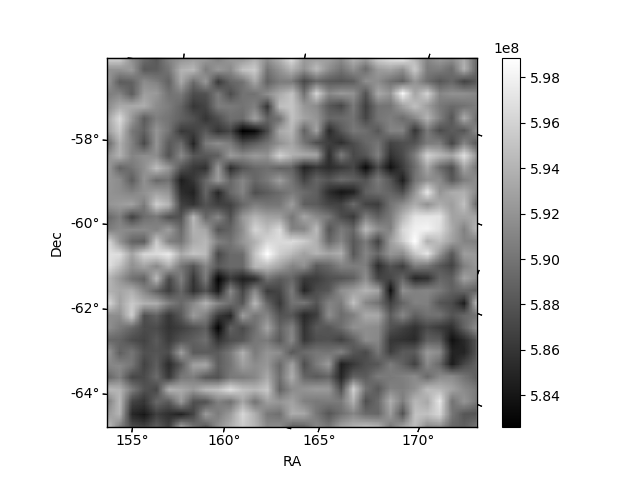
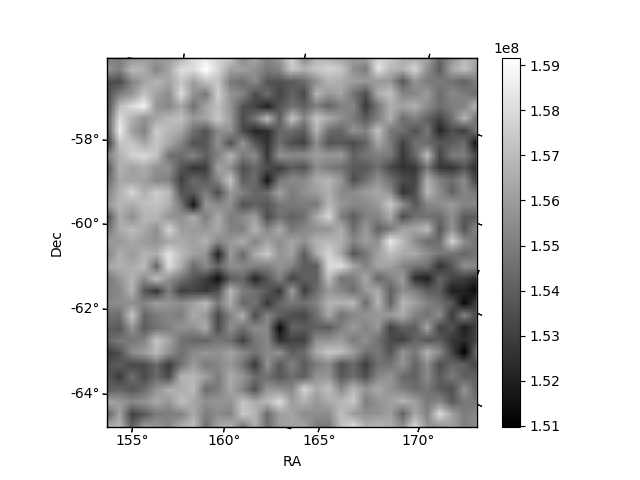
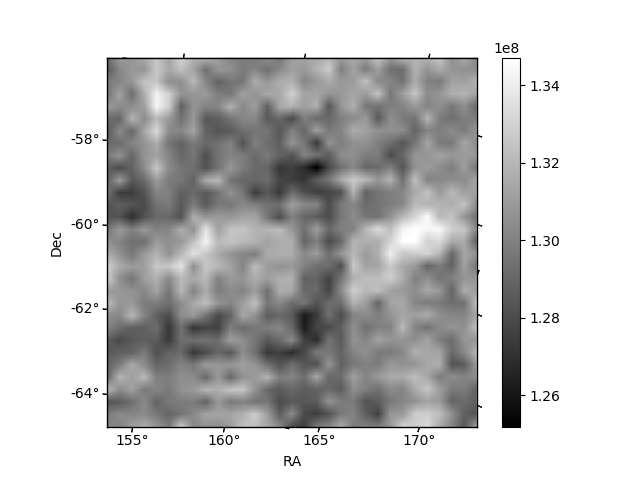
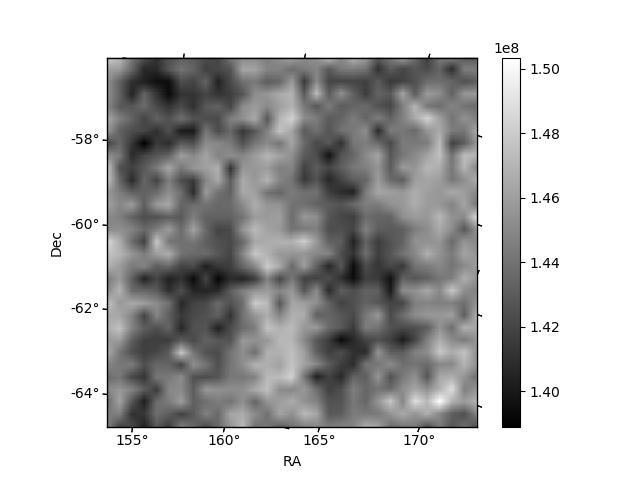
Histogram calculated using DETX and DETY for each event in the final _common_clean file
| Quadrant A | 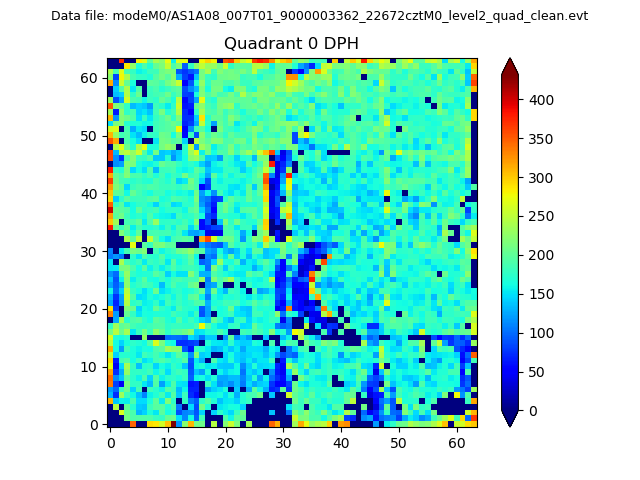 |
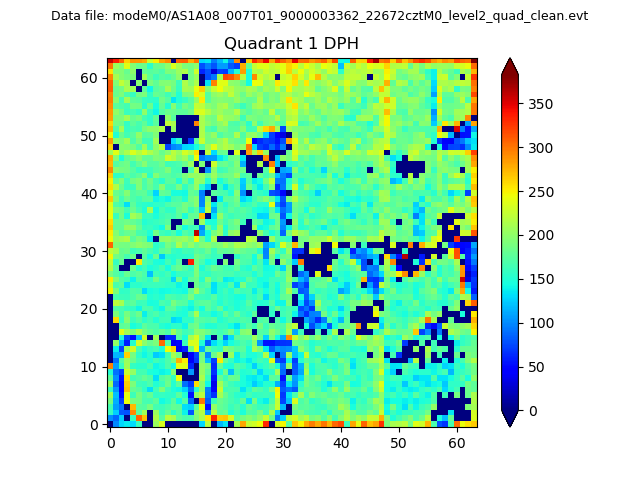 |
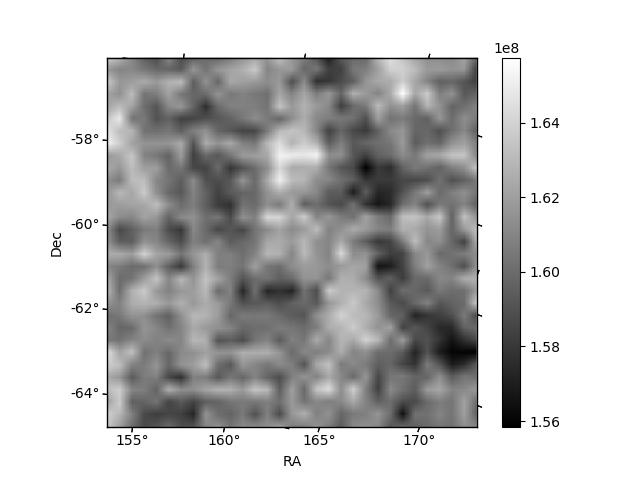
Quadrant B |
|---|---|---|---|
| Quadrant D | 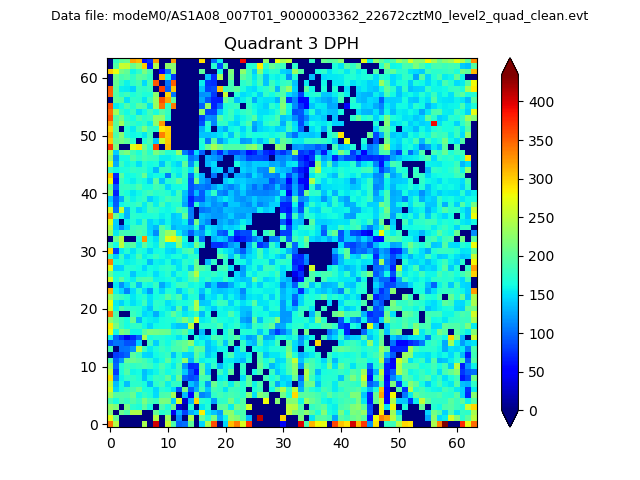 |
 |
Quadrant C |
| Plot type | Count rate plots | Images |
|---|---|---|
| Comparison with Poisson distribution Blue bars denote a histogram of data divided into 1 sec bins. Red curve is a Poisson curve with rate = median count rate of data. |
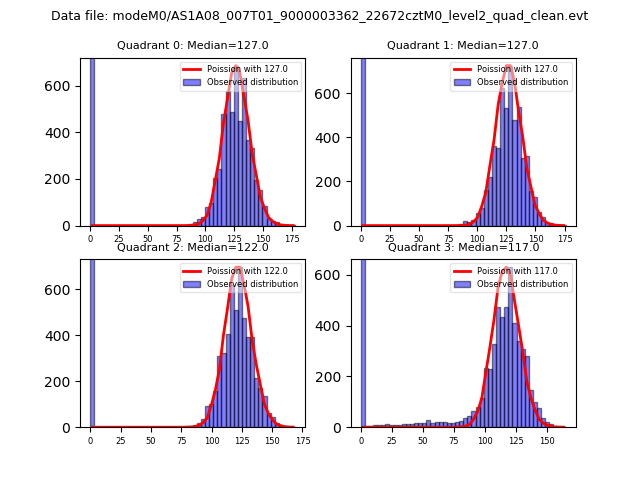 |
 |
| Quadrant-wise count rates Data is divided into 100 sec bins |
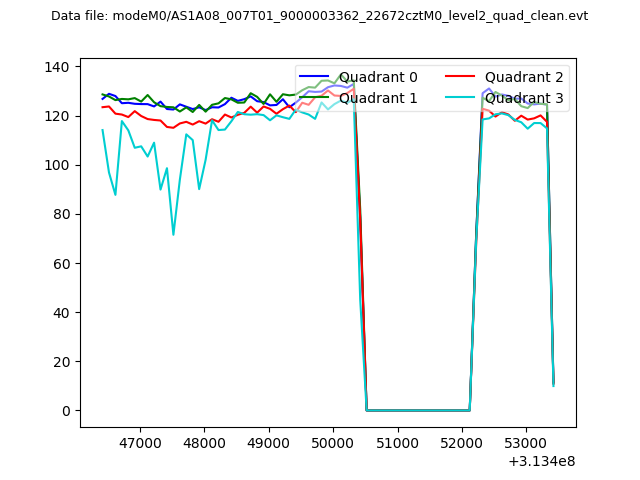 |
|
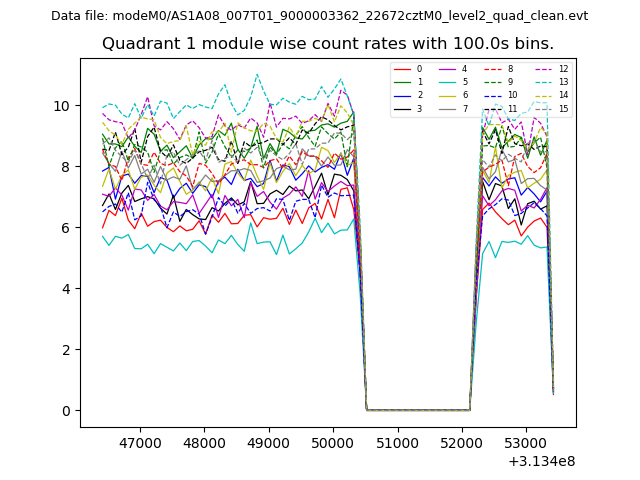
| Module-wise count rates for Quadrant A Data is divided into 100 sec bins |
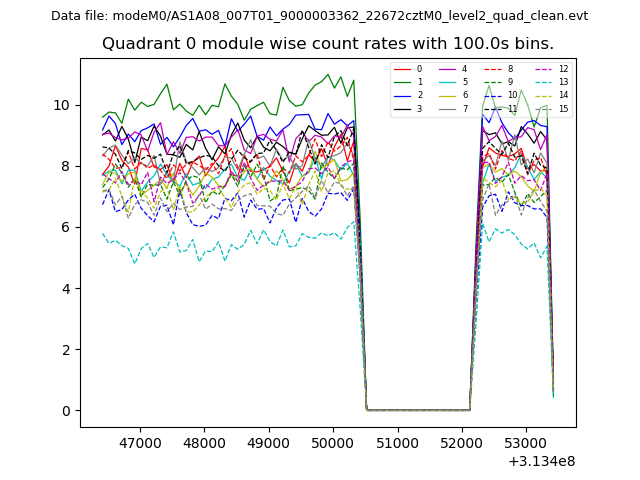 |
 |
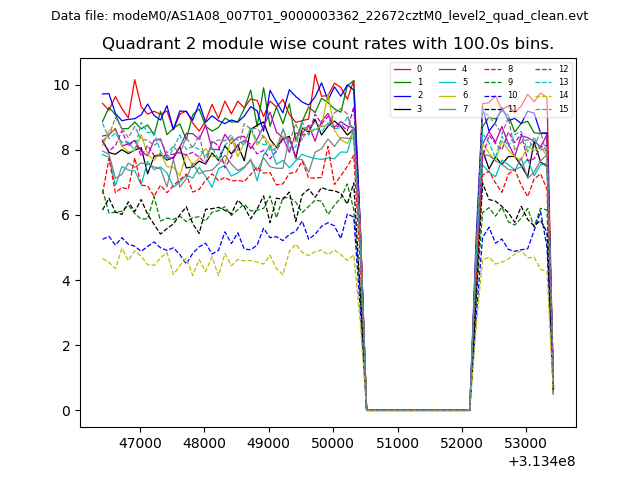
| Module-wise count rates for Quadrant B Data is divided into 100 sec bins |
 |
 |
| Module-wise count rates for Quadrant C Data is divided into 100 sec bins |
 |
 |
| Module-wise count rates for Quadrant D Data is divided into 100 sec bins |
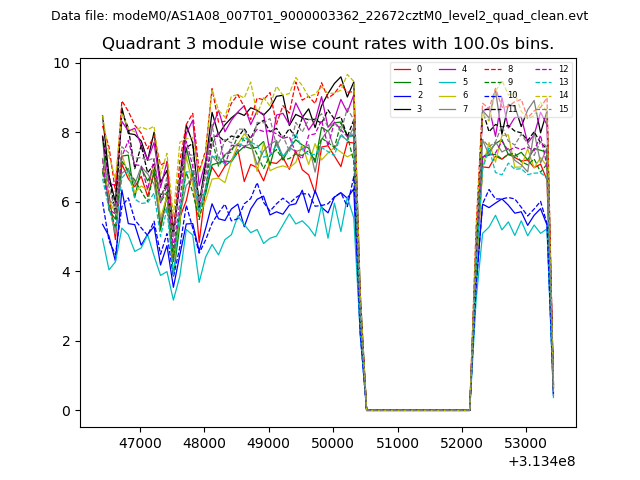 |
 |
| Parameter | Plot |
|---|---|
| CZT HV Monitor | 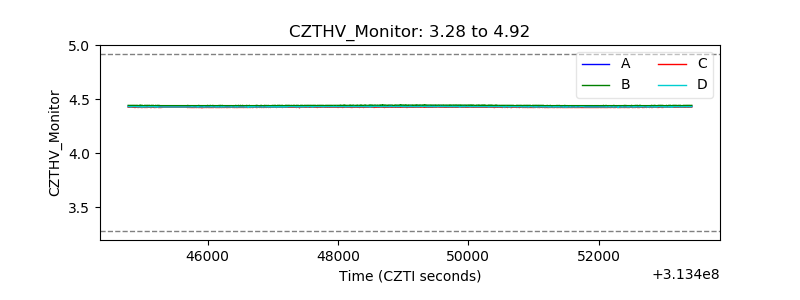 |
| D_VDD | 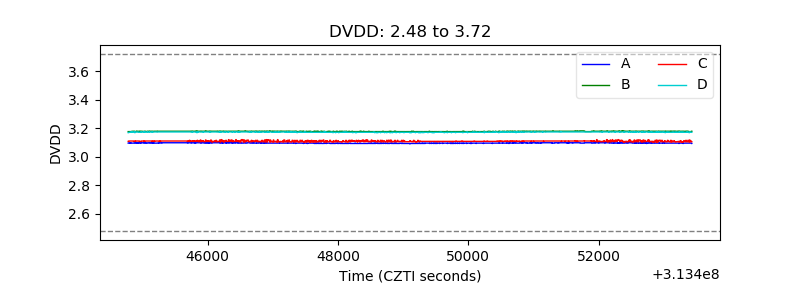 |
| Temperature 1 | 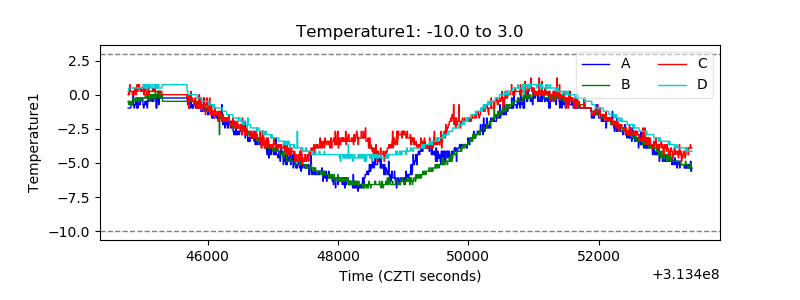 |
| Veto HV Monitor | 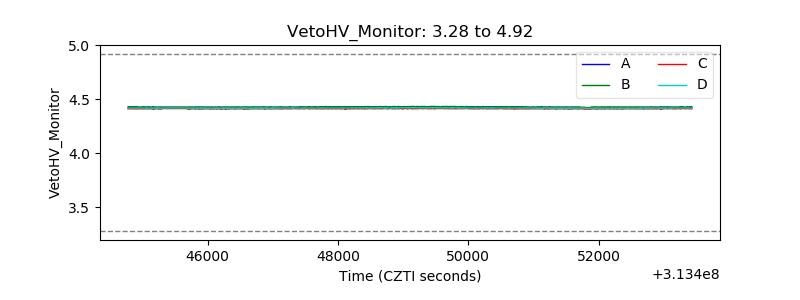 |
| Veto LLD | 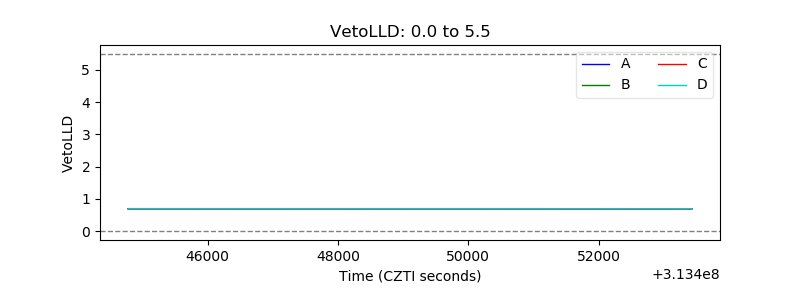 |
| Alpha Counter | 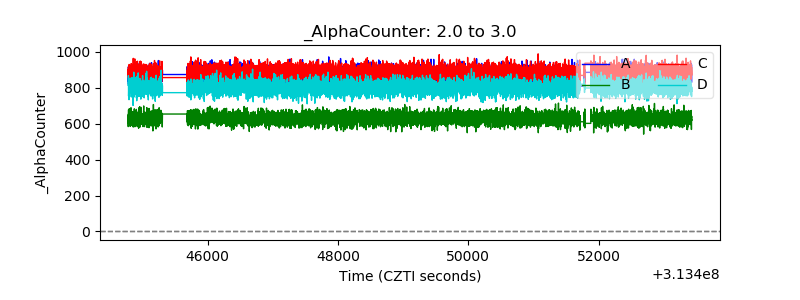 |
| _CPM_Rate | 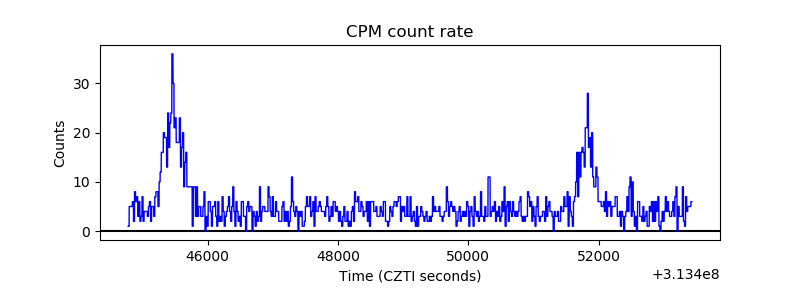 |
| CZT Counter | 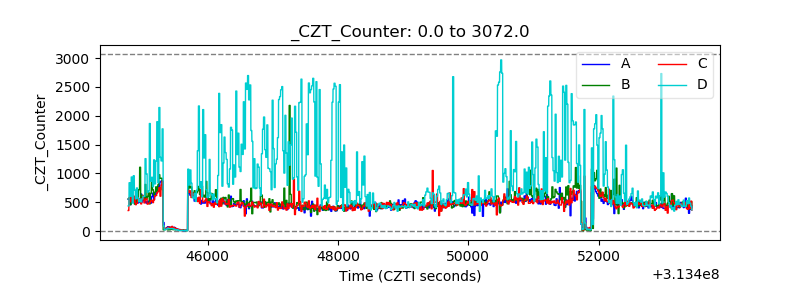 |
| +2.5 Volts monitor | 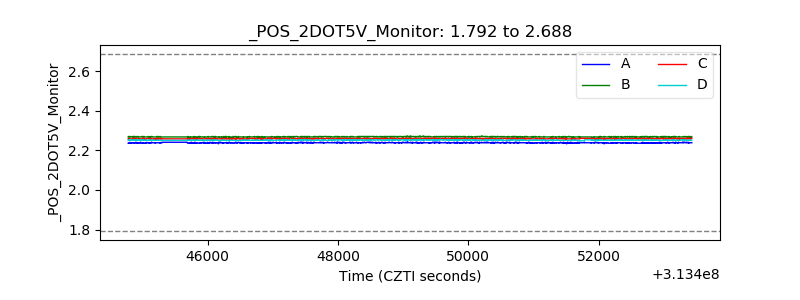 |
| +5 Volts monitor |  |
| _ROLL_ROT | 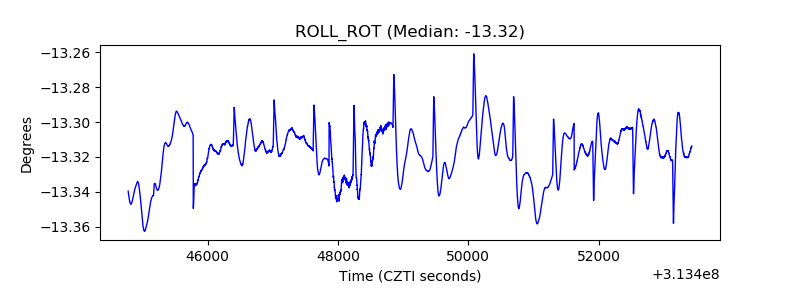 |
| _Roll_DEC | 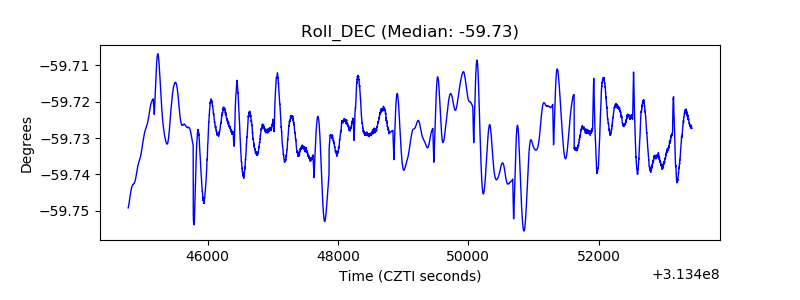 |
| _Roll_RA | 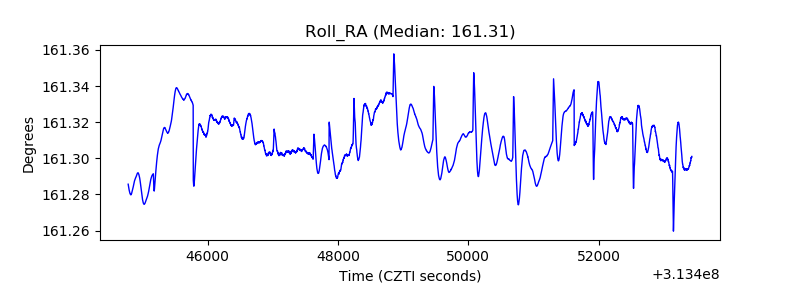 |
| Veto Counter | 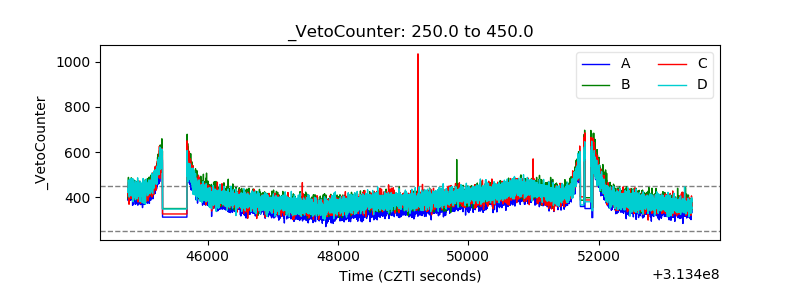 |