| Param | Original file | Final file |
|---|---|---|
| Filename | modeM0/AS1A08_007T01_9000003362_22679cztM0_level2.evt | modeM0/AS1A08_007T01_9000003362_22679cztM0_level2_quad_clean.evt |
| Size (bytes) | 1,204,225,920 | 158,135,040 |
| Size | 1.1 GB | 150.8 MB |
| Events in quadrant A | 6,159,518 | 1,021,872 |
| Events in quadrant B | 6,684,860 | 1,039,299 |
| Events in quadrant C | 6,248,155 | 1,002,185 |
| Events in quadrant D | 16,509,142 | 835,304 |
| Mode SS | |||
|---|---|---|---|
| Quadrant | BADHDUFLAG | Total packets | Discarded packets |
| A | 0 | 262 | 0 |
| B | 0 | 262 | 0 |
| C | 0 | 262 | 0 |
| D | 0 | 262 | 0 |
| Mode M0 | |||
|---|---|---|---|
| Quadrant | BADHDUFLAG | Total packets | Discarded packets |
| A | 0 | 26484 | 3 |
| B | 0 | 28076 | 3 |
| C | 0 | 26577 | 3 |
| D | 0 | 58044 | 3 |
| Mode M9 | |||
|---|---|---|---|
| Quadrant | BADHDUFLAG | Total packets | Discarded packets |
| A | 0 | 27 | 0 |
| B | 0 | 27 | 0 |
| C | 0 | 27 | 0 |
| D | 0 | 27 | 0 |
| Quadrant | Total seconds | Saturated seconds | Saturation percentage |
|---|---|---|---|
| A | 12878 | 59 | 0.458146% |
| B | 12878 | 87 | 0.675571% |
| C | 12878 | 152 | 1.180308% |
| D | 12878 | 3003 | 23.318838% |
Noise dominated data is calculated using 1-second bins in cleaned event files. If a bin has >2000 counts, and if more than 50% of those come from <1% of pixels, then it is considered to be noise-dominated and hence unusable.
| Quadrant | # 1 sec bins | Bins with >0 counts | Bins with >2000 counts | High rate bins dominated by noise | Noise dominated (total time) | Noise dominated (detector-on time) | Marked lightcurve |
|---|---|---|---|---|---|---|---|
| A | 15568 | 12881 | 16 | 16 | 0.10% | 0.12% | 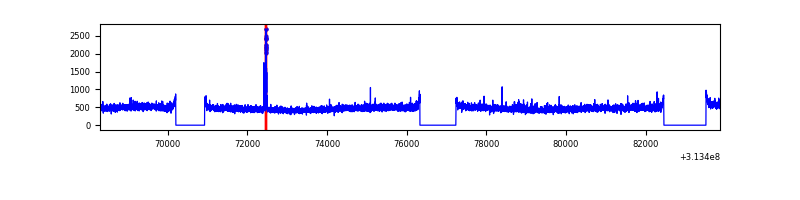 |
| B | 15568 | 12881 | 4 | 4 | 0.03% | 0.03% |  |
| C | 15568 | 12881 | 9 | 9 | 0.06% | 0.07% | 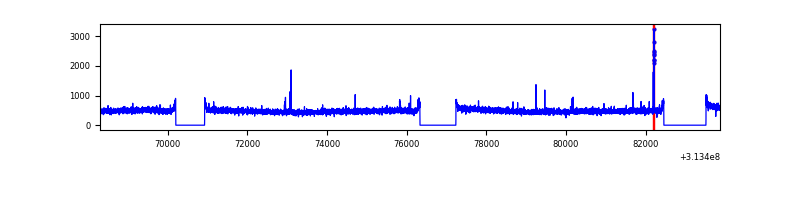 |
| D | 15568 | 12881 | 2567 | 2567 | 16.49% | 19.93% | 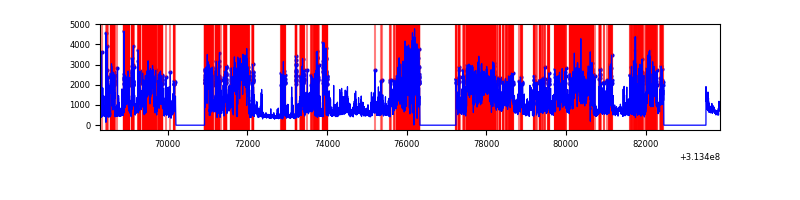 |
Top three noisy pixels from each quadrant. If the there are fewer than three noisy pixels in the level2.evt file, extra rows are filled as -1
| Pixel properties | Quadrant properties | ||||||
|---|---|---|---|---|---|---|---|
| Quadrant | DetID | PixID | Counts | Sigma | Mean | Median | Sigma |
| A | 15 | 174 | 67755 | 211.99 | 1575 | 1539 | 312.4 |
| A | 13 | 254 | 22873 | 68.3 | 1575 | 1539 | 312.4 |
| A | 8 | 205 | 18403 | 53.99 | 1575 | 1539 | 312.4 |
| B | 0 | 230 | 157409 | 531.18 | 1568 | 1529 | 293.5 |
| B | 0 | 190 | 115955 | 389.92 | 1568 | 1529 | 293.5 |
| B | 0 | 245 | 73519 | 245.31 | 1568 | 1529 | 293.5 |
| C | 14 | 238 | 237609 | 669.17 | 1517 | 1526 | 352.8 |
| C | 10 | 22 | 65963 | 182.65 | 1517 | 1526 | 352.8 |
| C | 8 | 128 | 12573 | 31.31 | 1517 | 1526 | 352.8 |
| D | 7 | 238 | 8826799 | 25780.19 | 1402 | 1361 | 342.3 |
| D | 12 | 227 | 824666 | 2404.98 | 1402 | 1361 | 342.3 |
| D | 1 | 52 | 436876 | 1272.19 | 1402 | 1361 | 342.3 |
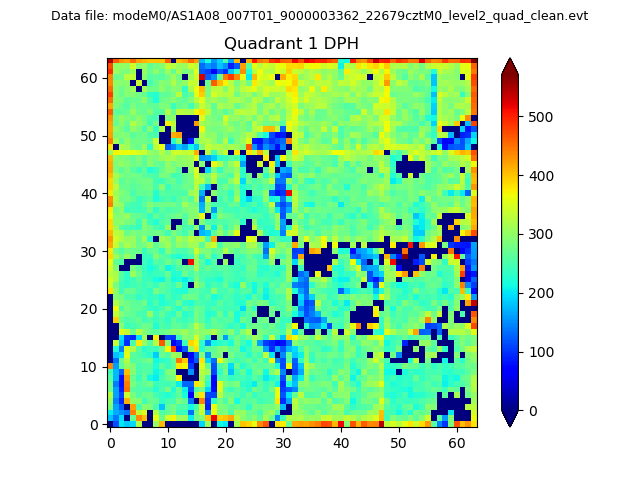
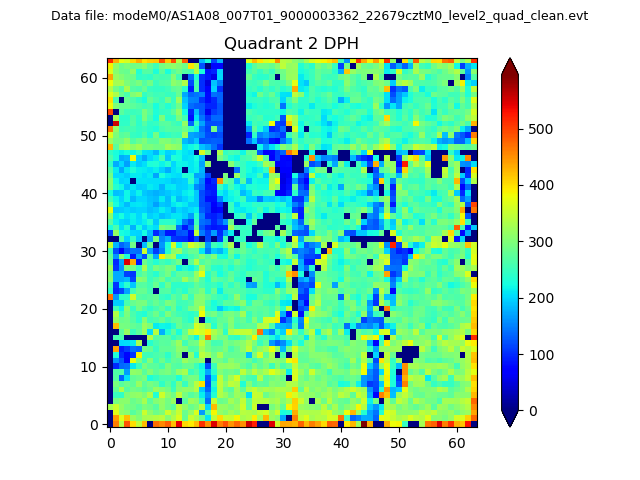
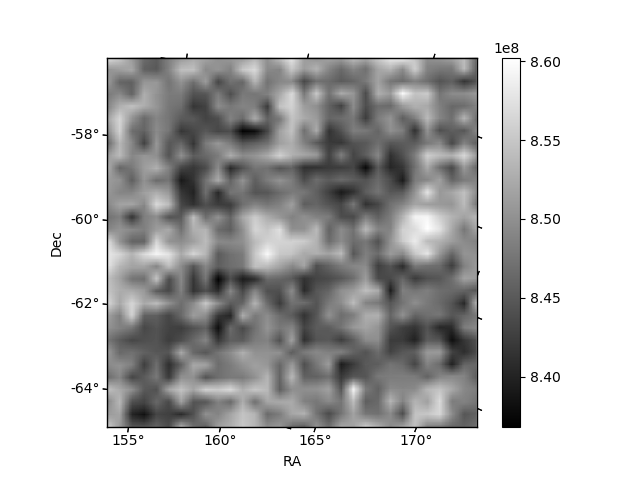
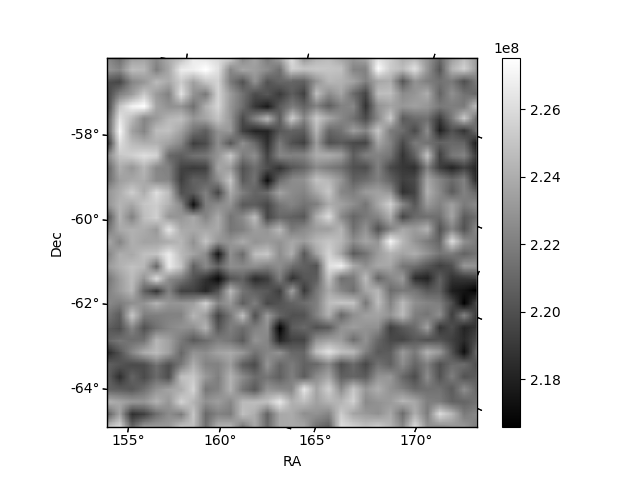
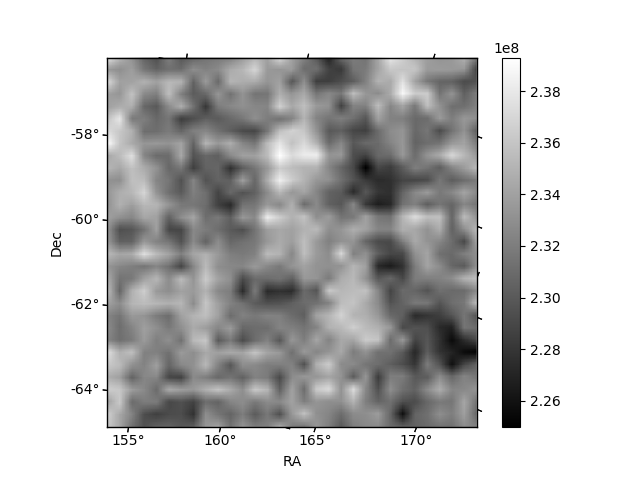
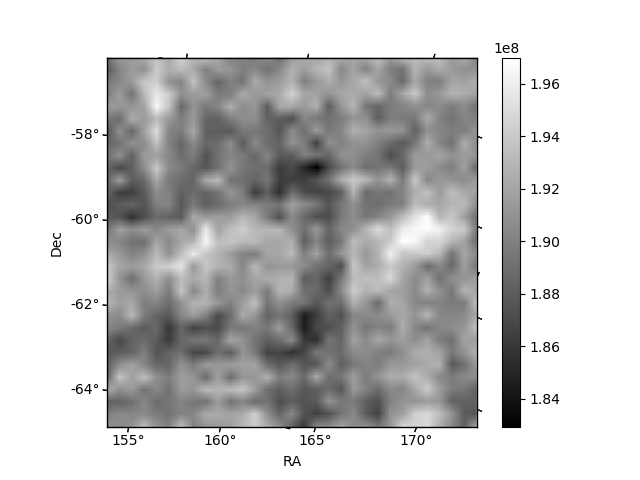
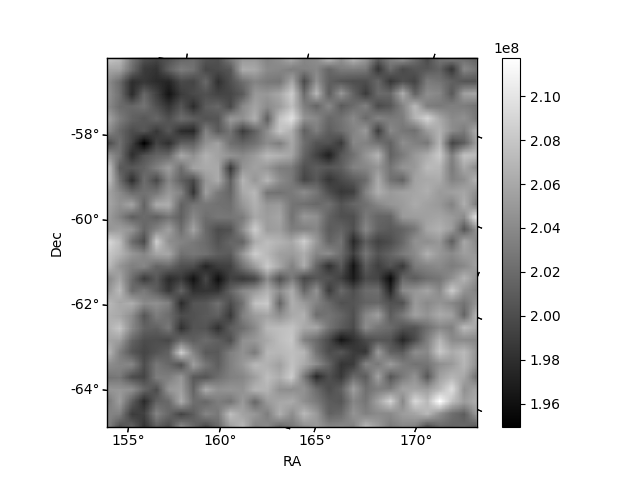
Histogram calculated using DETX and DETY for each event in the final _common_clean file
| Quadrant A | 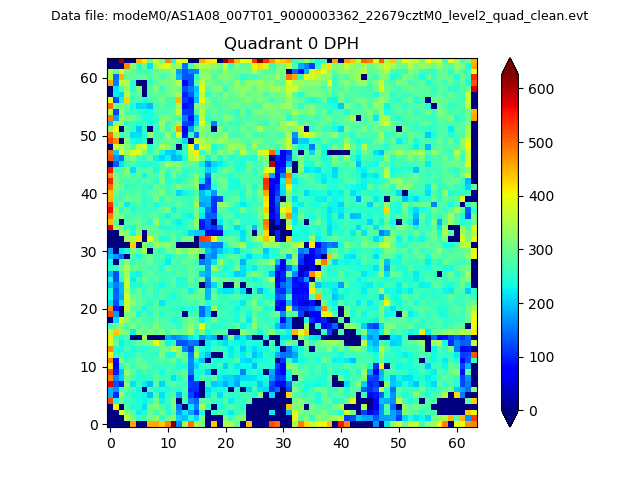 |
 |
Quadrant B |
|---|---|---|---|
| Quadrant D | 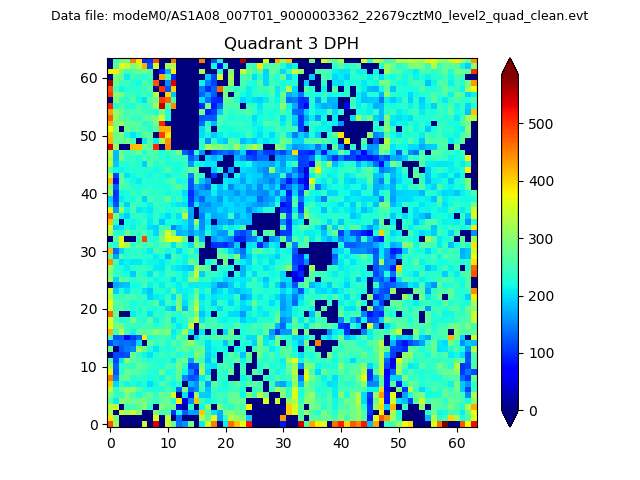 |
 |
Quadrant C |
| Plot type | Count rate plots | Images |
|---|---|---|
| Comparison with Poisson distribution Blue bars denote a histogram of data divided into 1 sec bins. Red curve is a Poisson curve with rate = median count rate of data. |
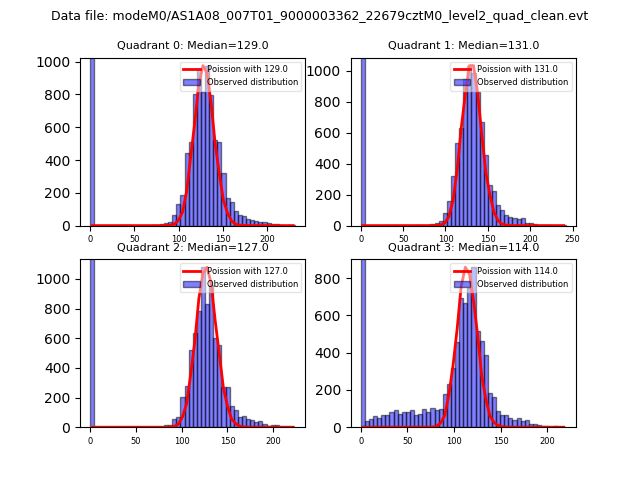 |
 |
| Quadrant-wise count rates Data is divided into 100 sec bins |
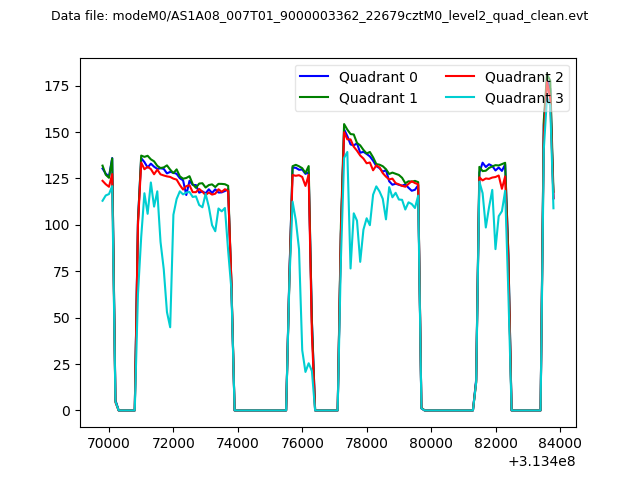 |
|
| Module-wise count rates for Quadrant A Data is divided into 100 sec bins |
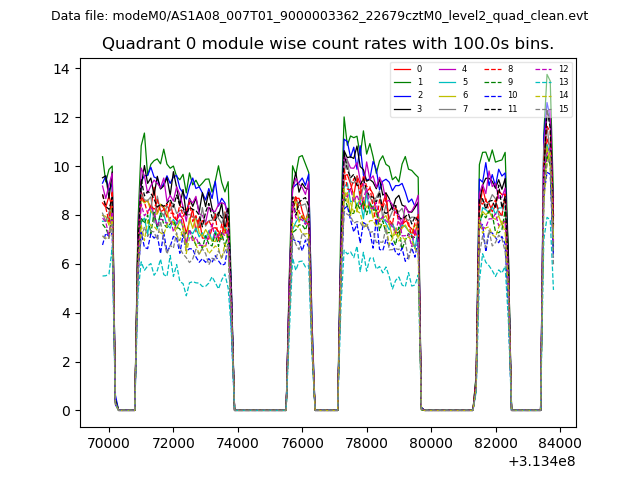 |
 |
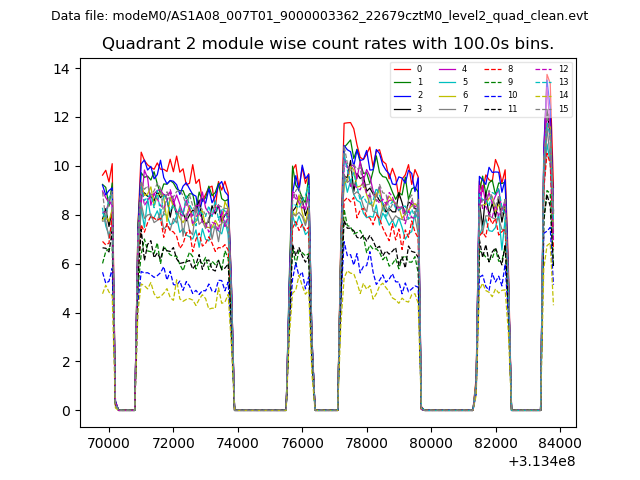
| Module-wise count rates for Quadrant B Data is divided into 100 sec bins |
 |
 |
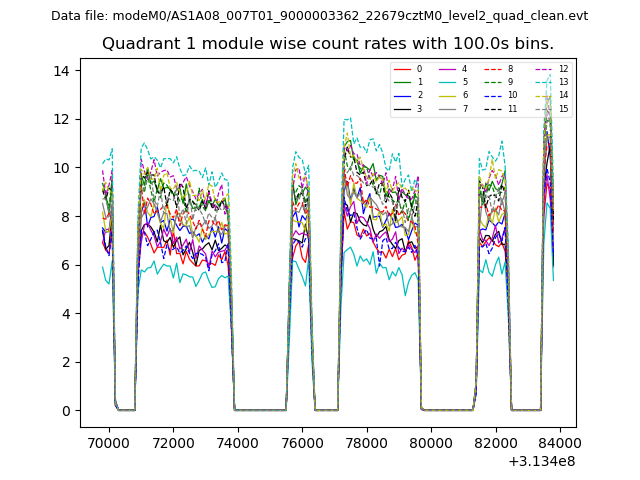
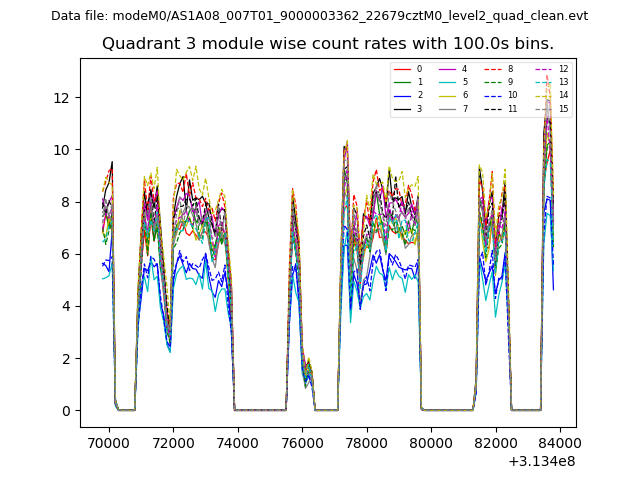
| Module-wise count rates for Quadrant C Data is divided into 100 sec bins |
 |
 |
| Module-wise count rates for Quadrant D Data is divided into 100 sec bins |
 |
 |
| Parameter | Plot |
|---|---|
| CZT HV Monitor | 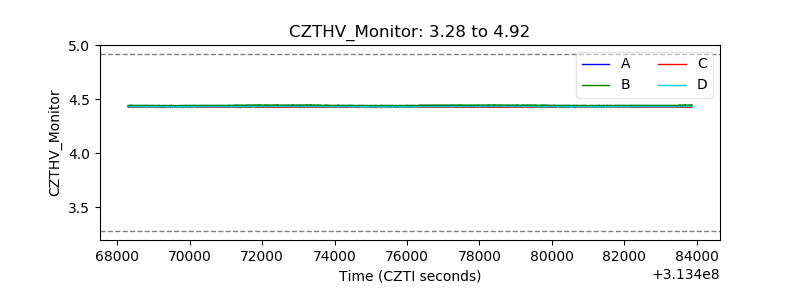 |
| D_VDD | 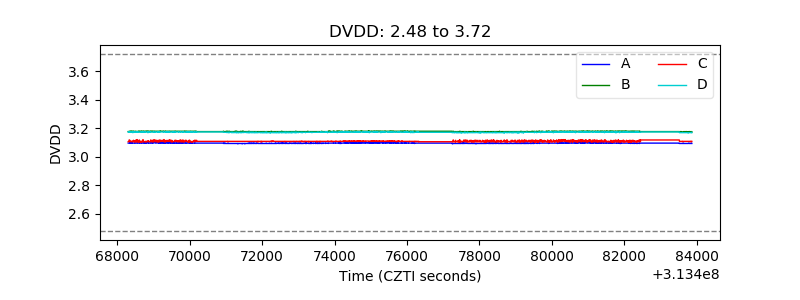 |
| Temperature 1 | 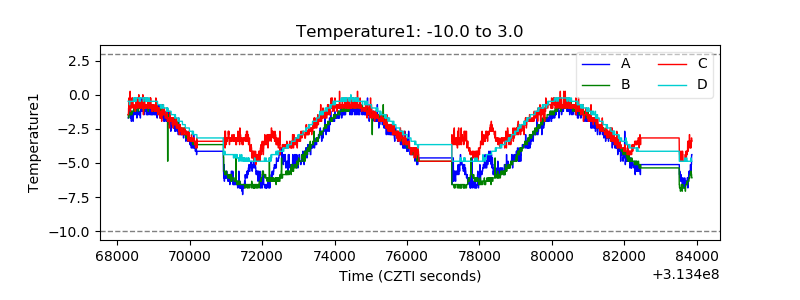 |
| Veto HV Monitor | 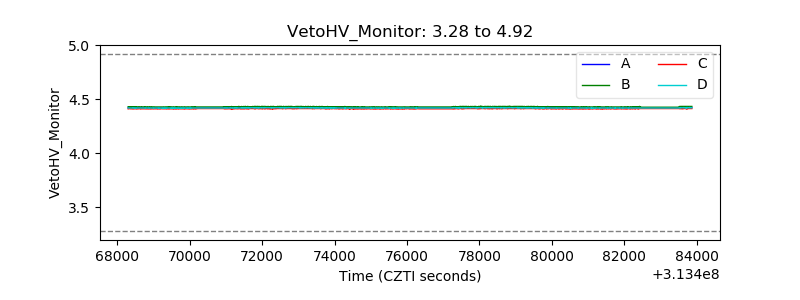 |
| Veto LLD | 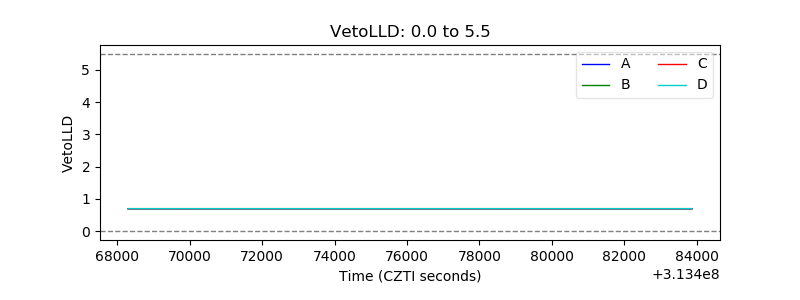 |
| Alpha Counter | 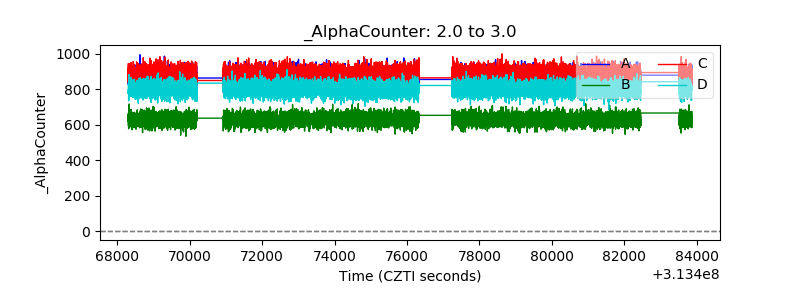 |
| _CPM_Rate | 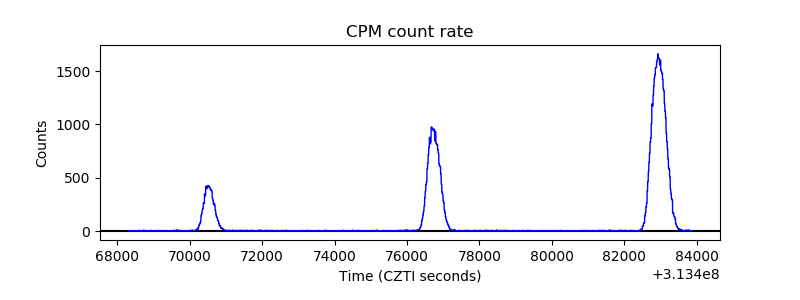 |
| CZT Counter | 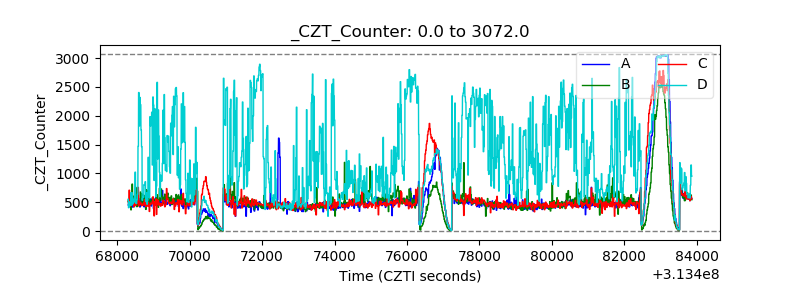 |
| +2.5 Volts monitor |  |
| +5 Volts monitor | 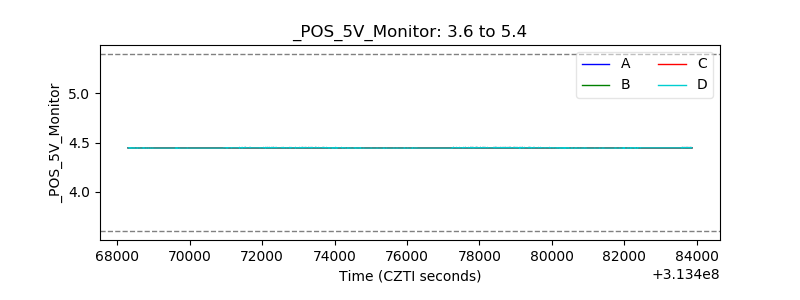 |
| _ROLL_ROT | 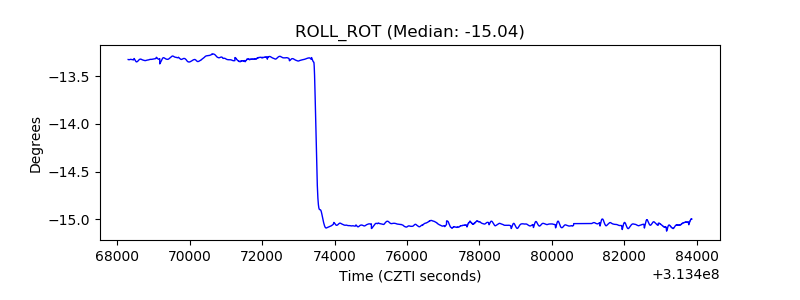 |
| _Roll_DEC | 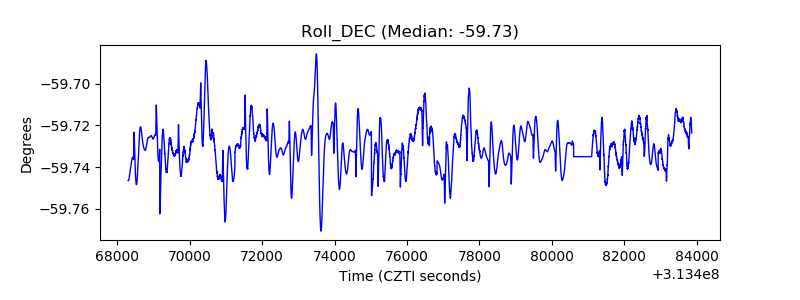 |
| _Roll_RA | 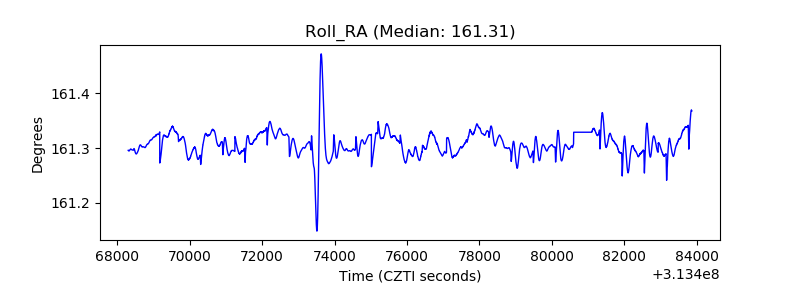 |
| Veto Counter | 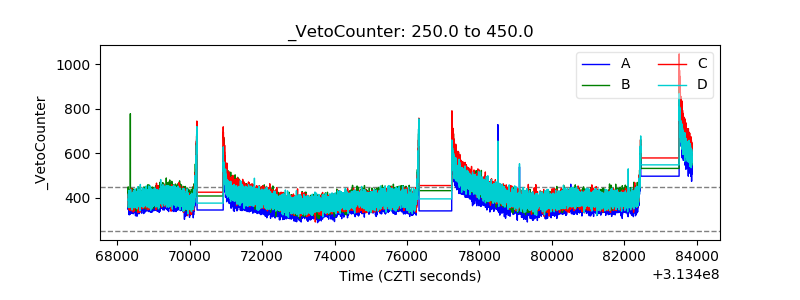 |