| Param | Original file | Final file |
|---|---|---|
| Filename | modeM0/AS1A08_007T01_9000003362_22680cztM0_level2.evt | modeM0/AS1A08_007T01_9000003362_22680cztM0_level2_quad_clean.evt |
| Size (bytes) | 894,939,840 | 182,283,840 |
| Size | 853.5 MB | 173.8 MB |
| Events in quadrant A | 5,853,474 | 1,208,897 |
| Events in quadrant B | 6,339,704 | 1,224,549 |
| Events in quadrant C | 6,007,950 | 1,167,820 |
| Events in quadrant D | 8,133,873 | 1,133,173 |
| Mode SS | |||
|---|---|---|---|
| Quadrant | BADHDUFLAG | Total packets | Discarded packets |
| A | 0 | 230 | 0 |
| B | 0 | 230 | 0 |
| C | 0 | 230 | 0 |
| D | 0 | 230 | 0 |
| Mode M0 | |||
|---|---|---|---|
| Quadrant | BADHDUFLAG | Total packets | Discarded packets |
| A | 0 | 24487 | 3 |
| B | 0 | 25873 | 3 |
| C | 0 | 25107 | 3 |
| D | 0 | 31931 | 3 |
| Mode M9 | |||
|---|---|---|---|
| Quadrant | BADHDUFLAG | Total packets | Discarded packets |
| A | 0 | 25 | 0 |
| B | 0 | 26 | 0 |
| C | 0 | 26 | 0 |
| D | 0 | 26 | 0 |
| Quadrant | Total seconds | Saturated seconds | Saturation percentage |
|---|---|---|---|
| A | 11375 | 73 | 0.641758% |
| B | 11375 | 79 | 0.694505% |
| C | 11374 | 144 | 1.266045% |
| D | 11374 | 250 | 2.197995% |
Noise dominated data is calculated using 1-second bins in cleaned event files. If a bin has >2000 counts, and if more than 50% of those come from <1% of pixels, then it is considered to be noise-dominated and hence unusable.
| Quadrant | # 1 sec bins | Bins with >0 counts | Bins with >2000 counts | High rate bins dominated by noise | Noise dominated (total time) | Noise dominated (detector-on time) | Marked lightcurve |
|---|---|---|---|---|---|---|---|
| A | 13835 | 11377 | 0 | 0 | 0.00% | 0.00% |  |
| B | 13835 | 11377 | 1 | 1 | 0.01% | 0.01% |  |
| C | 13834 | 11376 | 8 | 8 | 0.06% | 0.07% | 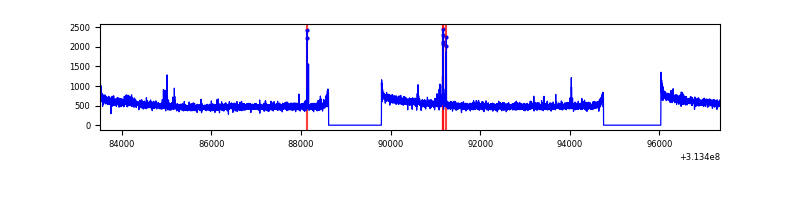 |
| D | 13834 | 11376 | 93 | 93 | 0.67% | 0.82% | 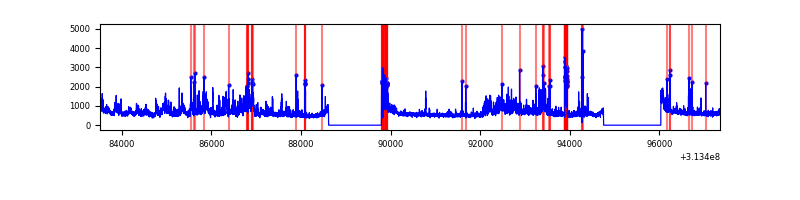 |
Top three noisy pixels from each quadrant. If the there are fewer than three noisy pixels in the level2.evt file, extra rows are filled as -1
| Pixel properties | Quadrant properties | ||||||
|---|---|---|---|---|---|---|---|
| Quadrant | DetID | PixID | Counts | Sigma | Mean | Median | Sigma |
| A | 13 | 254 | 20584 | 63.85 | 1515 | 1487 | 299.1 |
| A | 0 | 226 | 13666 | 40.72 | 1515 | 1487 | 299.1 |
| A | 3 | 137 | 11296 | 32.8 | 1515 | 1487 | 299.1 |
| B | 0 | 230 | 211046 | 764.9 | 1496 | 1462 | 274.0 |
| B | 0 | 219 | 113436 | 408.66 | 1496 | 1462 | 274.0 |
| B | 0 | 229 | 46603 | 164.75 | 1496 | 1462 | 274.0 |
| C | 14 | 238 | 233606 | 698.2 | 1454 | 1464 | 332.5 |
| C | 10 | 22 | 84086 | 248.5 | 1454 | 1464 | 332.5 |
| C | 3 | 233 | 15930 | 43.51 | 1454 | 1464 | 332.5 |
| D | 12 | 227 | 892641 | 2491.39 | 1478 | 1438 | 357.7 |
| D | 7 | 238 | 686407 | 1914.85 | 1478 | 1438 | 357.7 |
| D | 12 | 235 | 318679 | 886.86 | 1478 | 1438 | 357.7 |
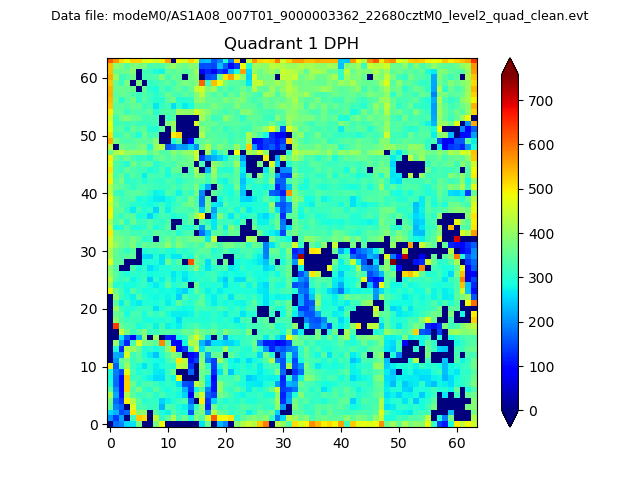
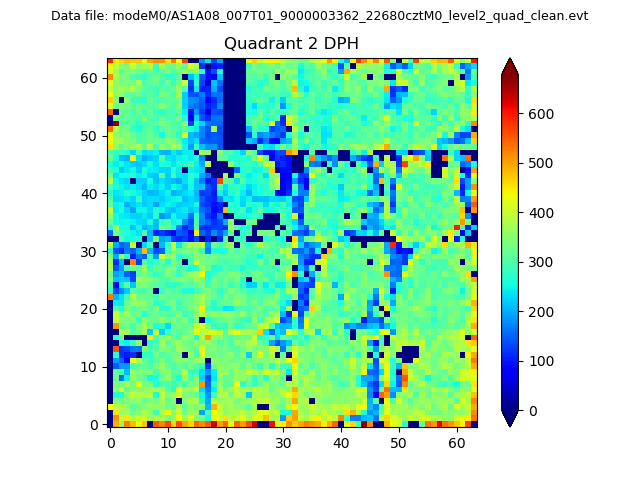
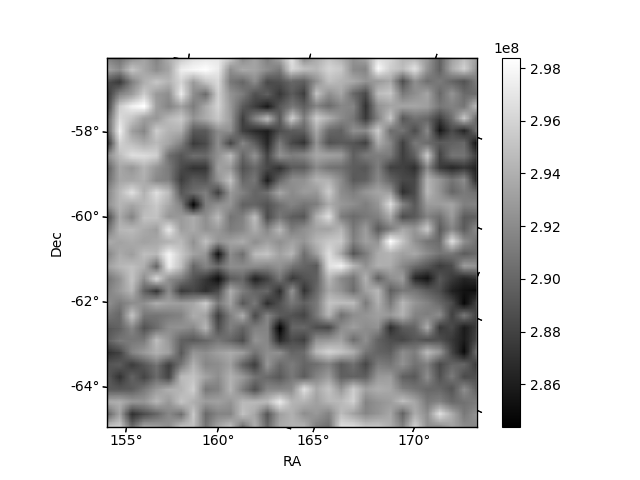
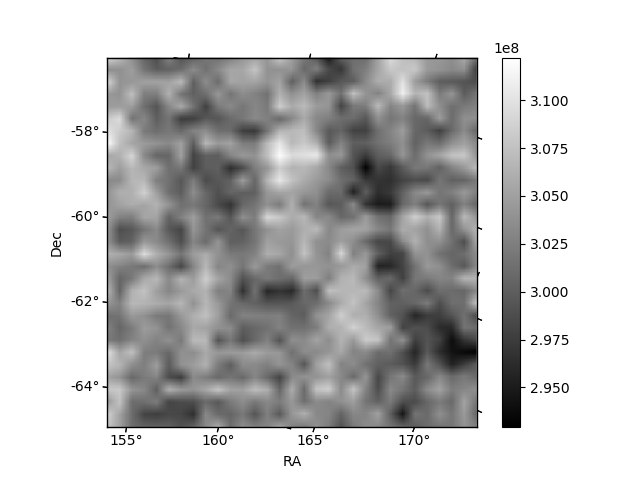
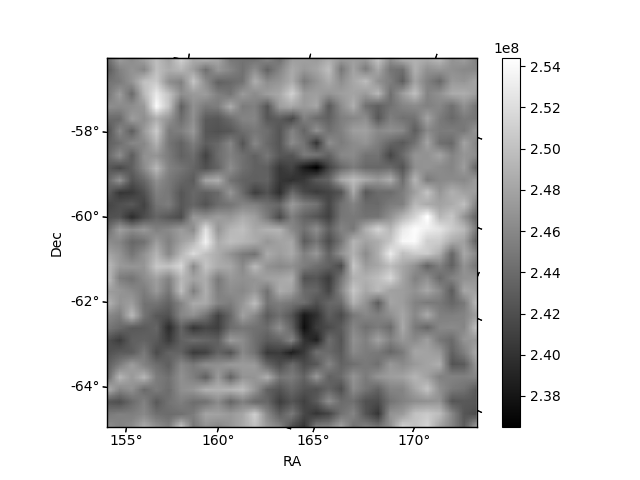
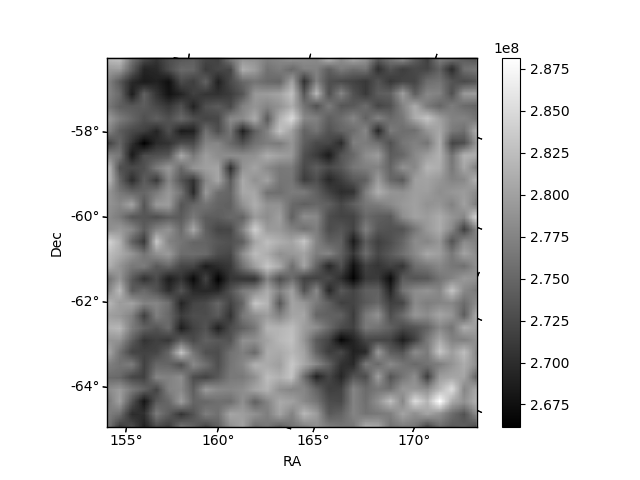
Histogram calculated using DETX and DETY for each event in the final _common_clean file
| Quadrant A |  |
 |
Quadrant B |
|---|---|---|---|
| Quadrant D | 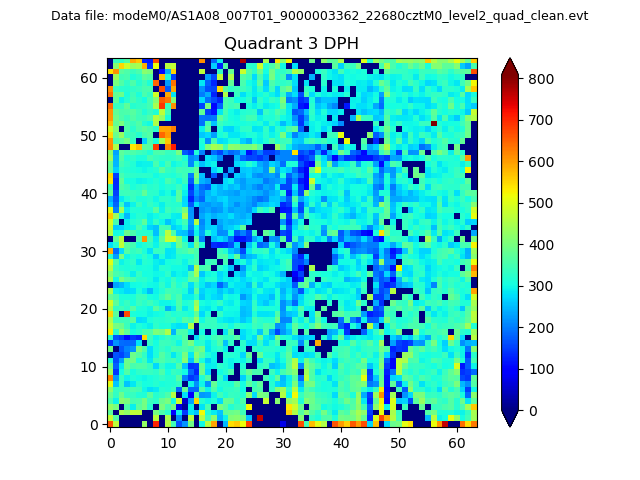 |
 |
Quadrant C |
| Plot type | Count rate plots | Images |
|---|---|---|
| Comparison with Poisson distribution Blue bars denote a histogram of data divided into 1 sec bins. Red curve is a Poisson curve with rate = median count rate of data. |
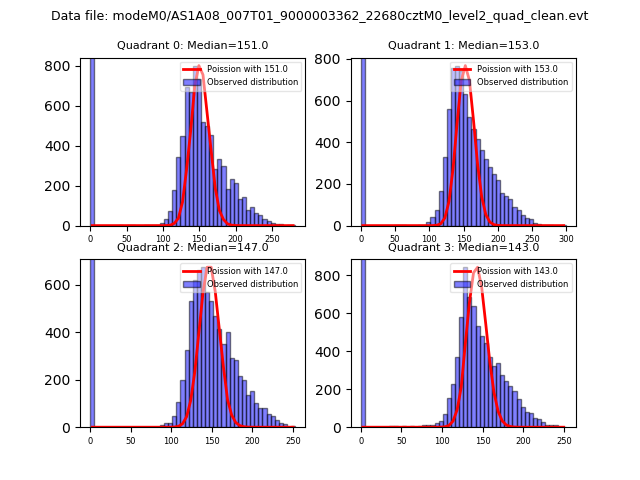 |
 |
| Quadrant-wise count rates Data is divided into 100 sec bins |
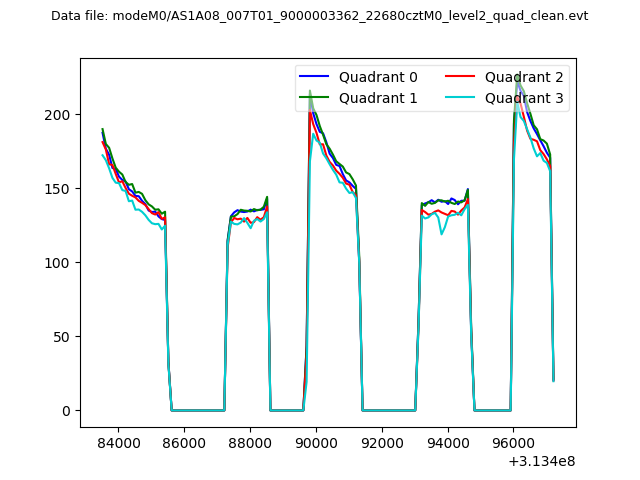 |
|
| Module-wise count rates for Quadrant A Data is divided into 100 sec bins |
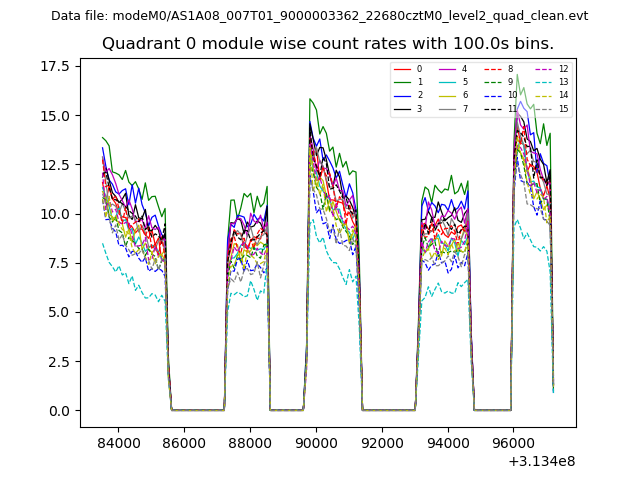 |
 |
| Module-wise count rates for Quadrant B Data is divided into 100 sec bins |
 |
 |
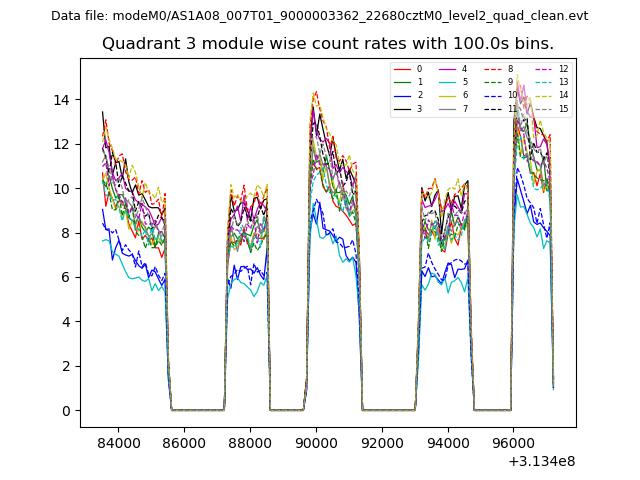
| Module-wise count rates for Quadrant C Data is divided into 100 sec bins |
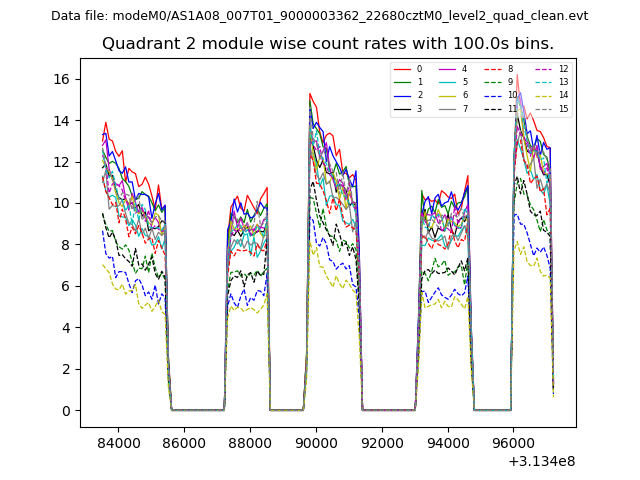 |
 |
| Module-wise count rates for Quadrant D Data is divided into 100 sec bins |
 |
 |
| Parameter | Plot |
|---|---|
| CZT HV Monitor | 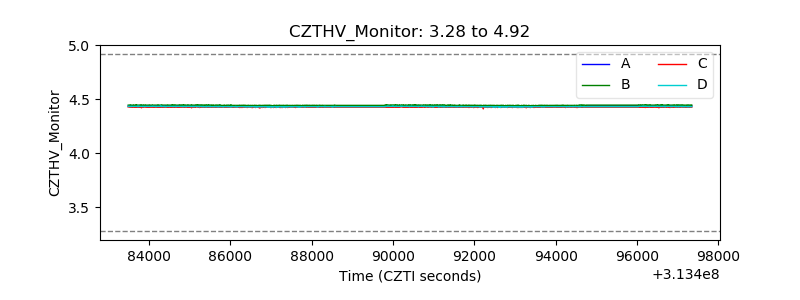 |
| D_VDD | 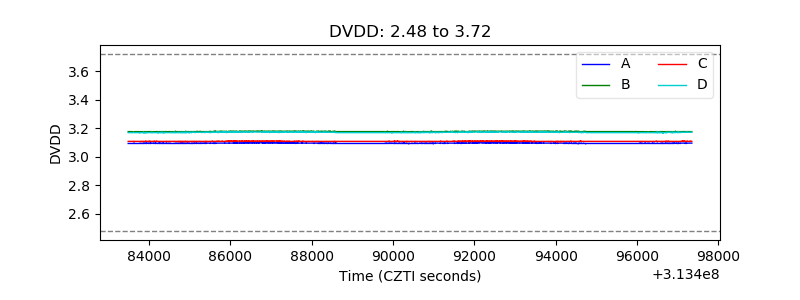 |
| Temperature 1 | 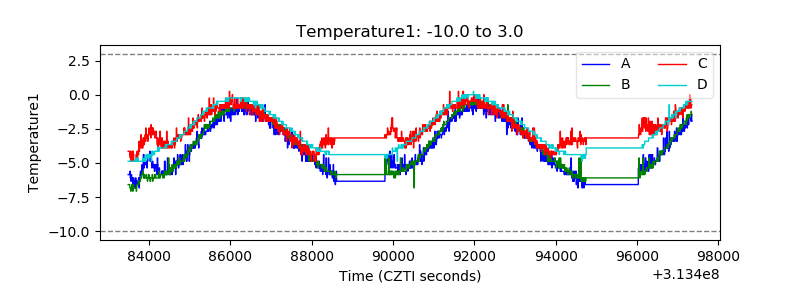 |
| Veto HV Monitor | 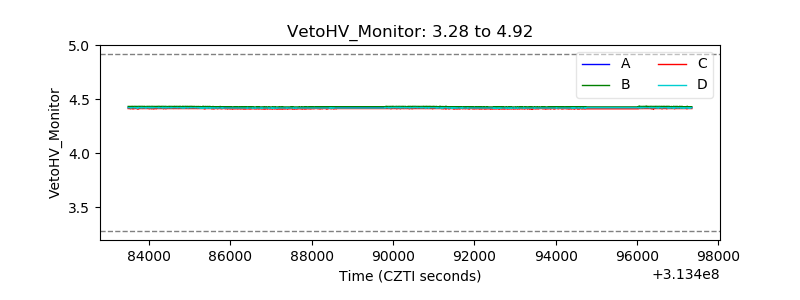 |
| Veto LLD | 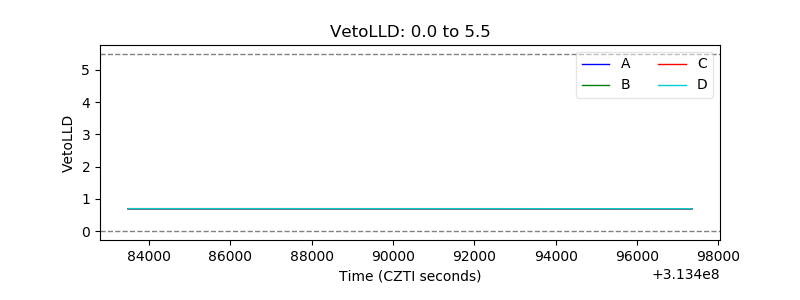 |
| Alpha Counter | 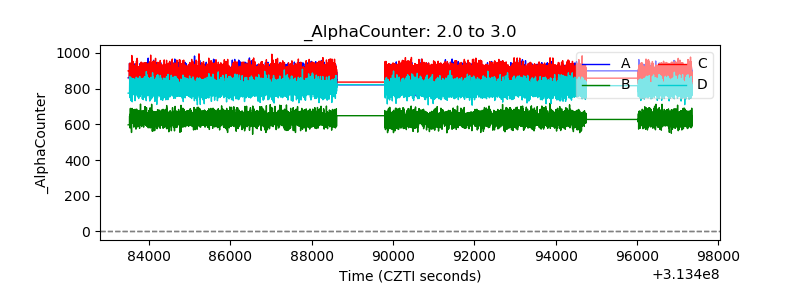 |
| _CPM_Rate | 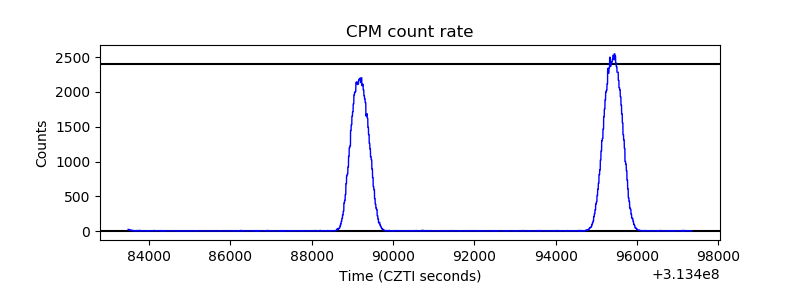 |
| CZT Counter | 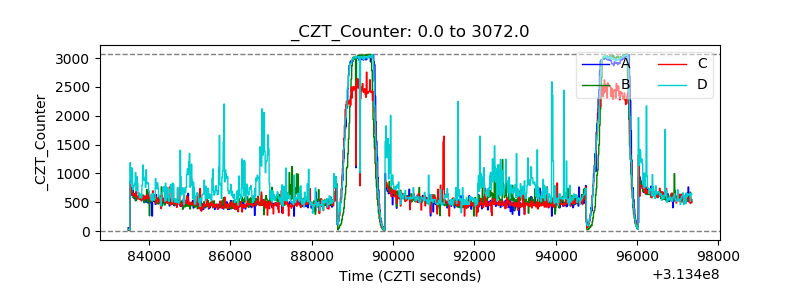 |
| +2.5 Volts monitor |  |
| +5 Volts monitor |  |
| _ROLL_ROT | 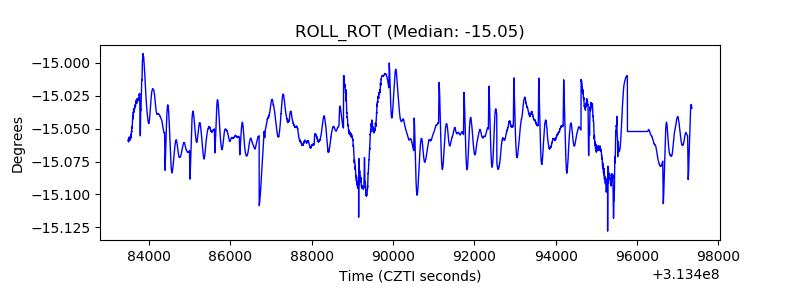 |
| _Roll_DEC | 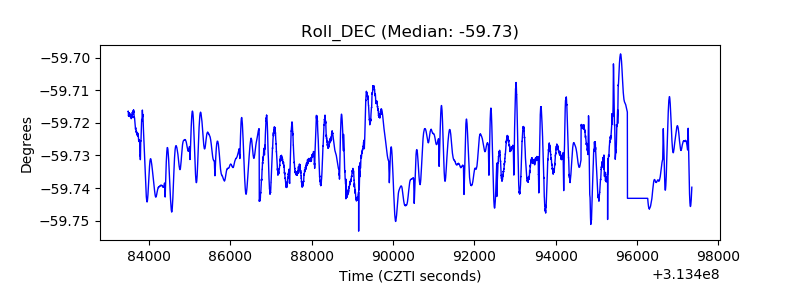 |
| _Roll_RA | 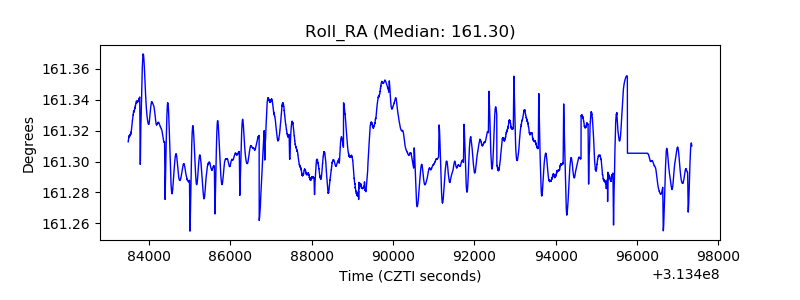 |
| Veto Counter | 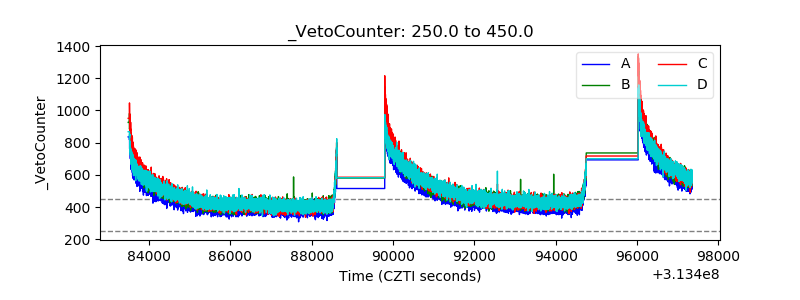 |