| Param | Original file | Final file |
|---|---|---|
| Filename | modeM0/AS1A08_007T01_9000003362_22682cztM0_level2.evt | modeM0/AS1A08_007T01_9000003362_22682cztM0_level2_quad_clean.evt |
| Size (bytes) | 587,612,160 | 89,444,160 |
| Size | 560.4 MB | 85.3 MB |
| Events in quadrant A | 3,604,299 | 587,428 |
| Events in quadrant B | 3,891,856 | 589,324 |
| Events in quadrant C | 3,565,422 | 550,923 |
| Events in quadrant D | 6,293,157 | 526,336 |
| Mode SS | |||
|---|---|---|---|
| Quadrant | BADHDUFLAG | Total packets | Discarded packets |
| A | 0 | 132 | 0 |
| B | 0 | 132 | 0 |
| C | 0 | 132 | 0 |
| D | 0 | 132 | 0 |
| Mode M0 | |||
|---|---|---|---|
| Quadrant | BADHDUFLAG | Total packets | Discarded packets |
| A | 0 | 14790 | 2 |
| B | 0 | 15944 | 3 |
| C | 0 | 14626 | 2 |
| D | 0 | 23505 | 2 |
| Mode M9 | |||
|---|---|---|---|
| Quadrant | BADHDUFLAG | Total packets | Discarded packets |
| A | 0 | 15 | 0 |
| B | 0 | 16 | 0 |
| C | 0 | 16 | 0 |
| D | 0 | 16 | 0 |
| Quadrant | Total seconds | Saturated seconds | Saturation percentage |
|---|---|---|---|
| A | 6521 | 105 | 1.610182% |
| B | 6520 | 120 | 1.840491% |
| C | 6520 | 154 | 2.361963% |
| D | 6520 | 395 | 6.058282% |
Noise dominated data is calculated using 1-second bins in cleaned event files. If a bin has >2000 counts, and if more than 50% of those come from <1% of pixels, then it is considered to be noise-dominated and hence unusable.
| Quadrant | # 1 sec bins | Bins with >0 counts | Bins with >2000 counts | High rate bins dominated by noise | Noise dominated (total time) | Noise dominated (detector-on time) | Marked lightcurve |
|---|---|---|---|---|---|---|---|
| A | 7856 | 6522 | 0 | 0 | 0.00% | 0.00% | 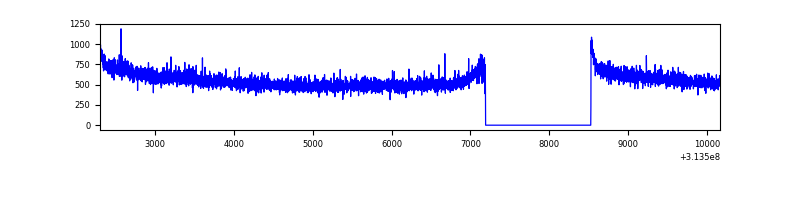 |
| B | 7855 | 6521 | 5 | 5 | 0.06% | 0.08% | 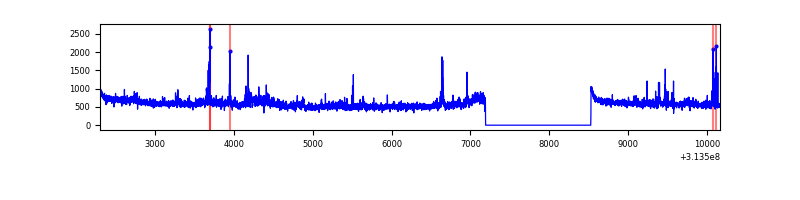 |
| C | 7855 | 6521 | 1 | 1 | 0.01% | 0.02% | 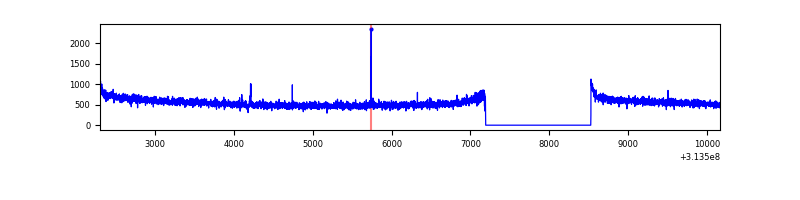 |
| D | 7855 | 6521 | 231 | 231 | 2.94% | 3.54% | 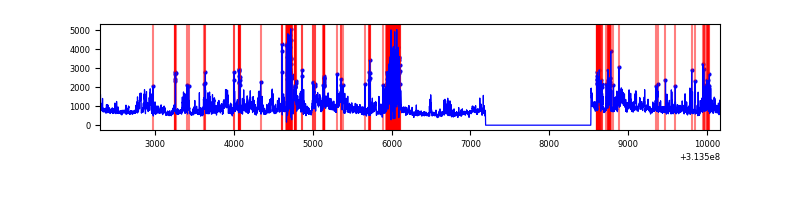 |
Top three noisy pixels from each quadrant. If the there are fewer than three noisy pixels in the level2.evt file, extra rows are filled as -1
| Pixel properties | Quadrant properties | ||||||
|---|---|---|---|---|---|---|---|
| Quadrant | DetID | PixID | Counts | Sigma | Mean | Median | Sigma |
| A | 13 | 254 | 12267 | 62.6 | 932 | 918 | 181.3 |
| A | 0 | 226 | 8372 | 41.12 | 932 | 918 | 181.3 |
| A | 14 | 250 | 6813 | 32.52 | 932 | 918 | 181.3 |
| B | 0 | 219 | 100753 | 600.0 | 917 | 900 | 166.4 |
| B | 0 | 230 | 81028 | 481.48 | 917 | 900 | 166.4 |
| B | 0 | 228 | 49054 | 289.35 | 917 | 900 | 166.4 |
| C | 14 | 238 | 142647 | 713.71 | 873 | 883 | 198.6 |
| C | 10 | 22 | 7141 | 31.51 | 873 | 883 | 198.6 |
| C | 2 | 16 | 7080 | 31.2 | 873 | 883 | 198.6 |
| D | 12 | 235 | 970006 | 4573.93 | 882 | 858 | 211.9 |
| D | 1 | 52 | 957367 | 4514.28 | 882 | 858 | 211.9 |
| D | 12 | 227 | 393430 | 1852.76 | 882 | 858 | 211.9 |
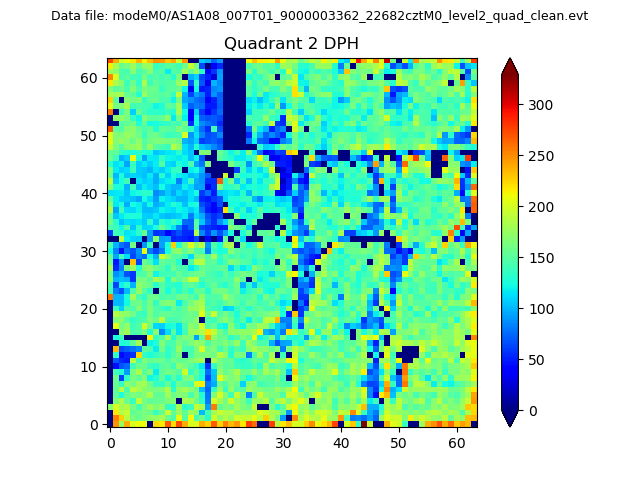
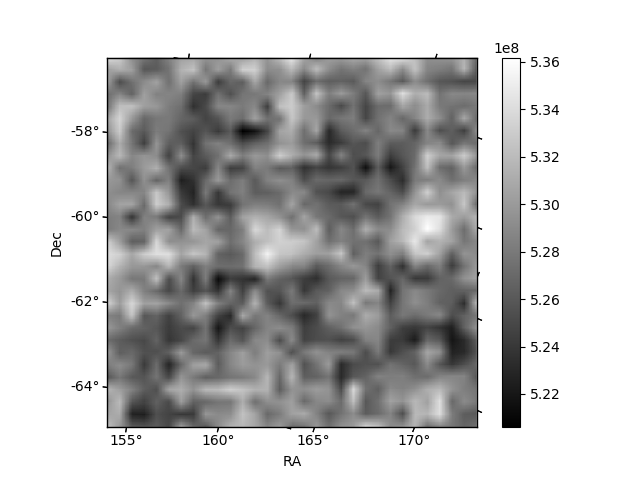
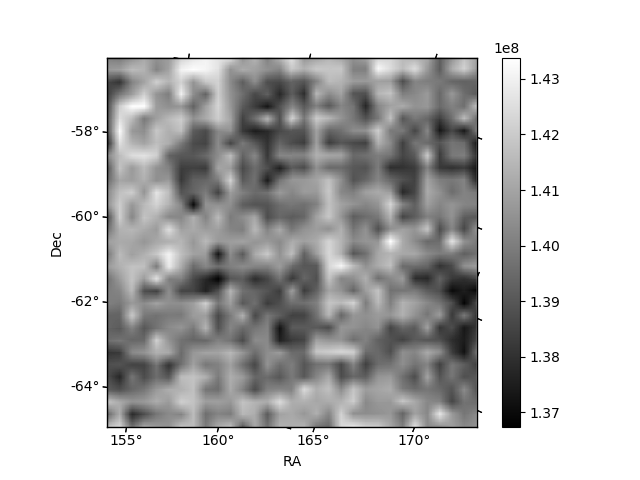
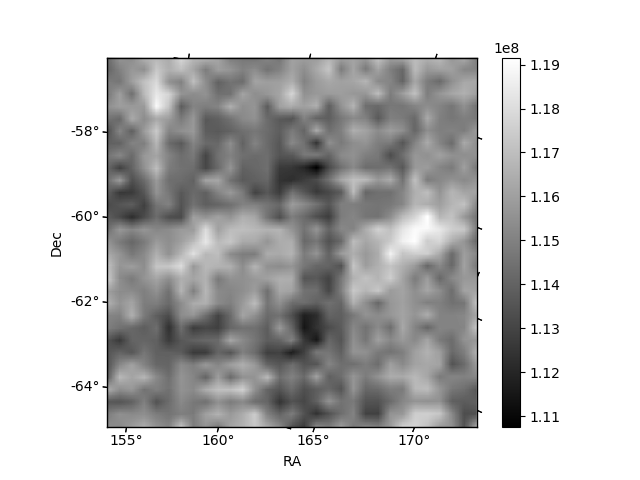
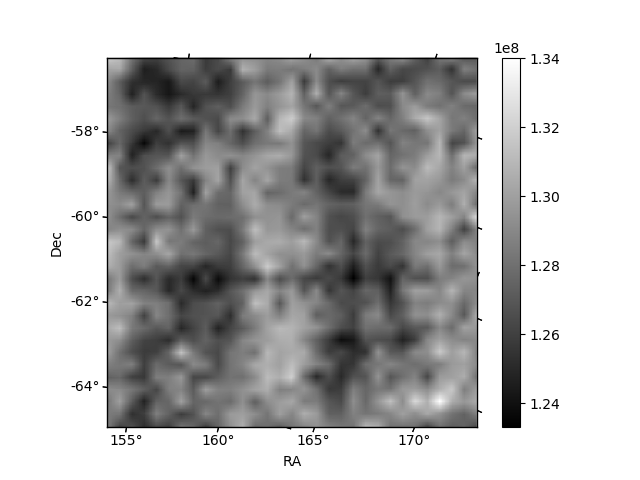
Histogram calculated using DETX and DETY for each event in the final _common_clean file
| Quadrant A | 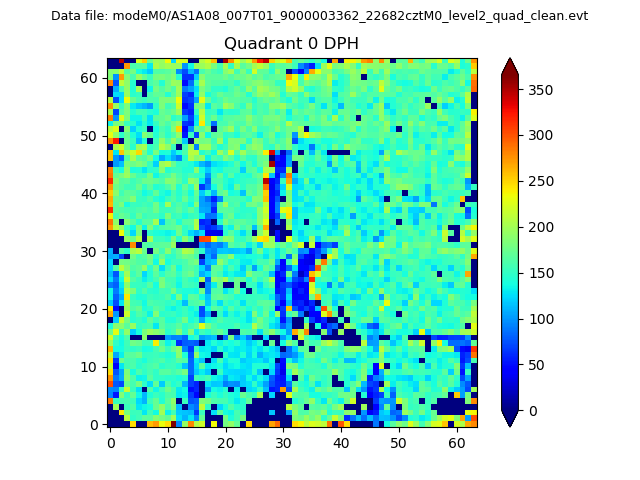 |
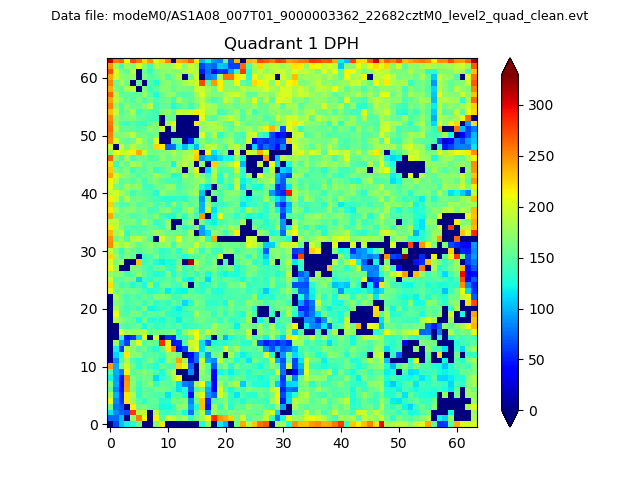 |
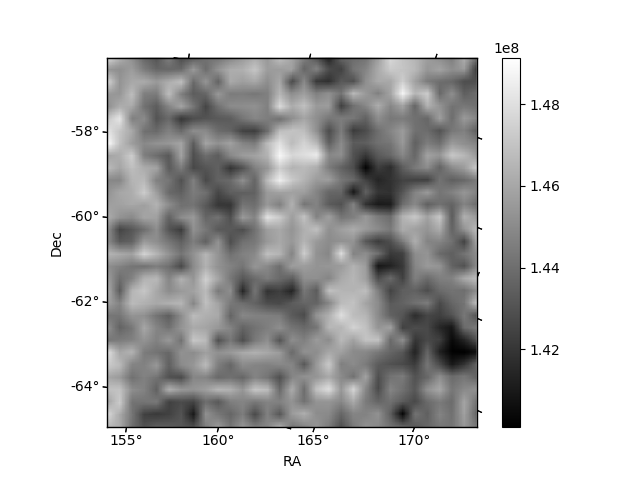
Quadrant B |
|---|---|---|---|
| Quadrant D | 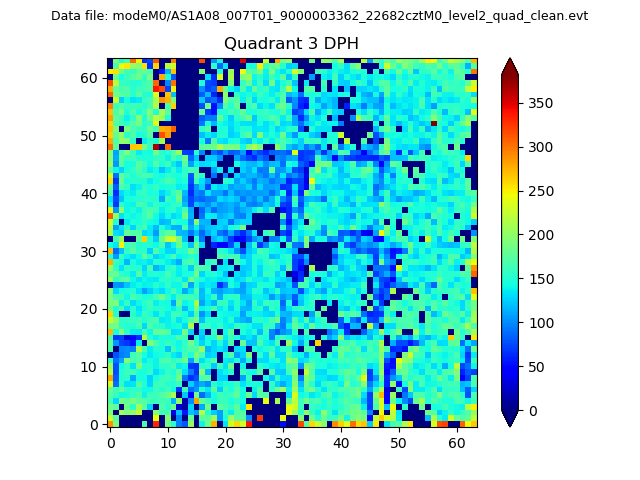 |
 |
Quadrant C |
| Plot type | Count rate plots | Images |
|---|---|---|
| Comparison with Poisson distribution Blue bars denote a histogram of data divided into 1 sec bins. Red curve is a Poisson curve with rate = median count rate of data. |
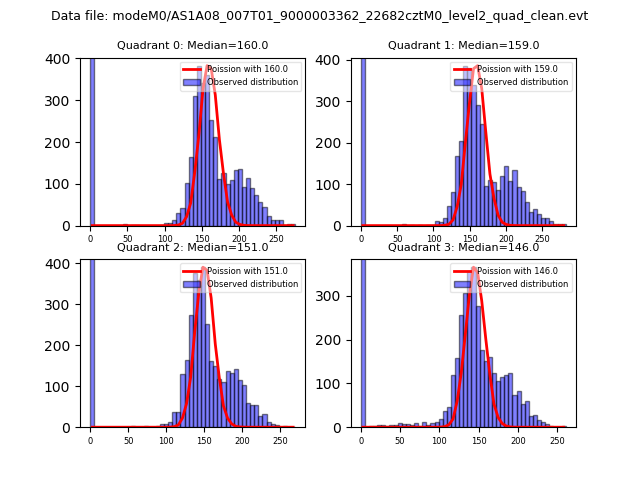 |
 |
| Quadrant-wise count rates Data is divided into 100 sec bins |
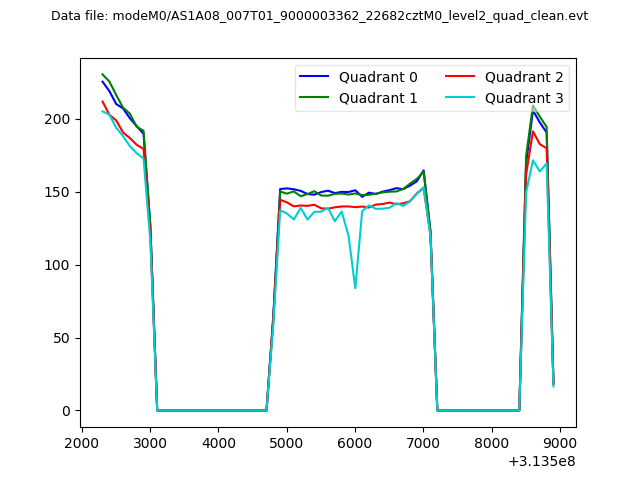 |
|
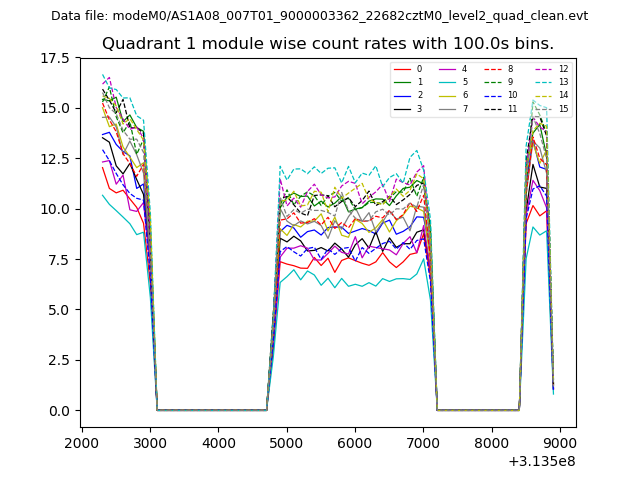
| Module-wise count rates for Quadrant A Data is divided into 100 sec bins |
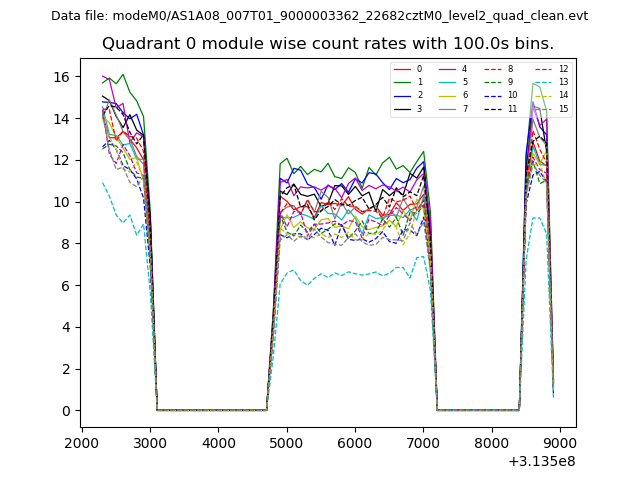 |
 |
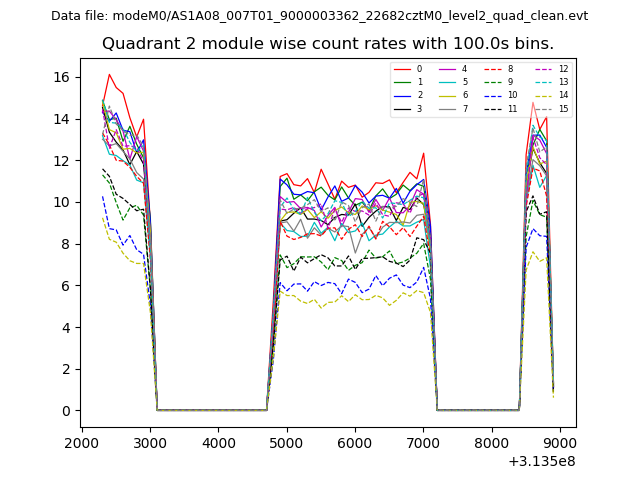
| Module-wise count rates for Quadrant B Data is divided into 100 sec bins |
 |
 |
| Module-wise count rates for Quadrant C Data is divided into 100 sec bins |
 |
 |
| Module-wise count rates for Quadrant D Data is divided into 100 sec bins |
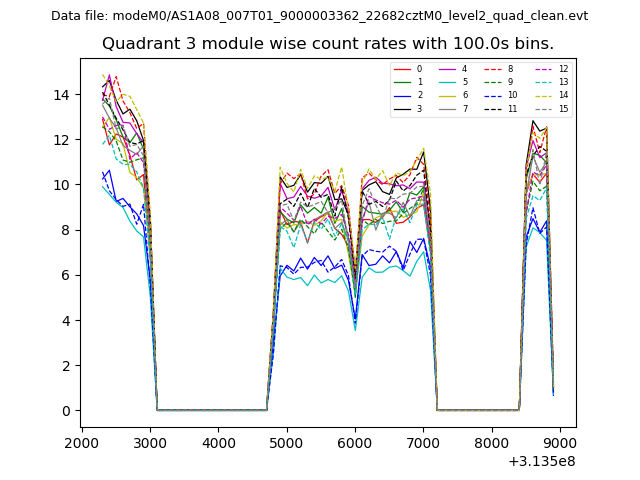 |
 |
| Parameter | Plot |
|---|---|
| CZT HV Monitor | 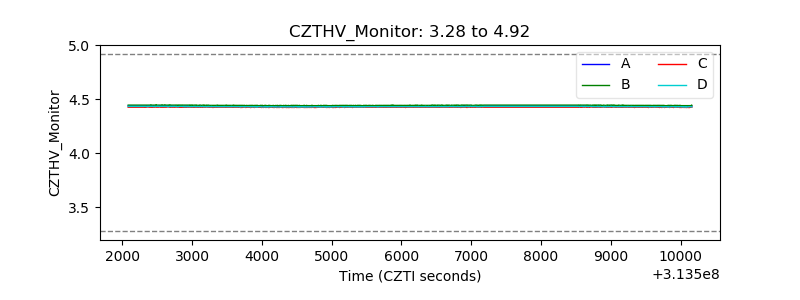 |
| D_VDD |  |
| Temperature 1 | 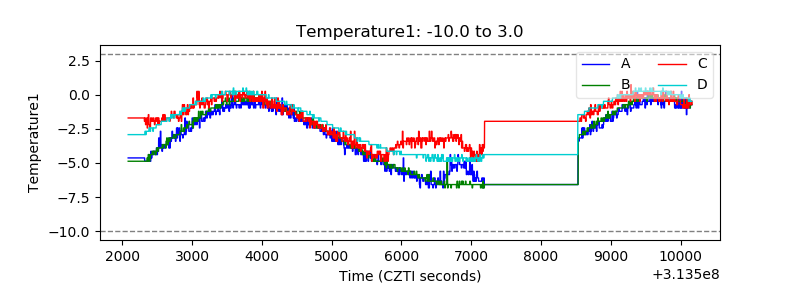 |
| Veto HV Monitor | 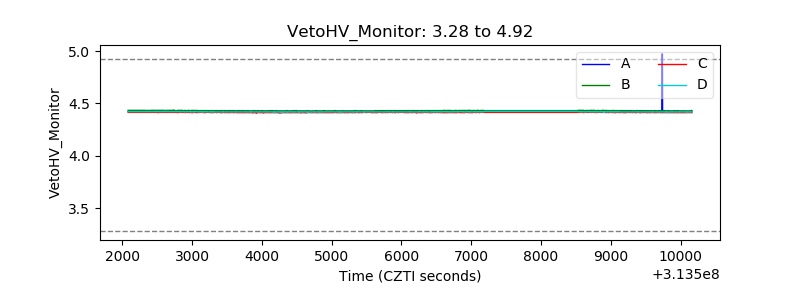 |
| Veto LLD | 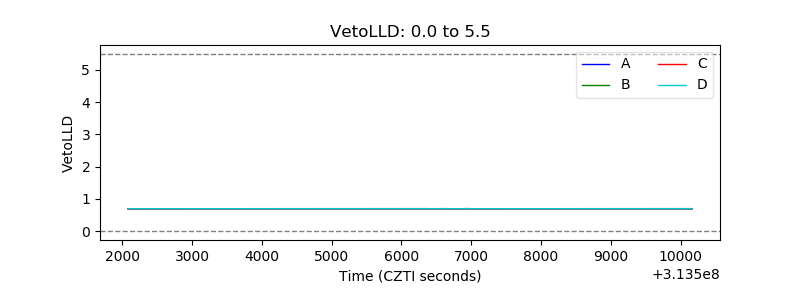 |
| Alpha Counter | 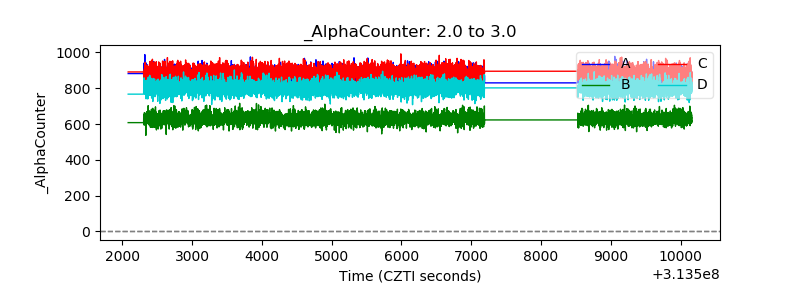 |
| _CPM_Rate | 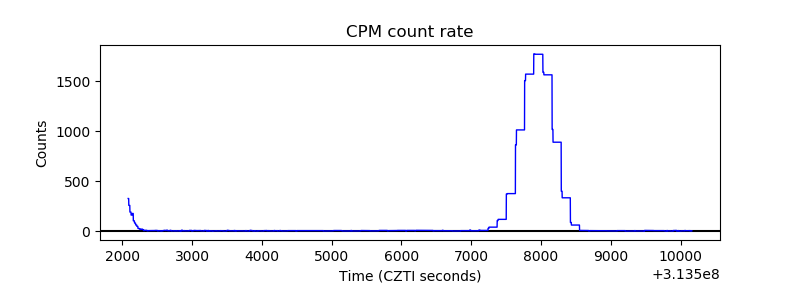 |
| CZT Counter | 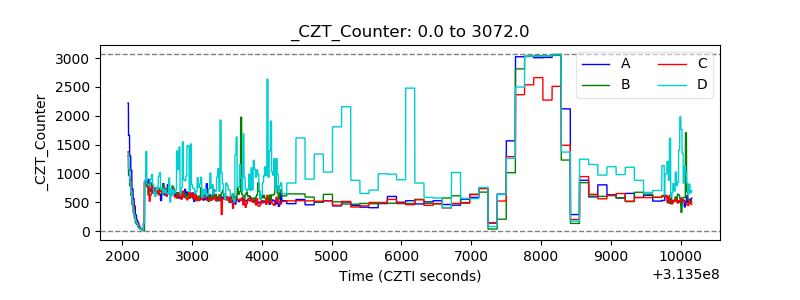 |
| +2.5 Volts monitor |  |
| +5 Volts monitor |  |
| _ROLL_ROT | 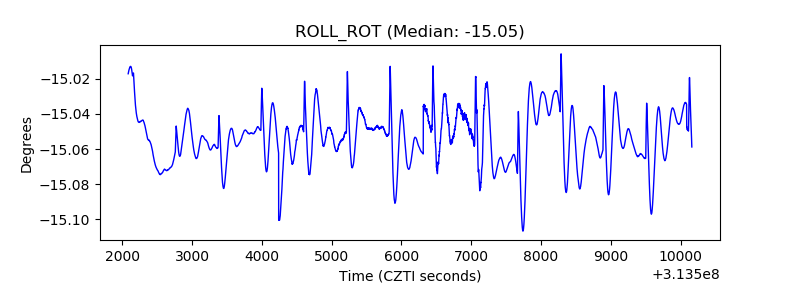 |
| _Roll_DEC | 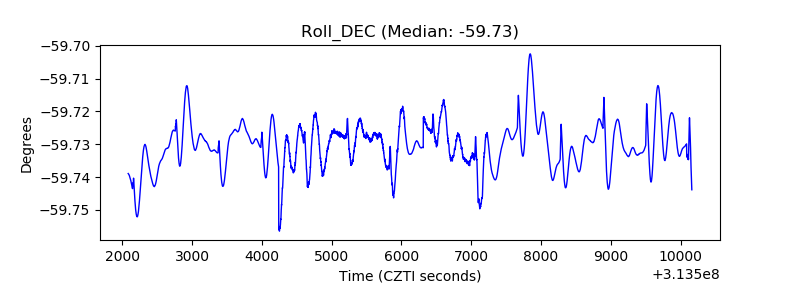 |
| _Roll_RA | 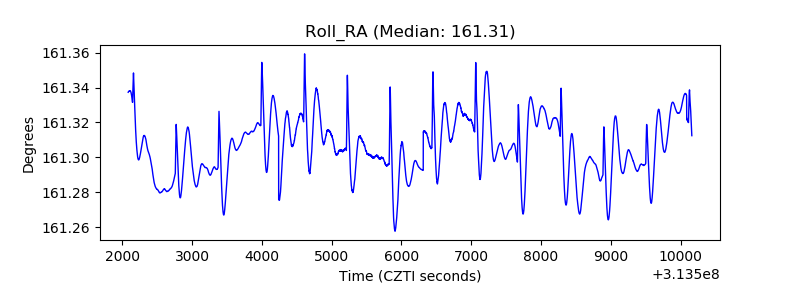 |
| Veto Counter | 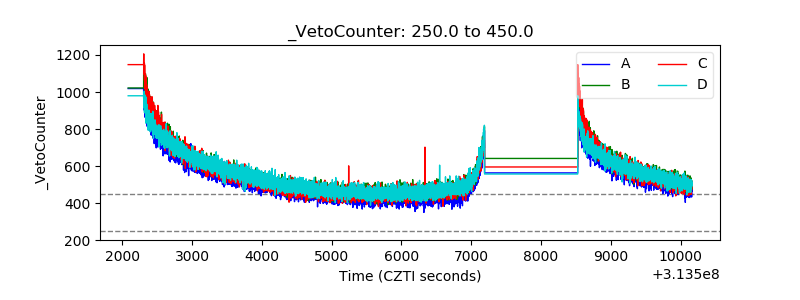 |