| Param | Original file | Final file |
|---|---|---|
| Filename | modeM0/AS1A08_007T01_9000003362_22685cztM0_level2.evt | modeM0/AS1A08_007T01_9000003362_22685cztM0_level2_quad_clean.evt |
| Size (bytes) | 512,786,880 | 91,958,400 |
| Size | 489.0 MB | 87.7 MB |
| Events in quadrant A | 3,402,993 | 587,658 |
| Events in quadrant B | 3,656,776 | 589,899 |
| Events in quadrant C | 3,491,877 | 563,289 |
| Events in quadrant D | 4,498,403 | 551,741 |
| Mode SS | |||
|---|---|---|---|
| Quadrant | BADHDUFLAG | Total packets | Discarded packets |
| A | 0 | 142 | 0 |
| B | 0 | 142 | 0 |
| C | 0 | 142 | 0 |
| D | 0 | 142 | 0 |
| Mode M0 | |||
|---|---|---|---|
| Quadrant | BADHDUFLAG | Total packets | Discarded packets |
| A | 0 | 14624 | 2 |
| B | 0 | 15172 | 2 |
| C | 0 | 14871 | 2 |
| D | 0 | 18136 | 2 |
| Mode M9 | |||
|---|---|---|---|
| Quadrant | BADHDUFLAG | Total packets | Discarded packets |
| A | 0 | 9 | 0 |
| B | 0 | 10 | 0 |
| C | 0 | 10 | 0 |
| D | 0 | 10 | 0 |
| Quadrant | Total seconds | Saturated seconds | Saturation percentage |
|---|---|---|---|
| A | 7072 | 77 | 1.088801% |
| B | 7072 | 100 | 1.414027% |
| C | 7072 | 129 | 1.824095% |
| D | 7071 | 244 | 3.450714% |
Noise dominated data is calculated using 1-second bins in cleaned event files. If a bin has >2000 counts, and if more than 50% of those come from <1% of pixels, then it is considered to be noise-dominated and hence unusable.
| Quadrant | # 1 sec bins | Bins with >0 counts | Bins with >2000 counts | High rate bins dominated by noise | Noise dominated (total time) | Noise dominated (detector-on time) | Marked lightcurve |
|---|---|---|---|---|---|---|---|
| A | 7612 | 7073 | 0 | 0 | 0.00% | 0.00% |  |
| B | 7612 | 7073 | 2 | 2 | 0.03% | 0.03% | 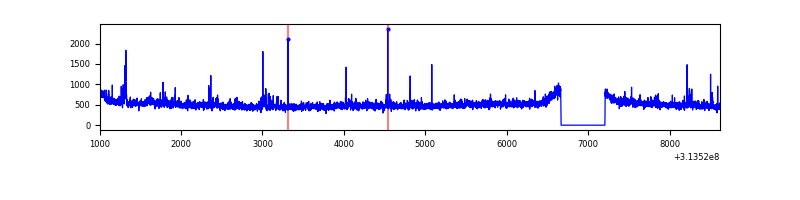 |
| C | 7612 | 7073 | 25 | 25 | 0.33% | 0.35% | 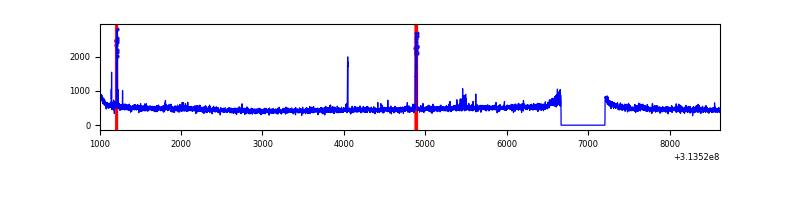 |
| D | 7611 | 7072 | 136 | 136 | 1.79% | 1.92% | 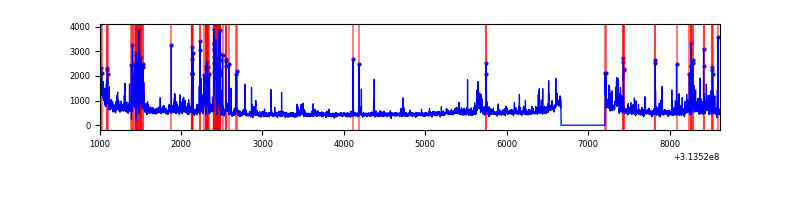 |
Top three noisy pixels from each quadrant. If the there are fewer than three noisy pixels in the level2.evt file, extra rows are filled as -1
| Pixel properties | Quadrant properties | ||||||
|---|---|---|---|---|---|---|---|
| Quadrant | DetID | PixID | Counts | Sigma | Mean | Median | Sigma |
| A | 13 | 254 | 12952 | 68.21 | 880 | 861 | 177.3 |
| A | 0 | 226 | 7696 | 38.56 | 880 | 861 | 177.3 |
| A | 3 | 137 | 6946 | 34.33 | 880 | 861 | 177.3 |
| B | 0 | 219 | 76693 | 464.89 | 874 | 855 | 163.1 |
| B | 0 | 190 | 51517 | 310.56 | 874 | 855 | 163.1 |
| B | 0 | 228 | 33792 | 201.91 | 874 | 855 | 163.1 |
| C | 14 | 238 | 131676 | 679.07 | 832 | 836 | 192.7 |
| C | 10 | 22 | 93689 | 481.91 | 832 | 836 | 192.7 |
| C | 0 | 239 | 18018 | 89.18 | 832 | 836 | 192.7 |
| D | 9 | 1 | 365970 | 1787.45 | 845 | 821 | 204.3 |
| D | 7 | 238 | 347891 | 1698.95 | 845 | 821 | 204.3 |
| D | 12 | 235 | 174532 | 850.34 | 845 | 821 | 204.3 |
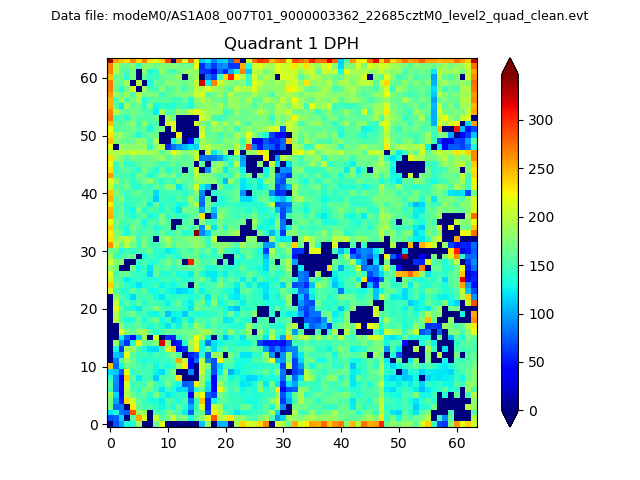
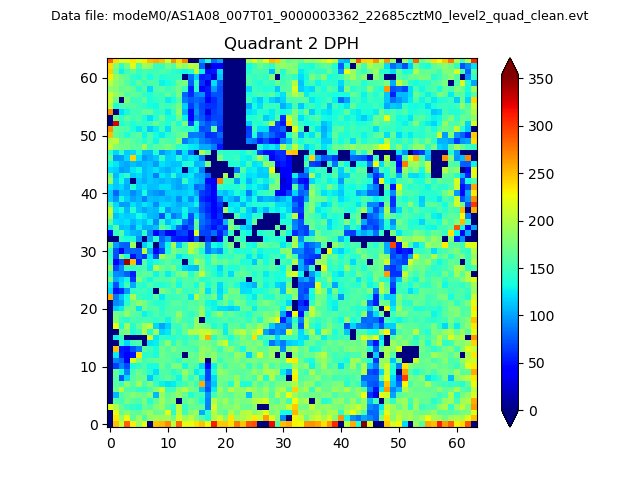
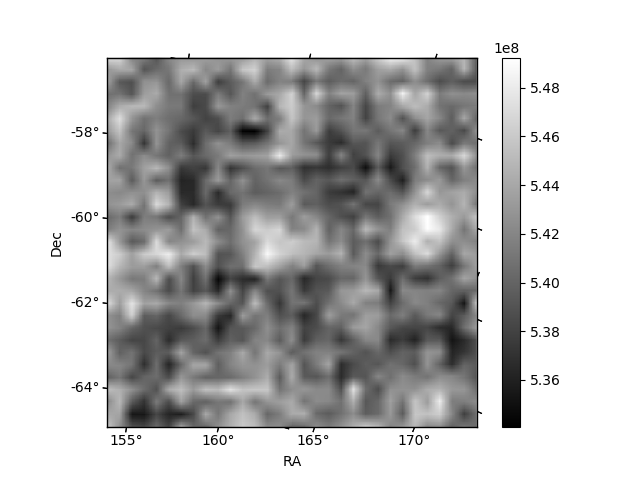
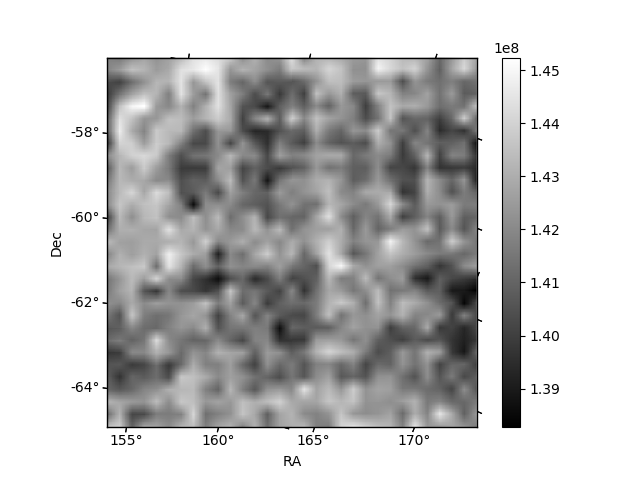
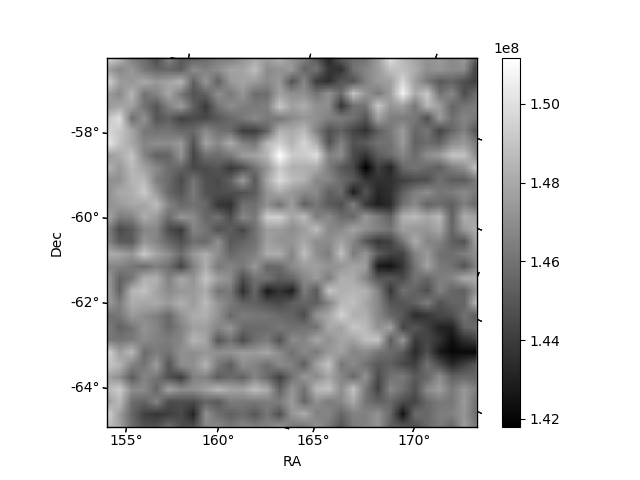
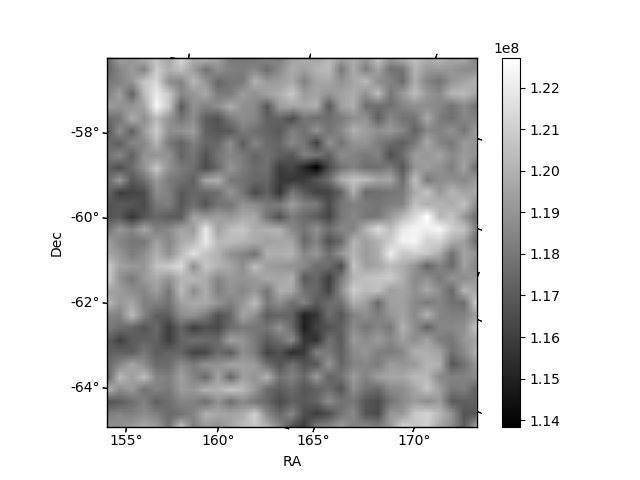
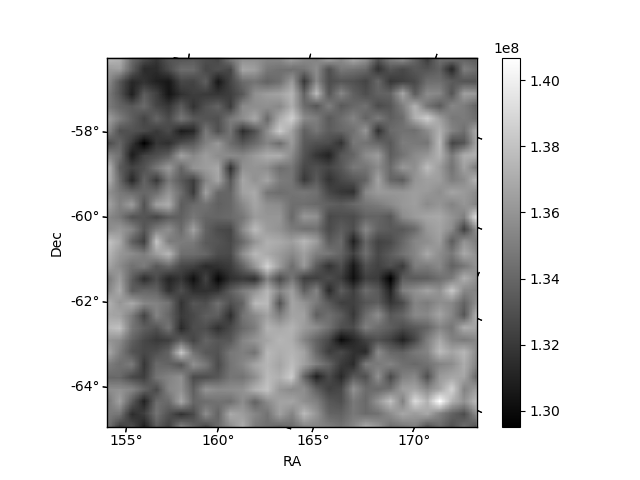
Histogram calculated using DETX and DETY for each event in the final _common_clean file
| Quadrant A | 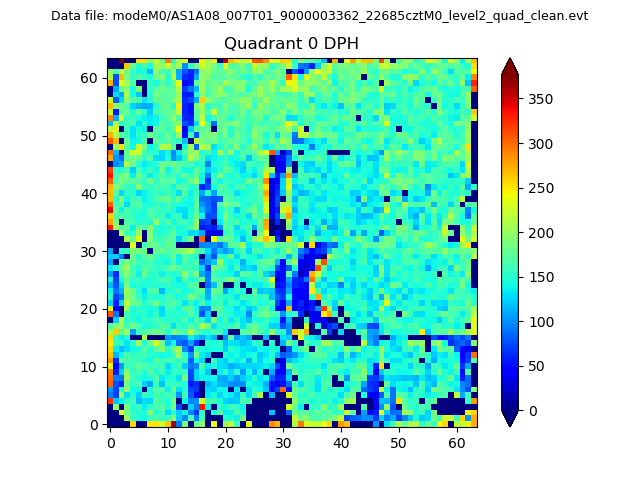 |
 |
Quadrant B |
|---|---|---|---|
| Quadrant D | 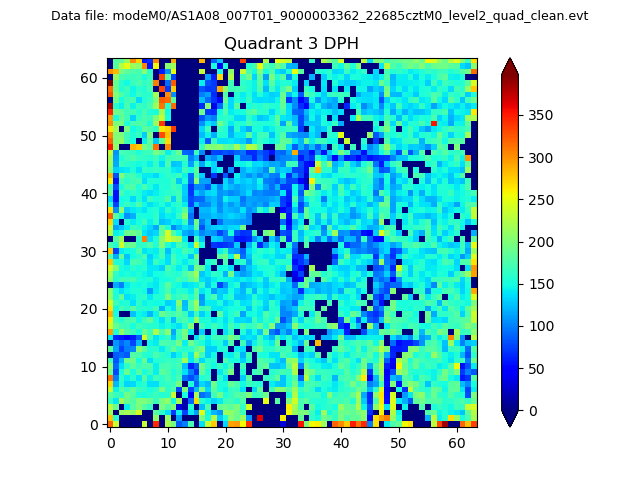 |
 |
Quadrant C |
| Plot type | Count rate plots | Images |
|---|---|---|
| Comparison with Poisson distribution Blue bars denote a histogram of data divided into 1 sec bins. Red curve is a Poisson curve with rate = median count rate of data. |
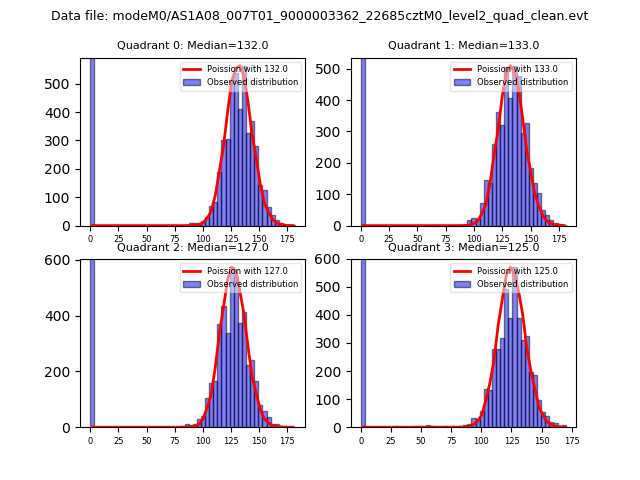 |
 |
| Quadrant-wise count rates Data is divided into 100 sec bins |
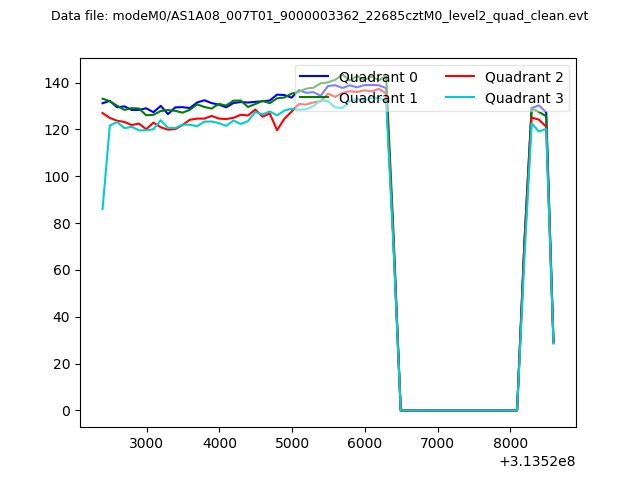 |
|
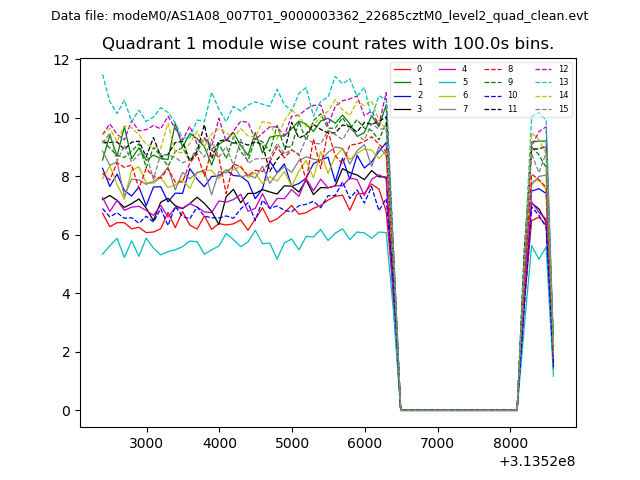
| Module-wise count rates for Quadrant A Data is divided into 100 sec bins |
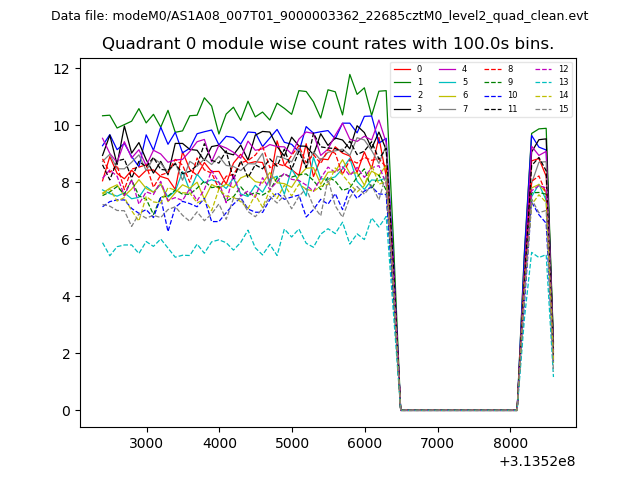 |
 |
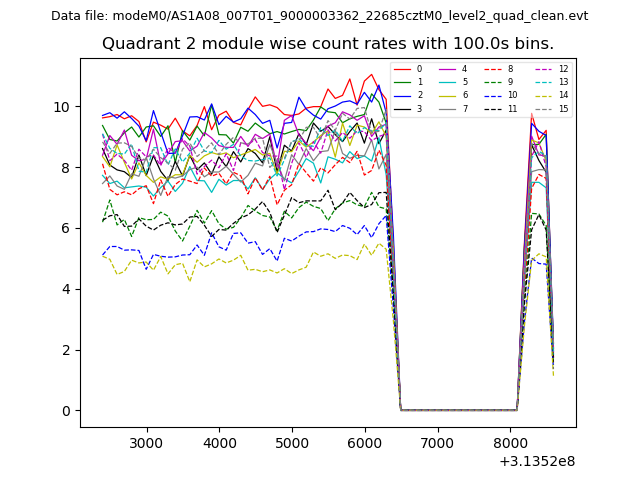
| Module-wise count rates for Quadrant B Data is divided into 100 sec bins |
 |
 |
| Module-wise count rates for Quadrant C Data is divided into 100 sec bins |
 |
 |
| Module-wise count rates for Quadrant D Data is divided into 100 sec bins |
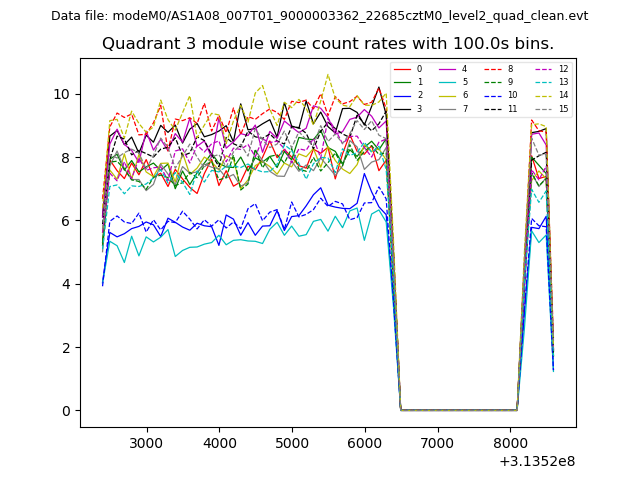 |
 |
| Parameter | Plot |
|---|---|
| CZT HV Monitor | 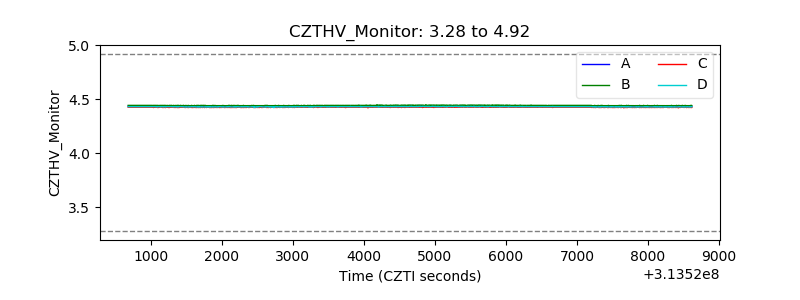 |
| D_VDD |  |
| Temperature 1 | 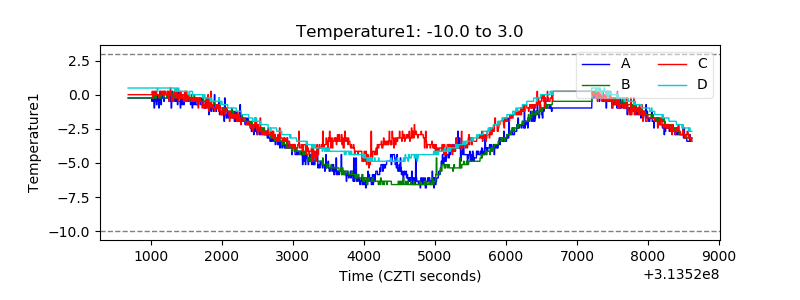 |
| Veto HV Monitor | 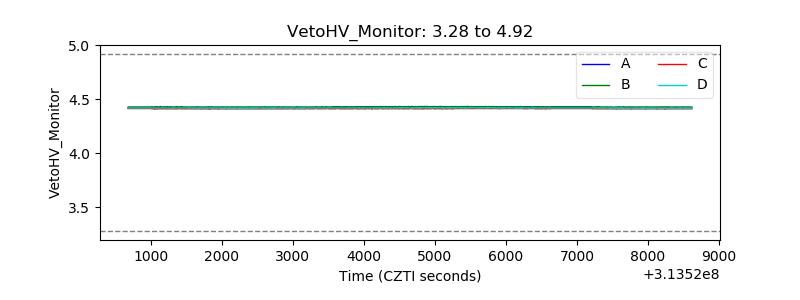 |
| Veto LLD | 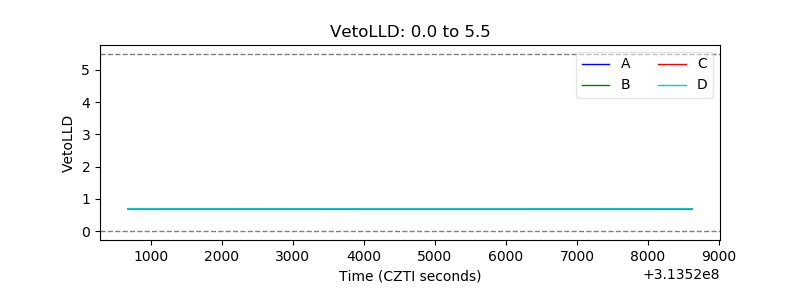 |
| Alpha Counter | 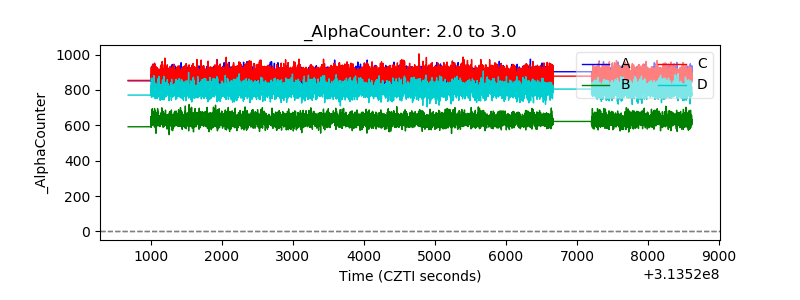 |
| _CPM_Rate | 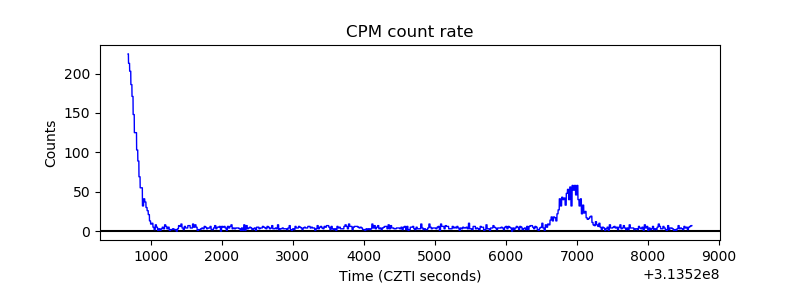 |
| CZT Counter | 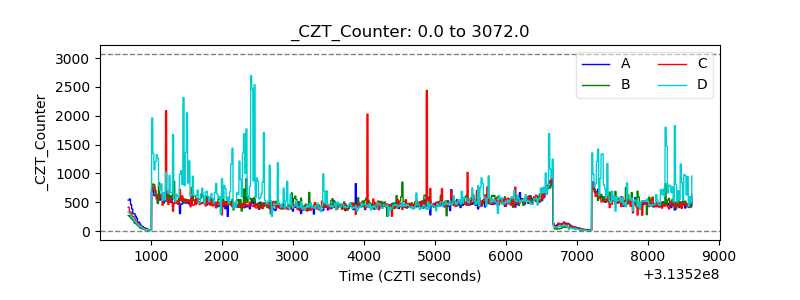 |
| +2.5 Volts monitor |  |
| +5 Volts monitor |  |
| _ROLL_ROT | 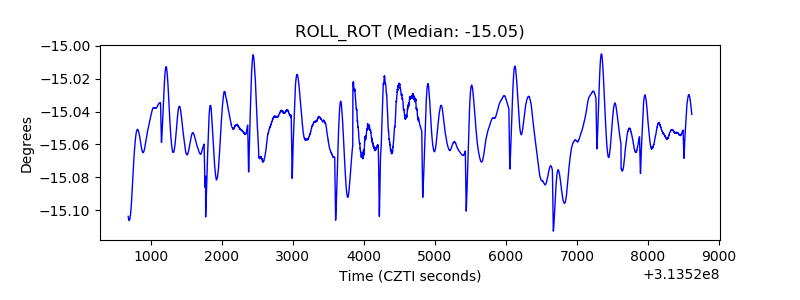 |
| _Roll_DEC | 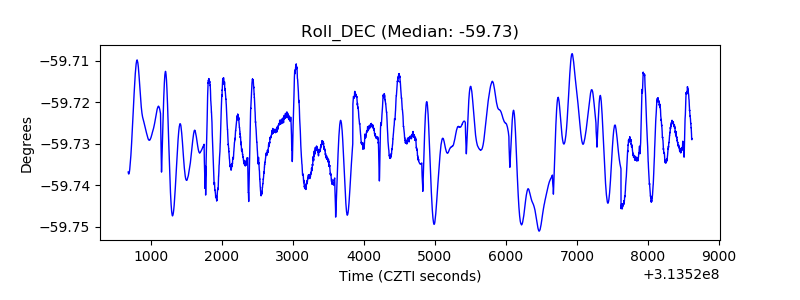 |
| _Roll_RA | 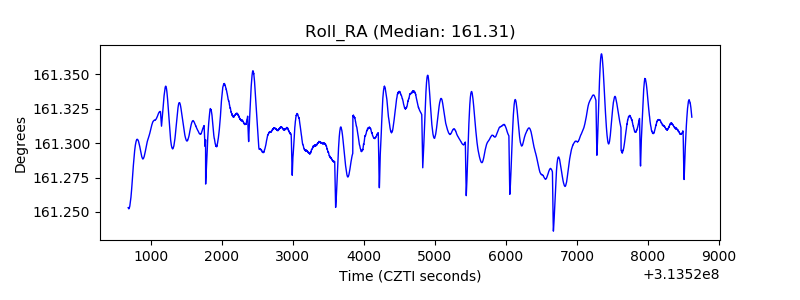 |
| Veto Counter | 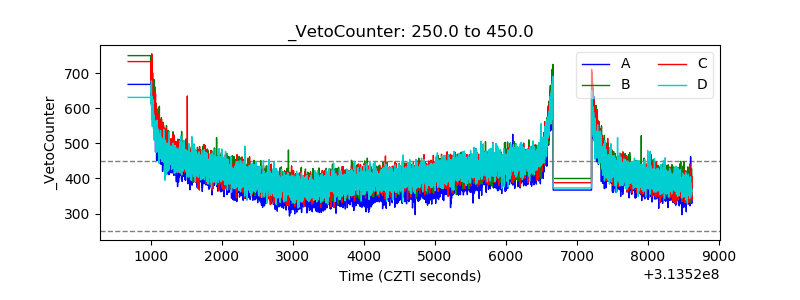 |