| Param | Original file | Final file |
|---|---|---|
| Filename | modeM0/AS1A08_007T01_9000003362_22693cztM0_level2.evt | modeM0/AS1A08_007T01_9000003362_22693cztM0_level2_quad_clean.evt |
| Size (bytes) | 1,179,982,080 | 226,258,560 |
| Size | 1.1 GB | 215.8 MB |
| Events in quadrant A | 7,961,805 | 1,443,430 |
| Events in quadrant B | 8,438,621 | 1,462,625 |
| Events in quadrant C | 8,063,253 | 1,400,659 |
| Events in quadrant D | 10,107,587 | 1,359,026 |
| Mode SS | |||
|---|---|---|---|
| Quadrant | BADHDUFLAG | Total packets | Discarded packets |
| A | 0 | 352 | 0 |
| B | 0 | 352 | 0 |
| C | 0 | 352 | 0 |
| D | 0 | 352 | 0 |
| Mode M0 | |||
|---|---|---|---|
| Quadrant | BADHDUFLAG | Total packets | Discarded packets |
| A | 0 | 35079 | 3 |
| B | 0 | 35970 | 3 |
| C | 0 | 35062 | 3 |
| D | 0 | 41474 | 3 |
| Mode M9 | |||
|---|---|---|---|
| Quadrant | BADHDUFLAG | Total packets | Discarded packets |
| A | 0 | 18 | 0 |
| B | 0 | 18 | 0 |
| C | 0 | 18 | 0 |
| D | 0 | 18 | 0 |
| Quadrant | Total seconds | Saturated seconds | Saturation percentage |
|---|---|---|---|
| A | 17220 | 63 | 0.365854% |
| B | 17221 | 134 | 0.778120% |
| C | 17221 | 166 | 0.963939% |
| D | 17221 | 343 | 1.991754% |
Noise dominated data is calculated using 1-second bins in cleaned event files. If a bin has >2000 counts, and if more than 50% of those come from <1% of pixels, then it is considered to be noise-dominated and hence unusable.
| Quadrant | # 1 sec bins | Bins with >0 counts | Bins with >2000 counts | High rate bins dominated by noise | Noise dominated (total time) | Noise dominated (detector-on time) | Marked lightcurve |
|---|---|---|---|---|---|---|---|
| A | 18595 | 17223 | 0 | 0 | 0.00% | 0.00% | 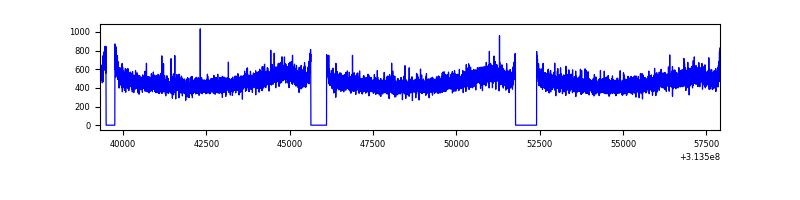 |
| B | 18596 | 17224 | 12 | 12 | 0.06% | 0.07% | 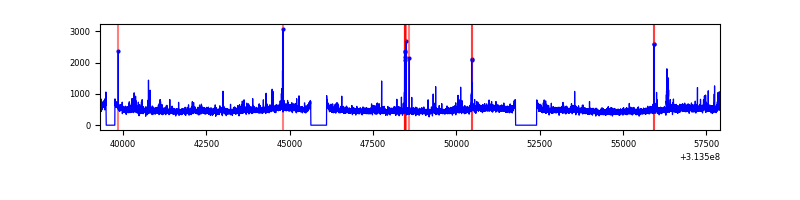 |
| C | 18596 | 17224 | 0 | 0 | 0.00% | 0.00% | 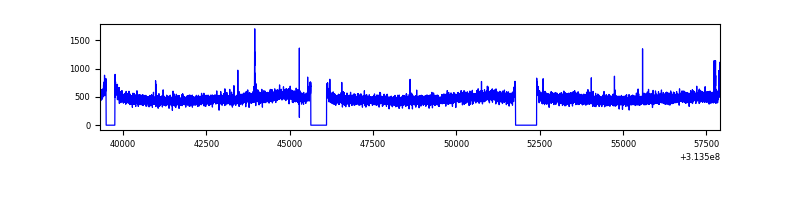 |
| D | 18596 | 17224 | 215 | 215 | 1.16% | 1.25% | 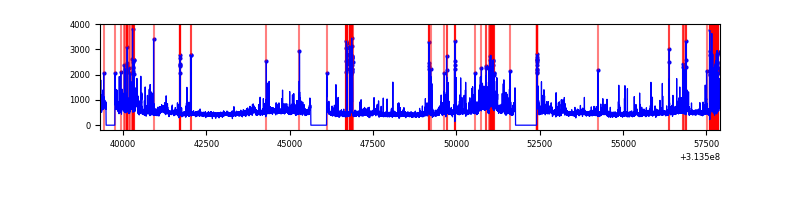 |
Top three noisy pixels from each quadrant. If the there are fewer than three noisy pixels in the level2.evt file, extra rows are filled as -1
| Pixel properties | Quadrant properties | ||||||
|---|---|---|---|---|---|---|---|
| Quadrant | DetID | PixID | Counts | Sigma | Mean | Median | Sigma |
| A | 13 | 254 | 31856 | 72.32 | 2059 | 2011 | 412.7 |
| A | 0 | 226 | 17832 | 38.34 | 2059 | 2011 | 412.7 |
| A | 3 | 137 | 17090 | 36.54 | 2059 | 2011 | 412.7 |
| B | 0 | 219 | 123006 | 313.26 | 2056 | 2006 | 386.3 |
| B | 15 | 33 | 65998 | 165.67 | 2056 | 2006 | 386.3 |
| B | 0 | 190 | 56270 | 140.49 | 2056 | 2006 | 386.3 |
| C | 14 | 238 | 308696 | 667.66 | 1976 | 1987 | 459.4 |
| C | 10 | 22 | 25011 | 50.12 | 1976 | 1987 | 459.4 |
| C | 3 | 233 | 14905 | 28.12 | 1976 | 1987 | 459.4 |
| D | 1 | 52 | 656403 | 1363.73 | 1996 | 1945 | 479.9 |
| D | 7 | 238 | 573163 | 1190.28 | 1996 | 1945 | 479.9 |
| D | 12 | 227 | 274842 | 568.65 | 1996 | 1945 | 479.9 |
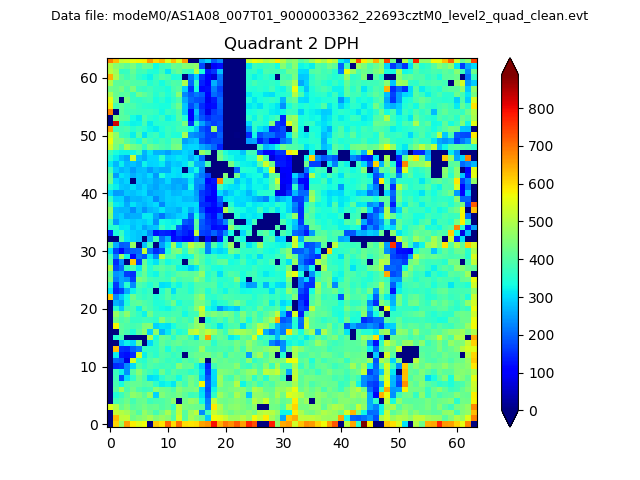
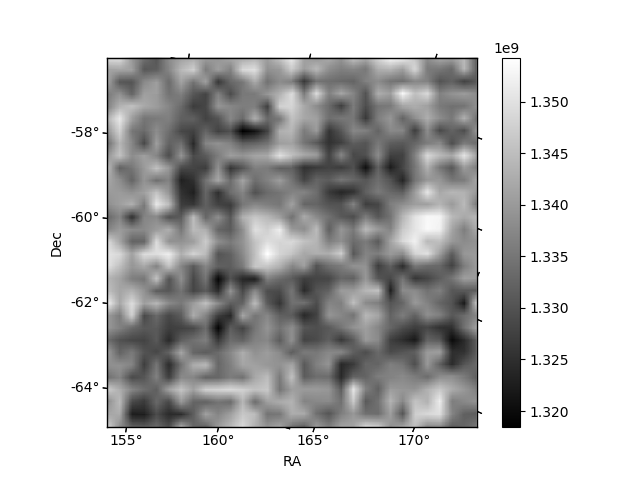
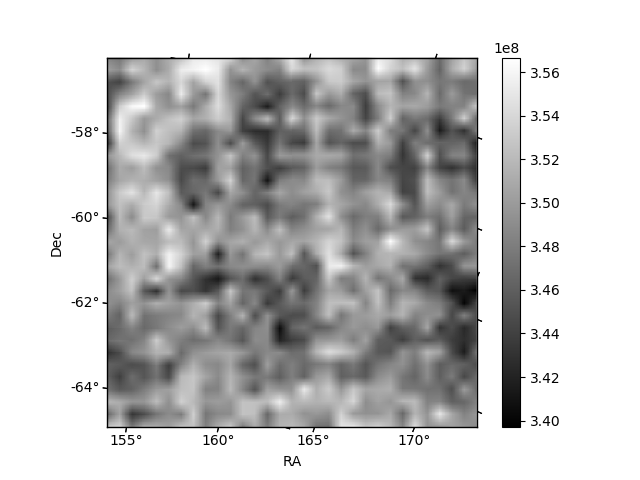
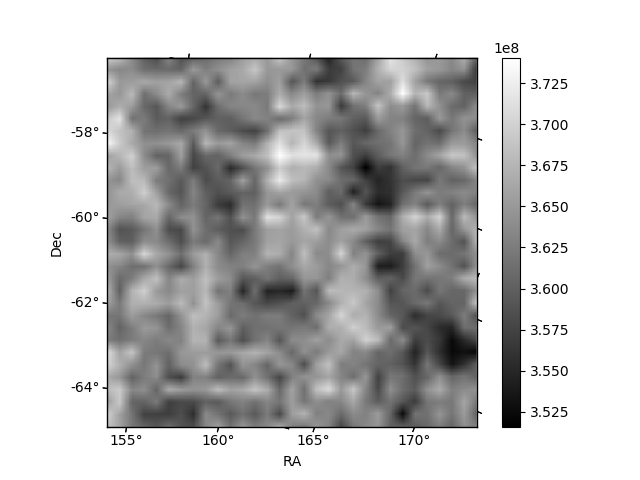
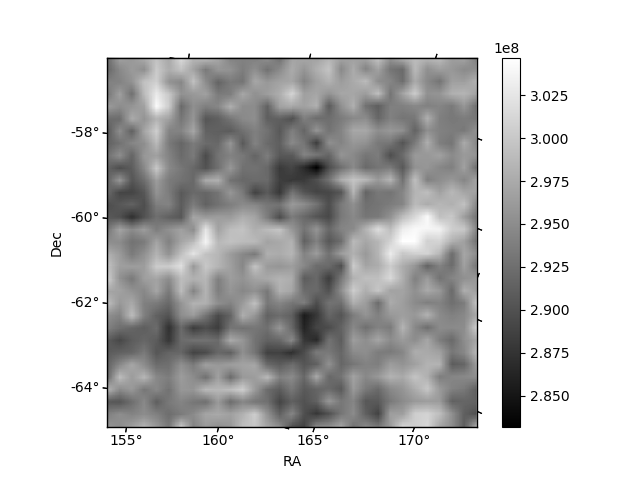
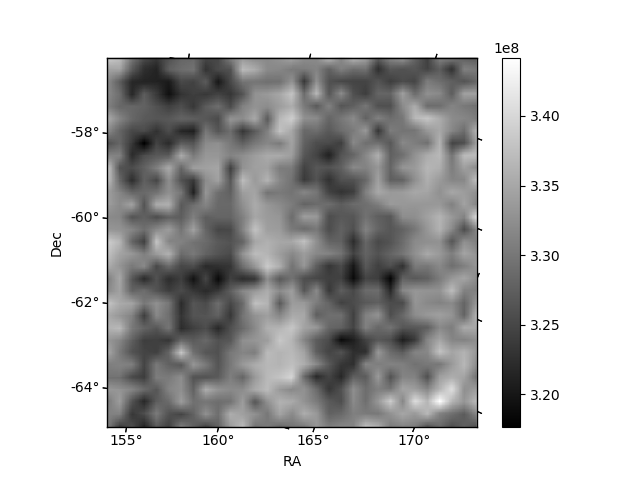
Histogram calculated using DETX and DETY for each event in the final _common_clean file
| Quadrant A | 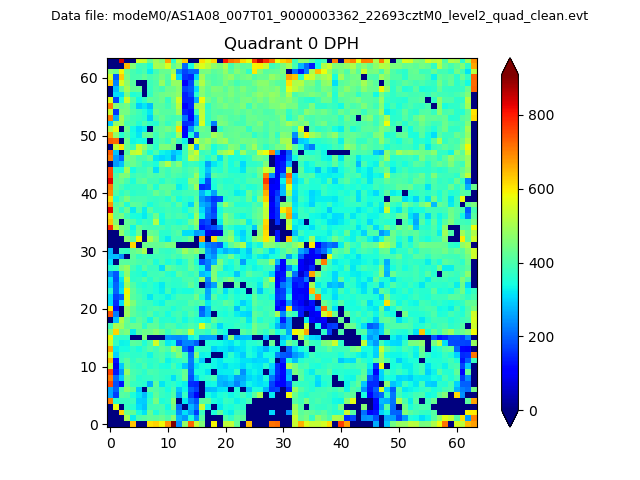 |
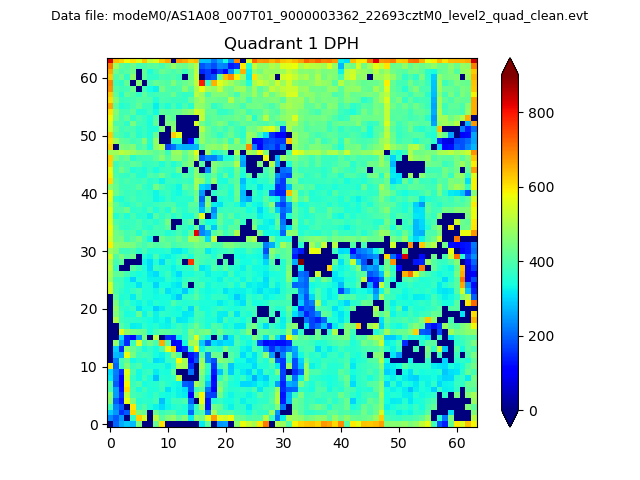 |
Quadrant B |
|---|---|---|---|
| Quadrant D | 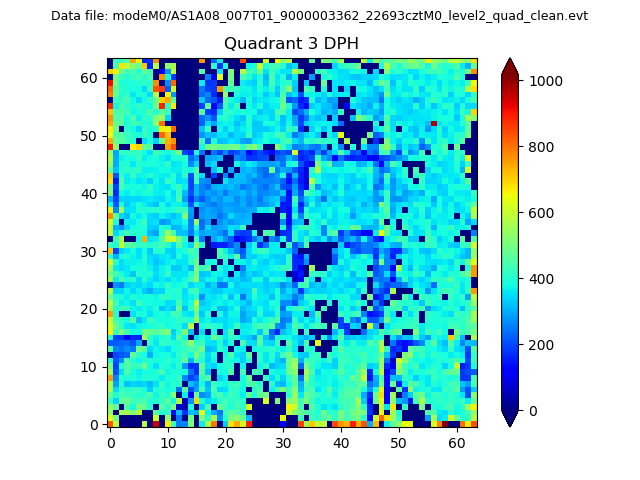 |
 |
Quadrant C |
| Plot type | Count rate plots | Images |
|---|---|---|
| Comparison with Poisson distribution Blue bars denote a histogram of data divided into 1 sec bins. Red curve is a Poisson curve with rate = median count rate of data. |
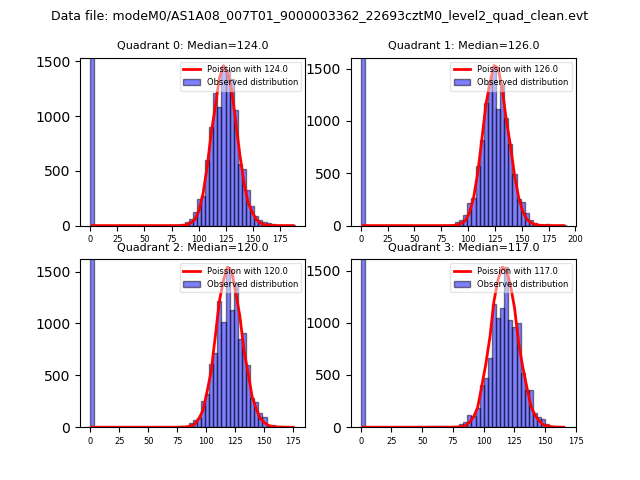 |
 |
| Quadrant-wise count rates Data is divided into 100 sec bins |
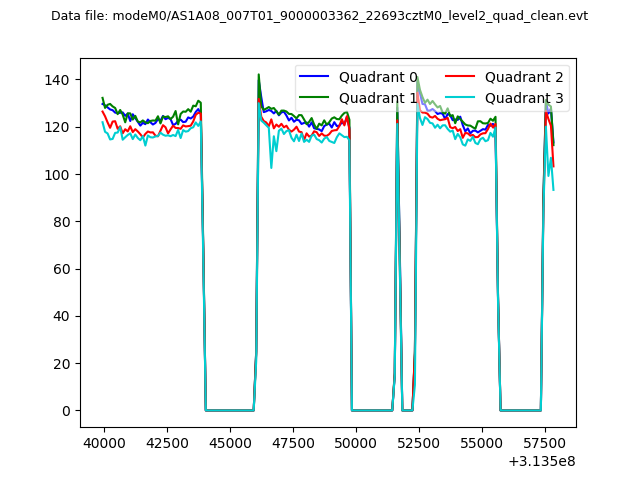 |
|
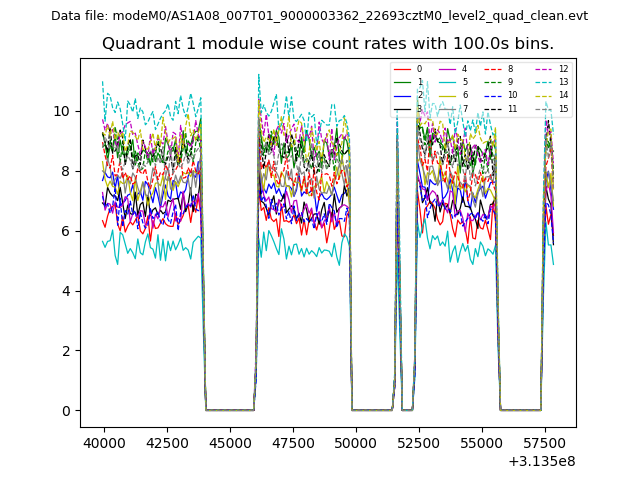
| Module-wise count rates for Quadrant A Data is divided into 100 sec bins |
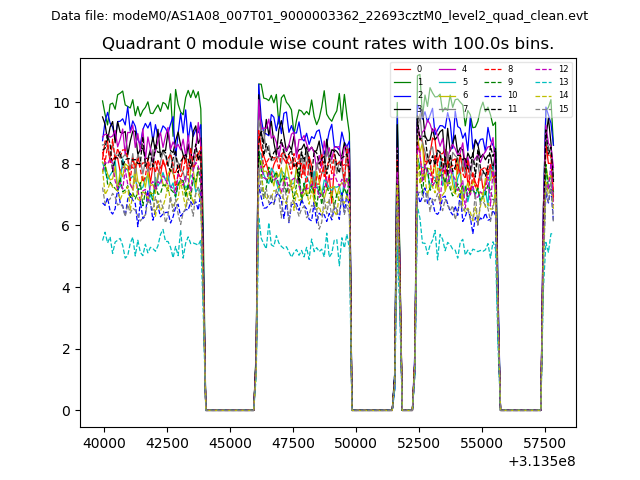 |
 |
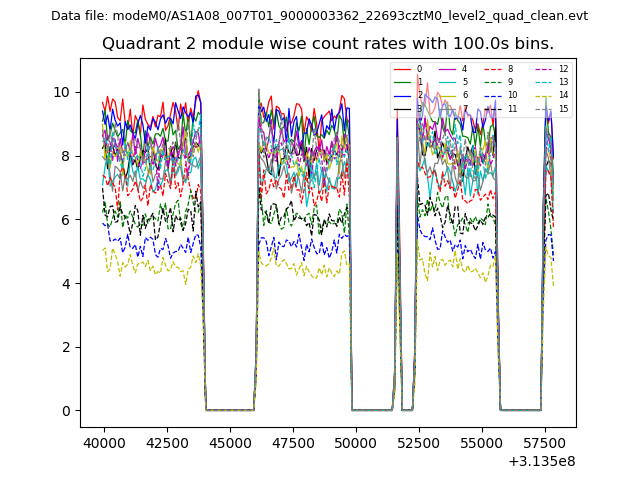
| Module-wise count rates for Quadrant B Data is divided into 100 sec bins |
 |
 |
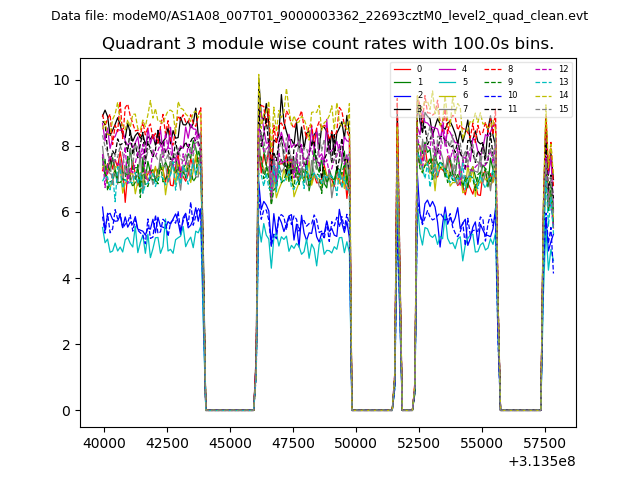
| Module-wise count rates for Quadrant C Data is divided into 100 sec bins |
 |
 |
| Module-wise count rates for Quadrant D Data is divided into 100 sec bins |
 |
 |
| Parameter | Plot |
|---|---|
| CZT HV Monitor | 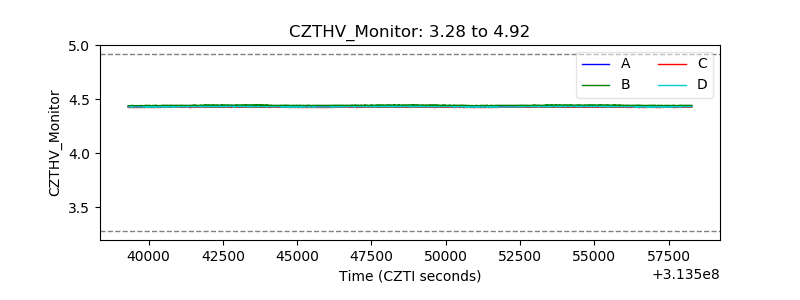 |
| D_VDD |  |
| Temperature 1 |  |
| Veto HV Monitor | 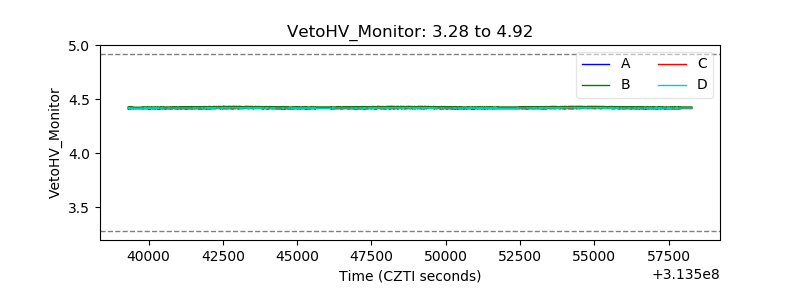 |
| Veto LLD | 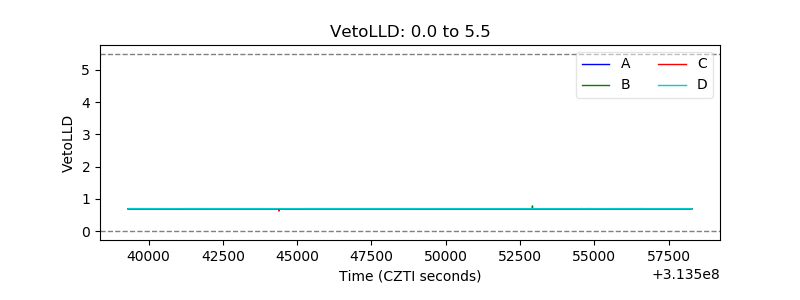 |
| Alpha Counter | 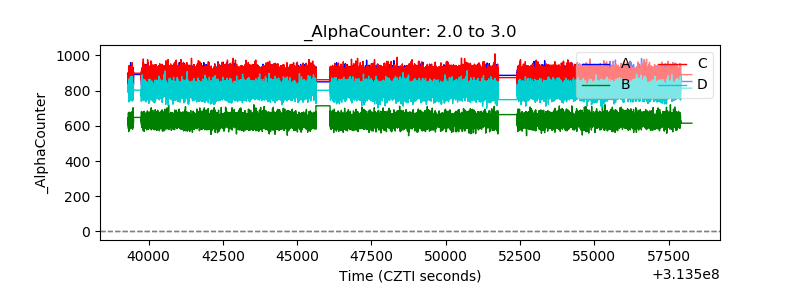 |
| _CPM_Rate | 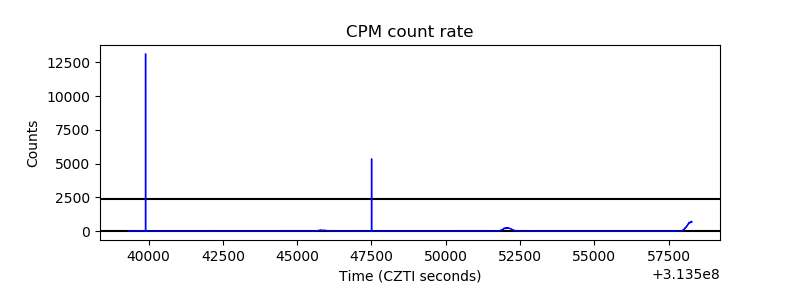 |
| CZT Counter | 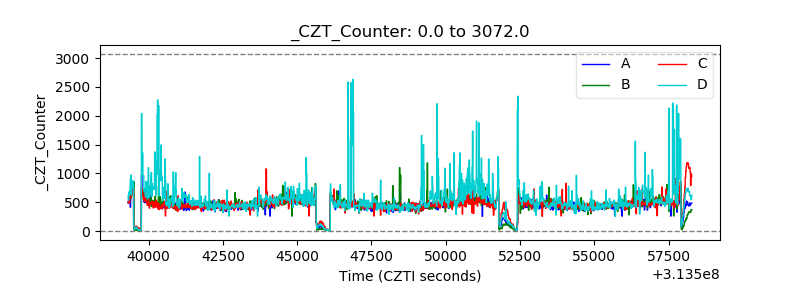 |
| +2.5 Volts monitor |  |
| +5 Volts monitor | 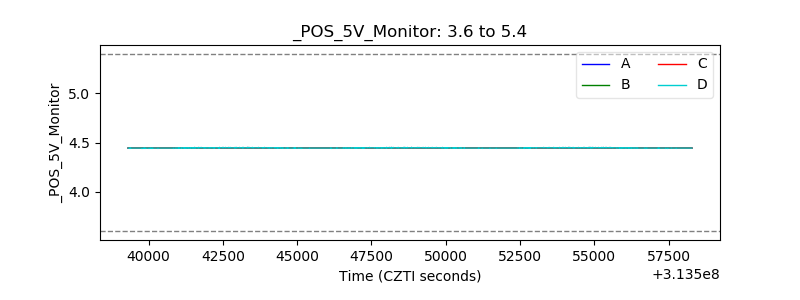 |
| _ROLL_ROT | 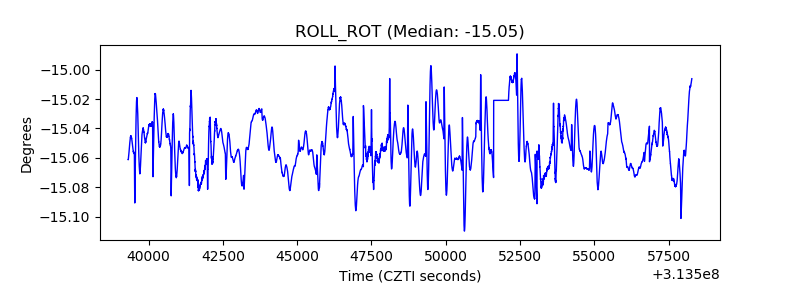 |
| _Roll_DEC | 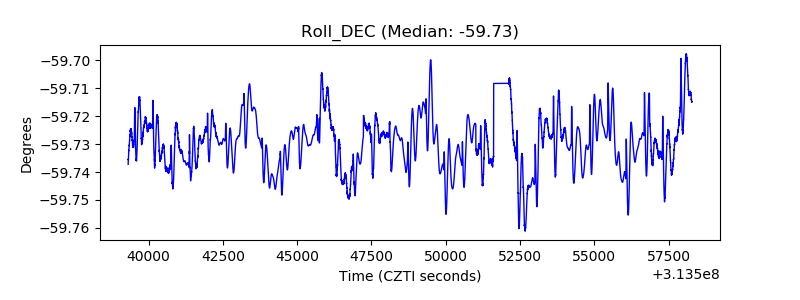 |
| _Roll_RA | 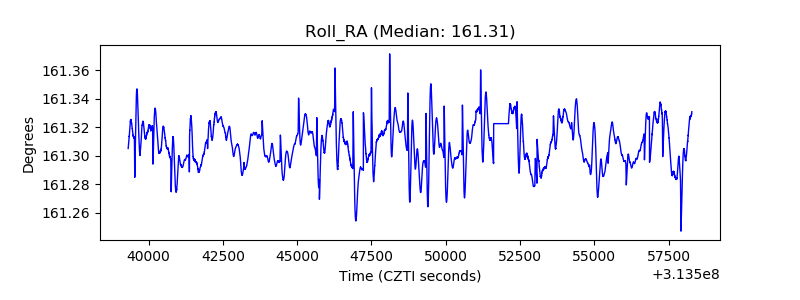 |
| Veto Counter | 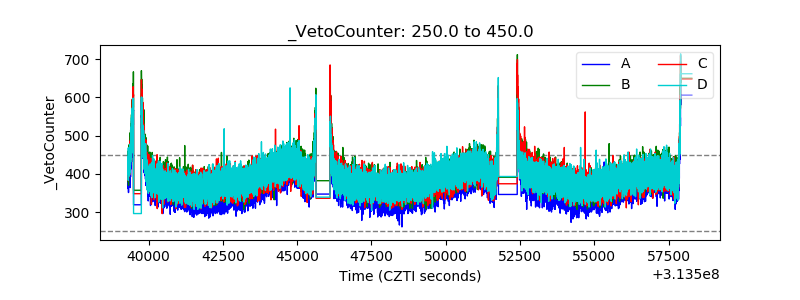 |