| Param | Original file | Final file |
|---|---|---|
| Filename | modeM0/AS1A08_007T01_9000003362_22694cztM0_level2.evt | modeM0/AS1A08_007T01_9000003362_22694cztM0_level2_quad_clean.evt |
| Size (bytes) | 2,572,320,960 | 535,006,080 |
| Size | 2.4 GB | 510.2 MB |
| Events in quadrant A | 17,275,873 | 3,481,723 |
| Events in quadrant B | 18,158,642 | 3,531,888 |
| Events in quadrant C | 17,588,379 | 3,391,621 |
| Events in quadrant D | 22,406,040 | 3,282,709 |
| Mode SS | |||
|---|---|---|---|
| Quadrant | BADHDUFLAG | Total packets | Discarded packets |
| A | 0 | 744 | 0 |
| B | 0 | 744 | 0 |
| C | 0 | 744 | 0 |
| D | 0 | 744 | 0 |
| Mode M0 | |||
|---|---|---|---|
| Quadrant | BADHDUFLAG | Total packets | Discarded packets |
| A | 0 | 75426 | 7 |
| B | 0 | 77137 | 7 |
| C | 0 | 75844 | 8 |
| D | 0 | 90652 | 7 |
| Mode M9 | |||
|---|---|---|---|
| Quadrant | BADHDUFLAG | Total packets | Discarded packets |
| A | 0 | 53 | 0 |
| B | 0 | 53 | 0 |
| C | 0 | 53 | 0 |
| D | 0 | 53 | 0 |
| Quadrant | Total seconds | Saturated seconds | Saturation percentage |
|---|---|---|---|
| A | 36662 | 147 | 0.400960% |
| B | 36662 | 237 | 0.646446% |
| C | 36662 | 361 | 0.984671% |
| D | 36662 | 933 | 2.544869% |
Noise dominated data is calculated using 1-second bins in cleaned event files. If a bin has >2000 counts, and if more than 50% of those come from <1% of pixels, then it is considered to be noise-dominated and hence unusable.
| Quadrant | # 1 sec bins | Bins with >0 counts | Bins with >2000 counts | High rate bins dominated by noise | Noise dominated (total time) | Noise dominated (detector-on time) | Marked lightcurve |
|---|---|---|---|---|---|---|---|
| A | 44386 | 36669 | 0 | 0 | 0.00% | 0.00% | 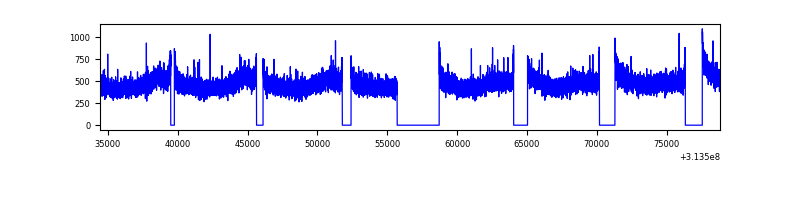 |
| B | 44386 | 36669 | 18 | 18 | 0.04% | 0.05% | 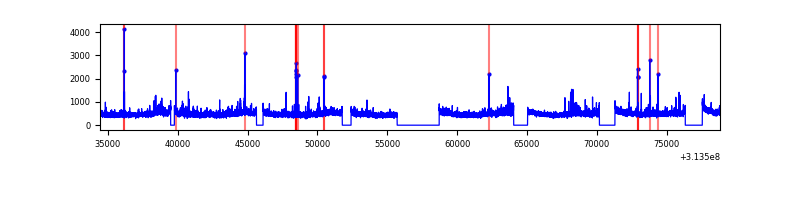 |
| C | 44386 | 36669 | 3 | 3 | 0.01% | 0.01% | 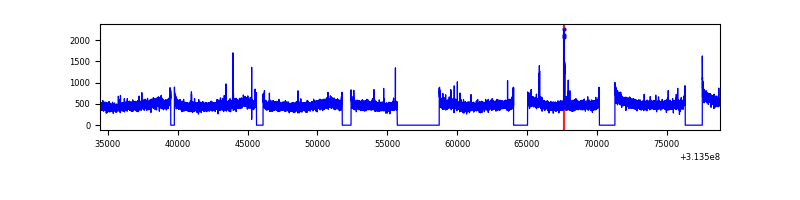 |
| D | 44386 | 36669 | 638 | 638 | 1.44% | 1.74% | 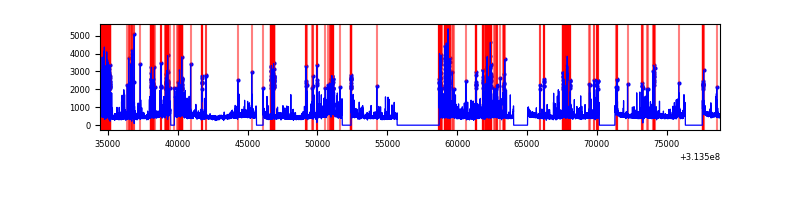 |
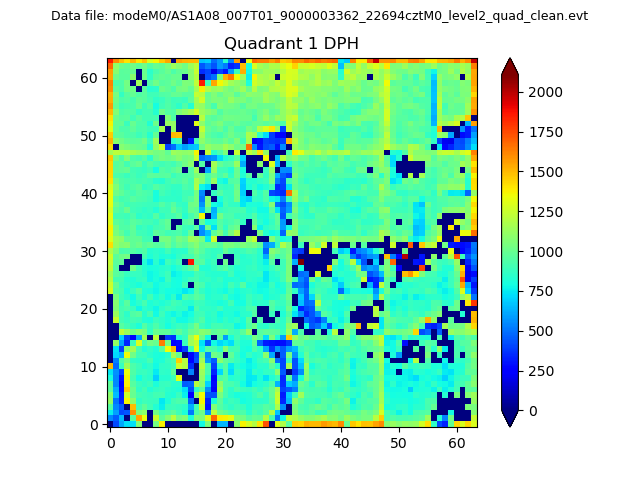
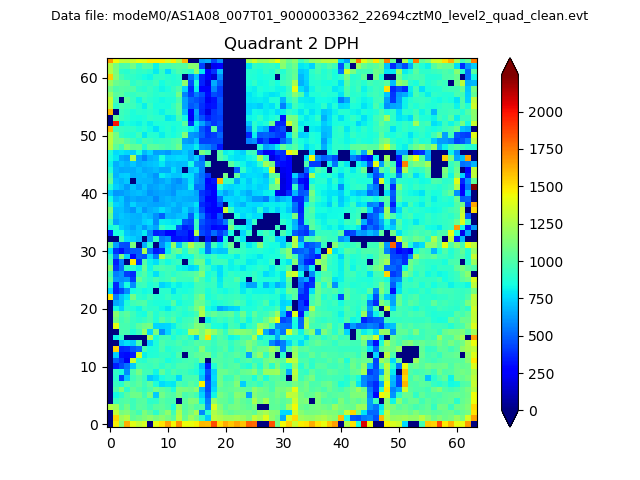
Top three noisy pixels from each quadrant. If the there are fewer than three noisy pixels in the level2.evt file, extra rows are filled as -1
| Pixel properties | Quadrant properties | ||||||
|---|---|---|---|---|---|---|---|
| Quadrant | DetID | PixID | Counts | Sigma | Mean | Median | Sigma |
| A | 13 | 254 | 64224 | 67.44 | 4469 | 4373 | 887.4 |
| A | 0 | 226 | 38889 | 38.89 | 4469 | 4373 | 887.4 |
| A | 3 | 137 | 36042 | 35.69 | 4469 | 4373 | 887.4 |
| B | 0 | 219 | 222071 | 263.9 | 4451 | 4343 | 825.0 |
| B | 0 | 190 | 102440 | 118.9 | 4451 | 4343 | 825.0 |
| B | 12 | 111 | 97454 | 112.86 | 4451 | 4343 | 825.0 |
| C | 14 | 238 | 677677 | 673.0 | 4315 | 4342 | 1000.5 |
| C | 10 | 22 | 78894 | 74.52 | 4315 | 4342 | 1000.5 |
| C | 13 | 61 | 29722 | 25.37 | 4315 | 4342 | 1000.5 |
| D | 1 | 52 | 1991739 | 1899.38 | 4345 | 4235 | 1046.4 |
| D | 2 | 136 | 828224 | 787.45 | 4345 | 4235 | 1046.4 |
| D | 7 | 238 | 617975 | 586.53 | 4345 | 4235 | 1046.4 |
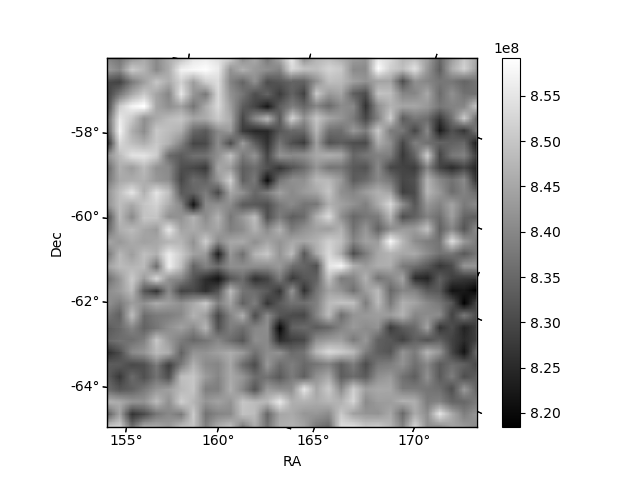
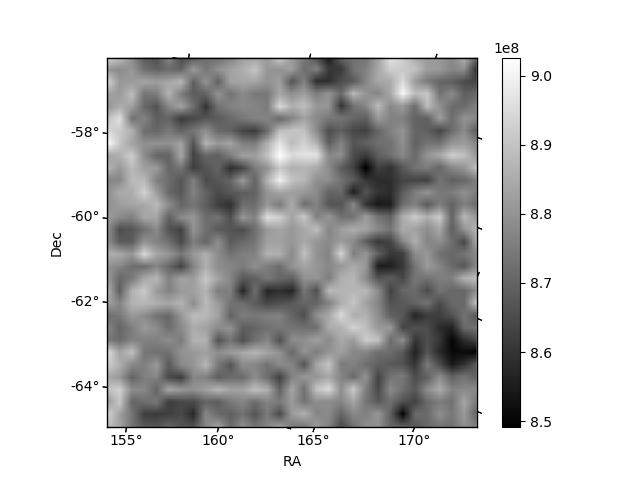
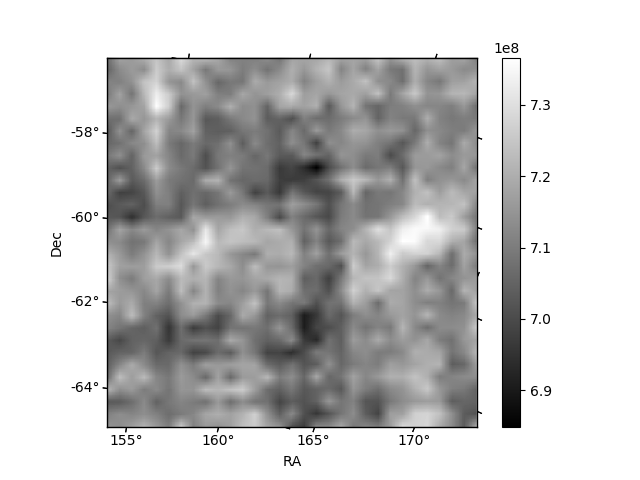
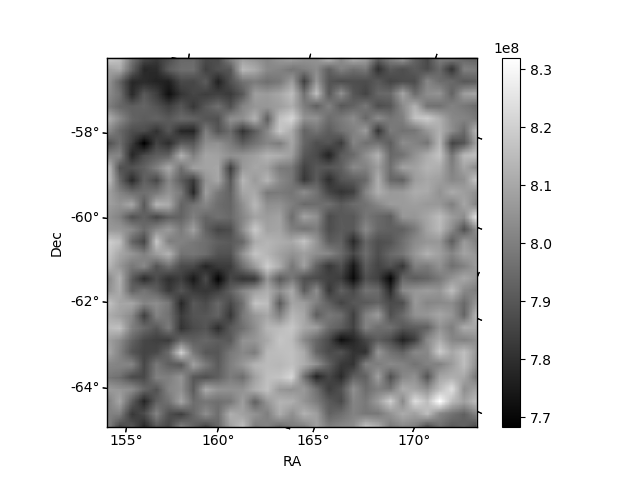
Histogram calculated using DETX and DETY for each event in the final _common_clean file
| Quadrant A | 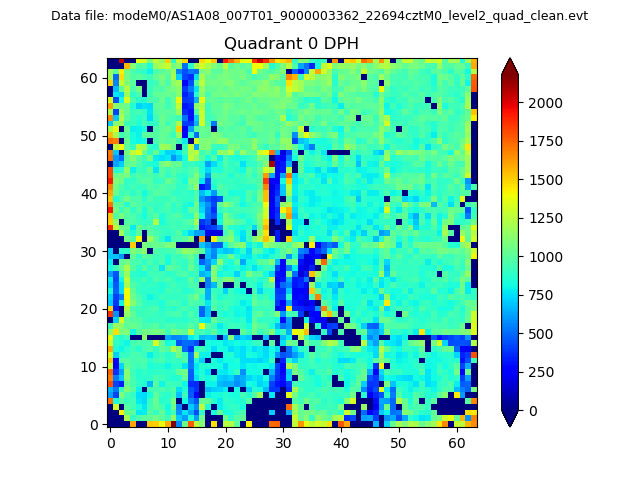 |
 |
Quadrant B |
|---|---|---|---|
| Quadrant D | 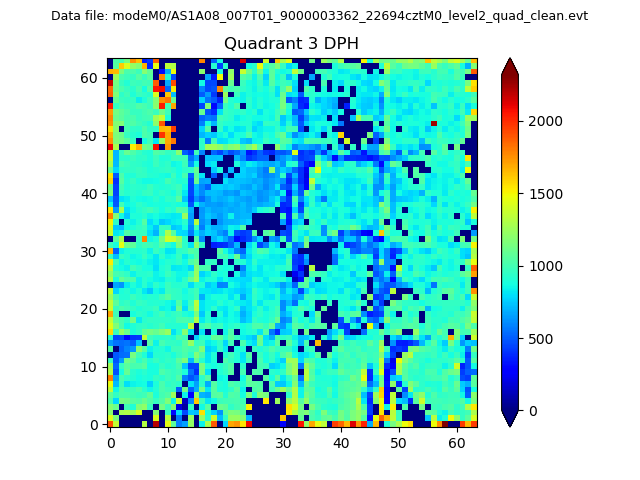 |
 |
Quadrant C |
| Plot type | Count rate plots | Images |
|---|---|---|
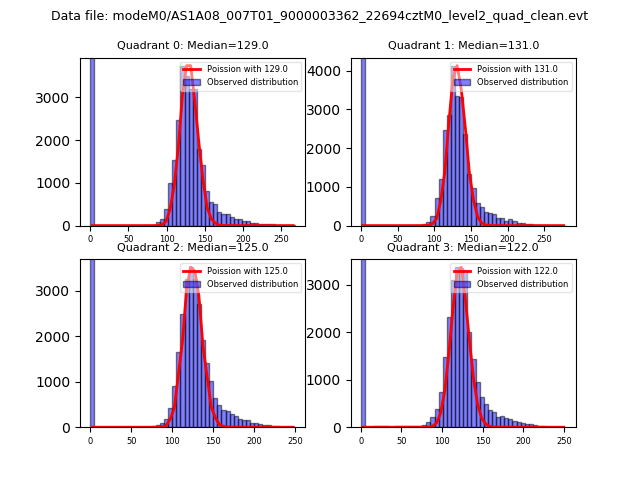
| Comparison with Poisson distribution Blue bars denote a histogram of data divided into 1 sec bins. Red curve is a Poisson curve with rate = median count rate of data. |
 |
 |
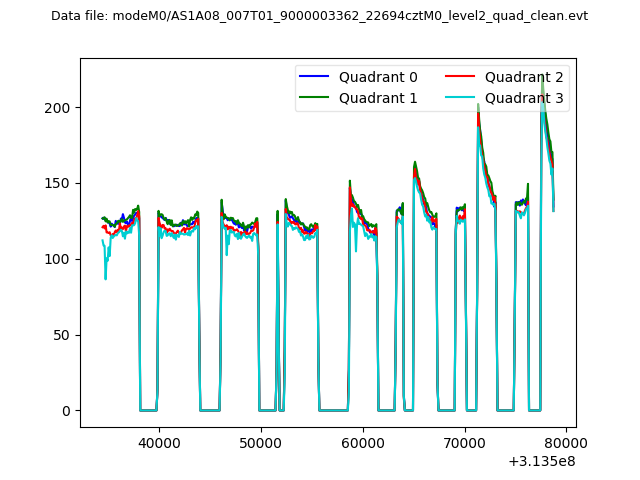
| Quadrant-wise count rates Data is divided into 100 sec bins |
 |
|
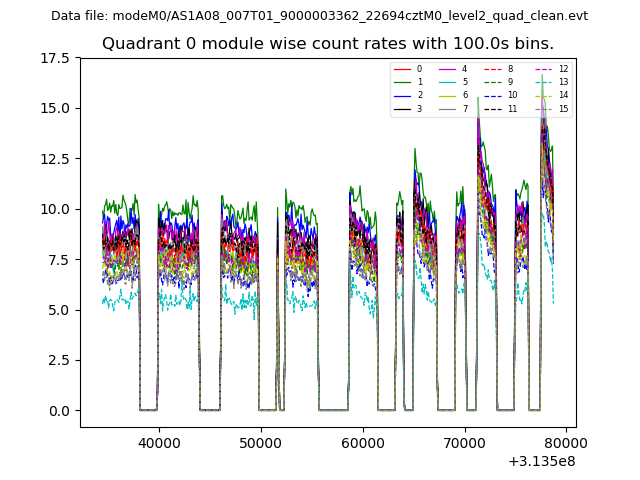
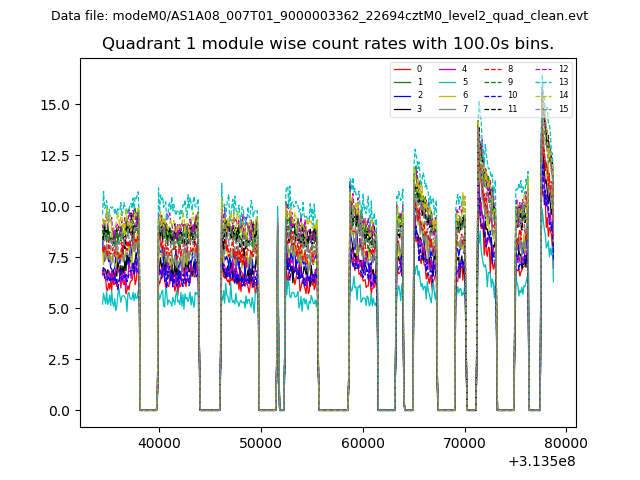
| Module-wise count rates for Quadrant A Data is divided into 100 sec bins |
 |
 |
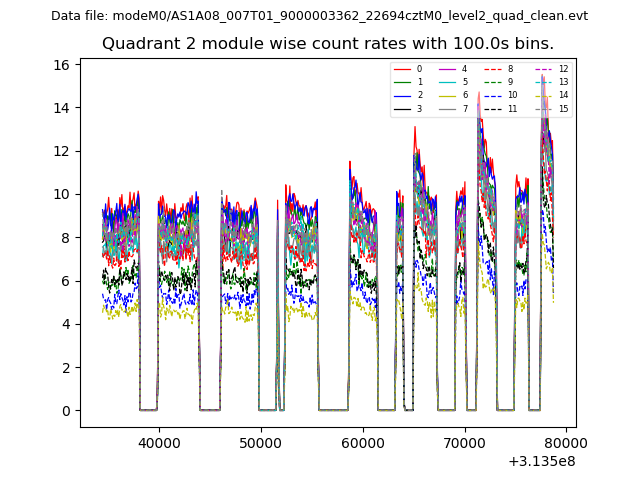
| Module-wise count rates for Quadrant B Data is divided into 100 sec bins |
 |
 |
| Module-wise count rates for Quadrant C Data is divided into 100 sec bins |
 |
 |
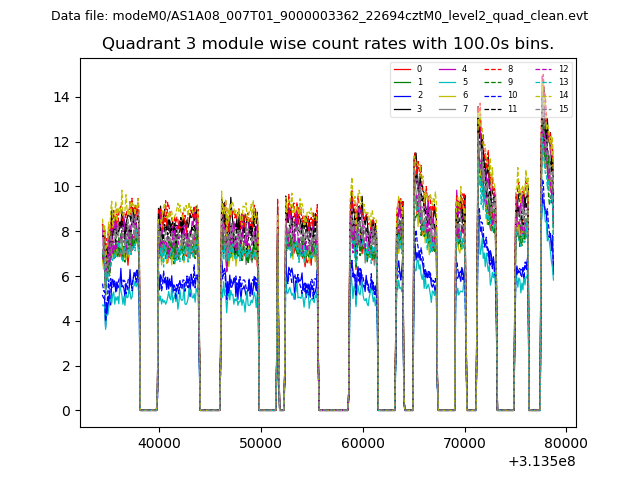
| Module-wise count rates for Quadrant D Data is divided into 100 sec bins |
 |
 |
| Parameter | Plot |
|---|---|
| CZT HV Monitor | 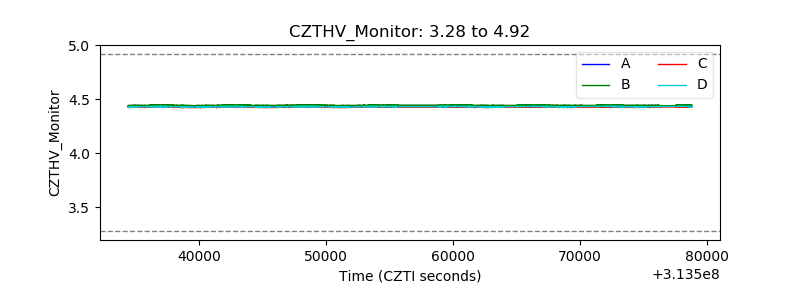 |
| D_VDD |  |
| Temperature 1 |  |
| Veto HV Monitor | 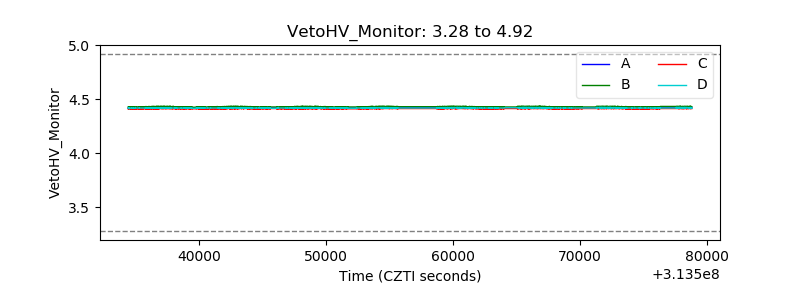 |
| Veto LLD | 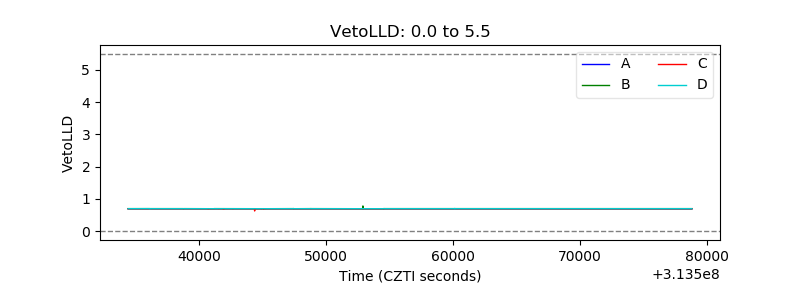 |
| Alpha Counter | 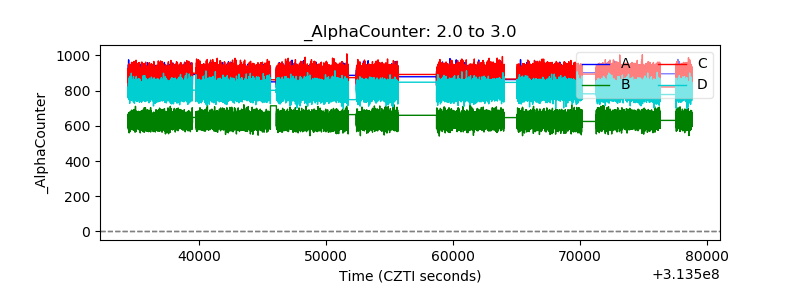 |
| _CPM_Rate | 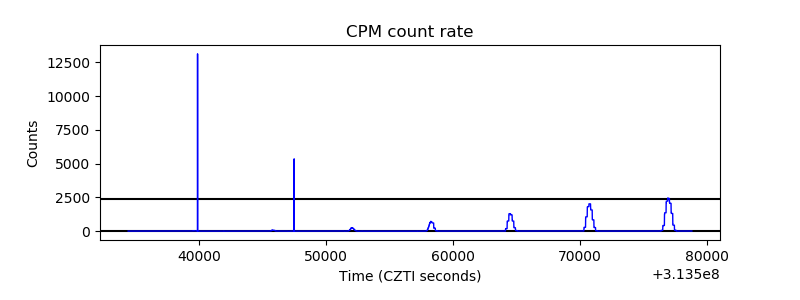 |
| CZT Counter | 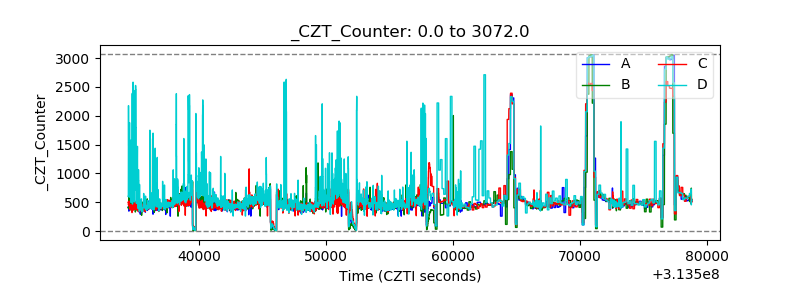 |
| +2.5 Volts monitor |  |
| +5 Volts monitor | 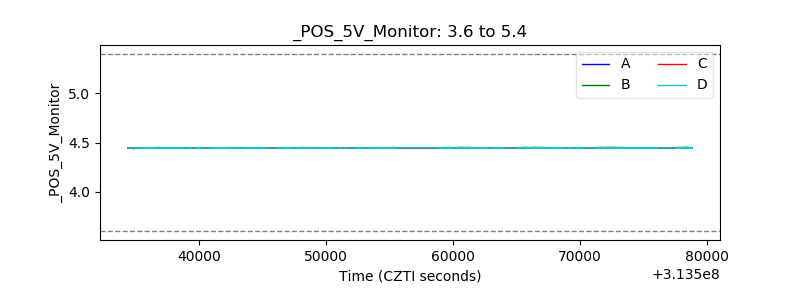 |
| _ROLL_ROT | 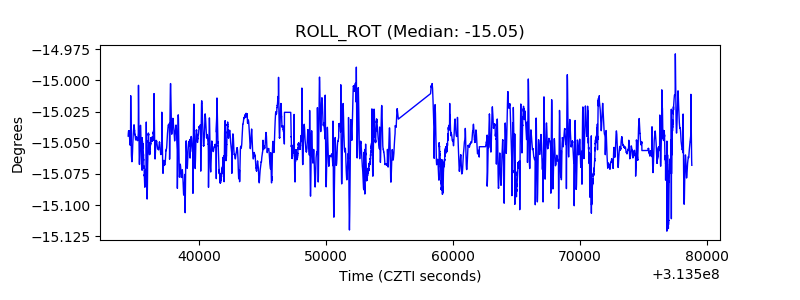 |
| _Roll_DEC | 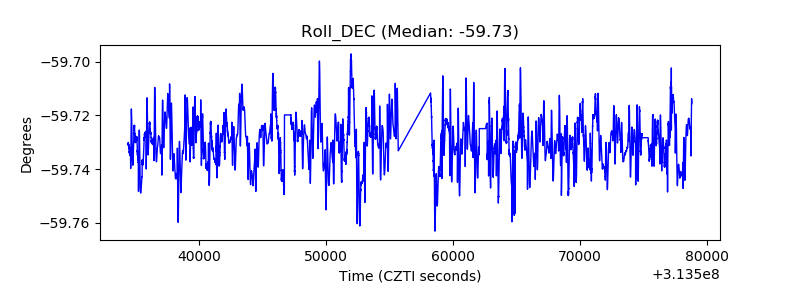 |
| _Roll_RA | 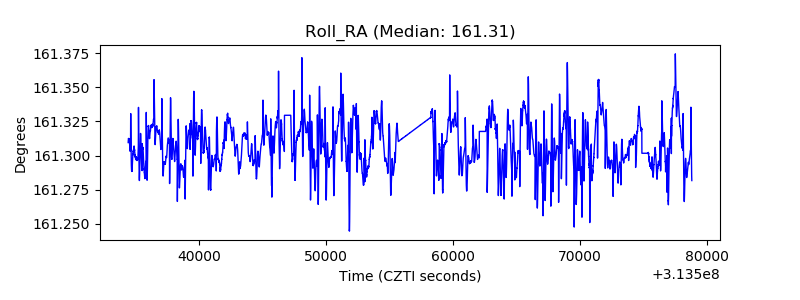 |
| Veto Counter |  |