| Param | Original file | Final file |
|---|---|---|
| Filename | modeM0/AS1A08_007T01_9000003362_22695cztM0_level2.evt | modeM0/AS1A08_007T01_9000003362_22695cztM0_level2_quad_clean.evt |
| Size (bytes) | 474,860,160 | 97,462,080 |
| Size | 452.9 MB | 92.9 MB |
| Events in quadrant A | 3,188,315 | 651,795 |
| Events in quadrant B | 3,211,976 | 660,332 |
| Events in quadrant C | 3,175,250 | 624,831 |
| Events in quadrant D | 4,409,829 | 606,859 |
| Mode SS | |||
|---|---|---|---|
| Quadrant | BADHDUFLAG | Total packets | Discarded packets |
| A | 0 | 118 | 0 |
| B | 0 | 118 | 0 |
| C | 0 | 118 | 0 |
| D | 0 | 118 | 0 |
| Mode M0 | |||
|---|---|---|---|
| Quadrant | BADHDUFLAG | Total packets | Discarded packets |
| A | 0 | 13082 | 1 |
| B | 0 | 13125 | 1 |
| C | 0 | 13105 | 1 |
| D | 0 | 16991 | 1 |
| Mode M9 | |||
|---|---|---|---|
| Quadrant | BADHDUFLAG | Total packets | Discarded packets |
| A | 0 | 13 | 0 |
| B | 0 | 13 | 0 |
| C | 0 | 13 | 0 |
| D | 0 | 13 | 0 |
| Quadrant | Total seconds | Saturated seconds | Saturation percentage |
|---|---|---|---|
| A | 5837 | 60 | 1.027925% |
| B | 5836 | 64 | 1.096642% |
| C | 5836 | 93 | 1.593557% |
| D | 5836 | 271 | 4.643592% |
Noise dominated data is calculated using 1-second bins in cleaned event files. If a bin has >2000 counts, and if more than 50% of those come from <1% of pixels, then it is considered to be noise-dominated and hence unusable.
| Quadrant | # 1 sec bins | Bins with >0 counts | Bins with >2000 counts | High rate bins dominated by noise | Noise dominated (total time) | Noise dominated (detector-on time) | Marked lightcurve |
|---|---|---|---|---|---|---|---|
| A | 7142 | 5838 | 3 | 3 | 0.04% | 0.05% | 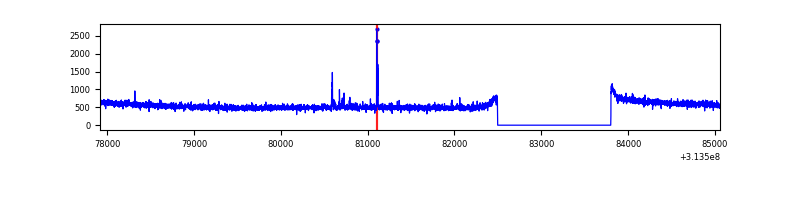 |
| B | 7141 | 5837 | 2 | 2 | 0.03% | 0.03% | 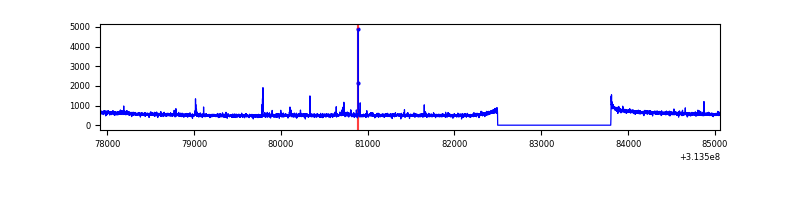 |
| C | 7141 | 5837 | 2 | 2 | 0.03% | 0.03% | 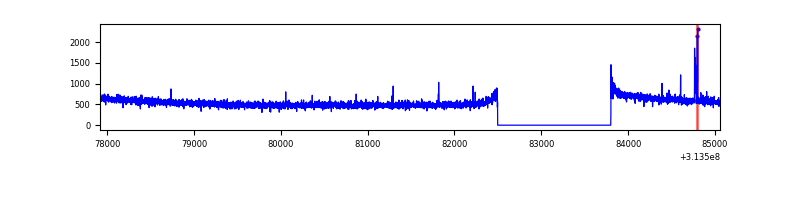 |
| D | 7141 | 5837 | 213 | 213 | 2.98% | 3.65% | 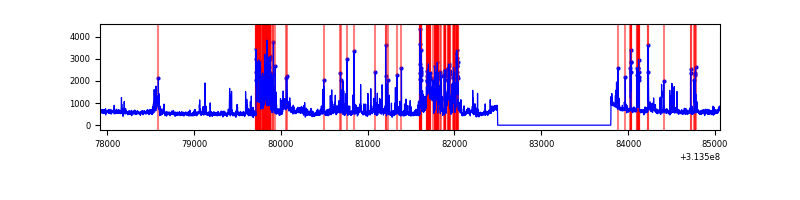 |
Top three noisy pixels from each quadrant. If the there are fewer than three noisy pixels in the level2.evt file, extra rows are filled as -1
| Pixel properties | Quadrant properties | ||||||
|---|---|---|---|---|---|---|---|
| Quadrant | DetID | PixID | Counts | Sigma | Mean | Median | Sigma |
| A | 4 | 2 | 38679 | 236.43 | 817 | 802 | 160.2 |
| A | 13 | 254 | 9840 | 56.41 | 817 | 802 | 160.2 |
| A | 0 | 226 | 7435 | 41.4 | 817 | 802 | 160.2 |
| B | 0 | 230 | 24326 | 159.44 | 801 | 787 | 147.6 |
| B | 0 | 245 | 16559 | 106.83 | 801 | 787 | 147.6 |
| B | 0 | 219 | 16438 | 106.01 | 801 | 787 | 147.6 |
| C | 14 | 238 | 124463 | 698.5 | 775 | 783 | 177.1 |
| C | 10 | 22 | 26515 | 145.32 | 775 | 783 | 177.1 |
| C | 13 | 61 | 5338 | 25.72 | 775 | 783 | 177.1 |
| D | 12 | 33 | 753169 | 3967.51 | 788 | 769 | 189.6 |
| D | 1 | 52 | 429955 | 2263.16 | 788 | 769 | 189.6 |
| D | 5 | 222 | 57078 | 296.92 | 788 | 769 | 189.6 |
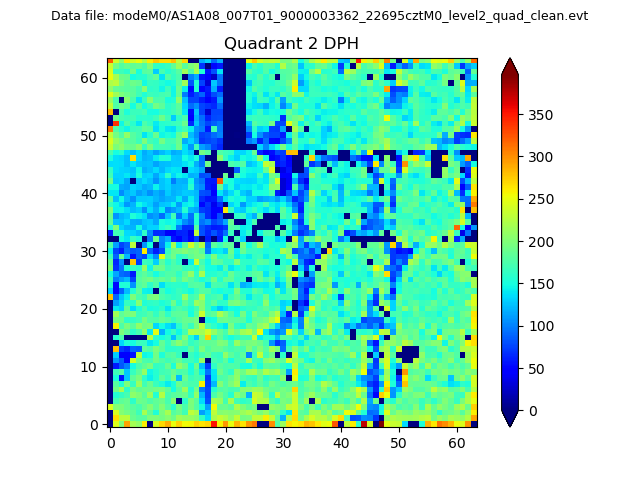
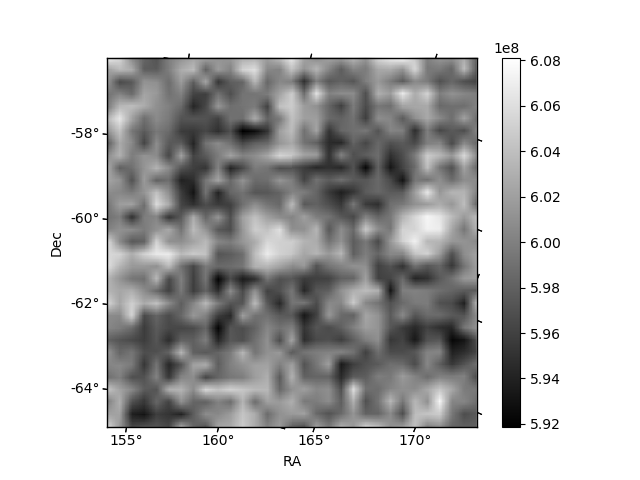
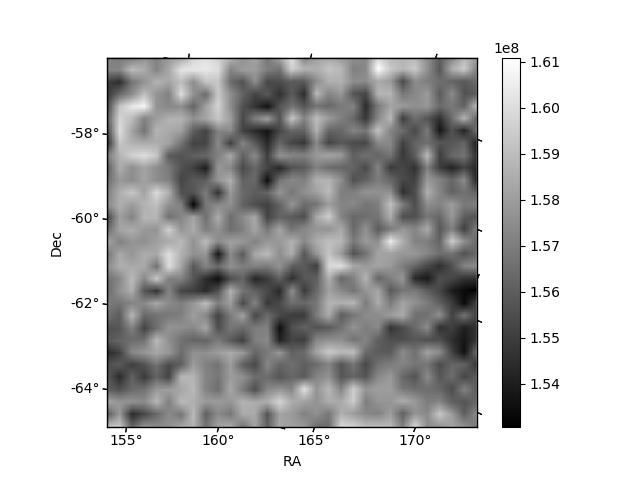
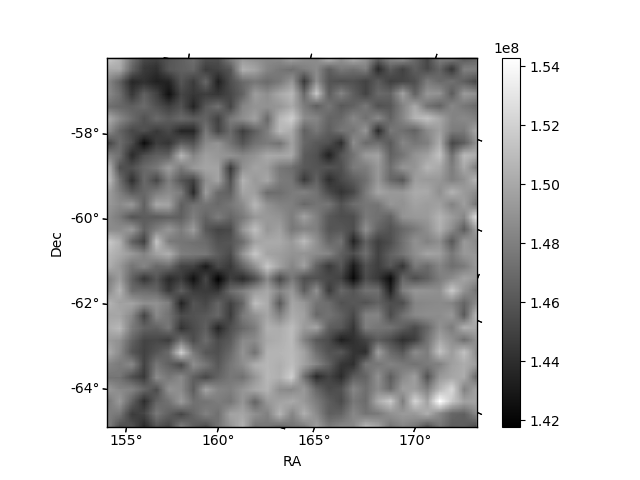
Histogram calculated using DETX and DETY for each event in the final _common_clean file
| Quadrant A | 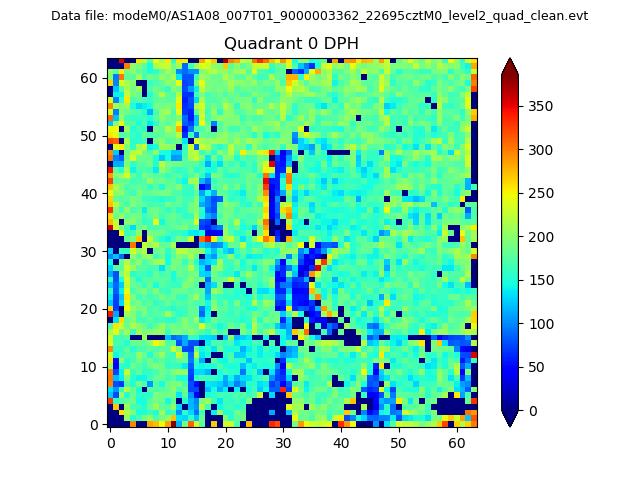 |
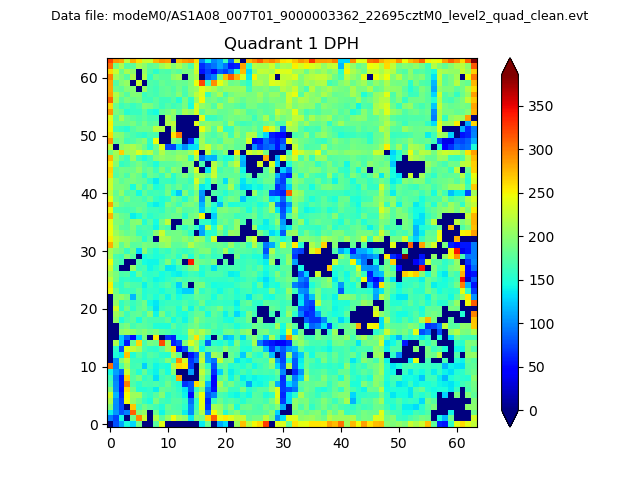 |
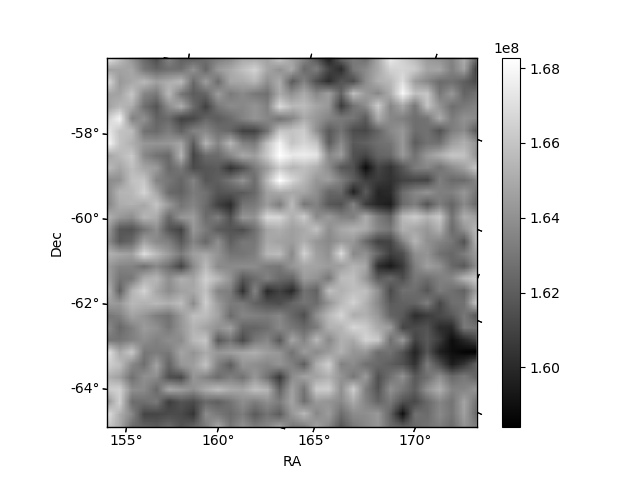
Quadrant B |
|---|---|---|---|
| Quadrant D | 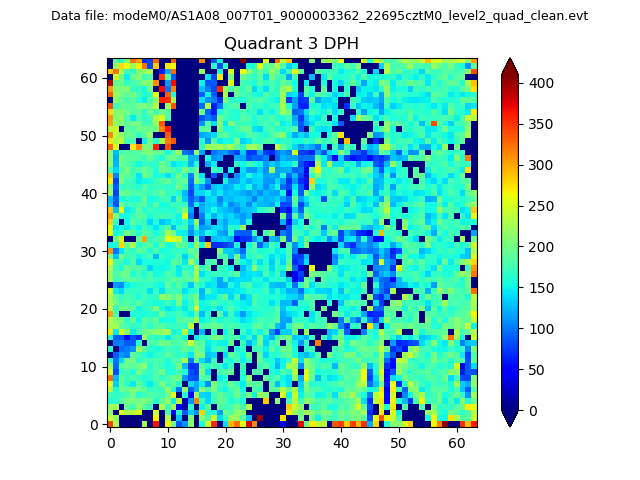 |
 |
Quadrant C |
| Plot type | Count rate plots | Images |
|---|---|---|
| Comparison with Poisson distribution Blue bars denote a histogram of data divided into 1 sec bins. Red curve is a Poisson curve with rate = median count rate of data. |
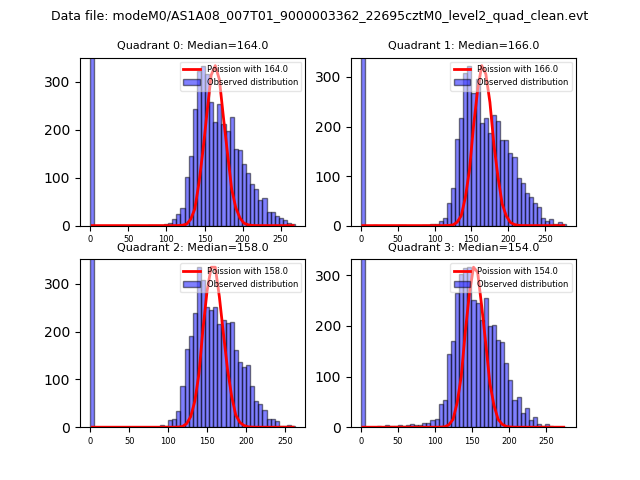 |
 |
| Quadrant-wise count rates Data is divided into 100 sec bins |
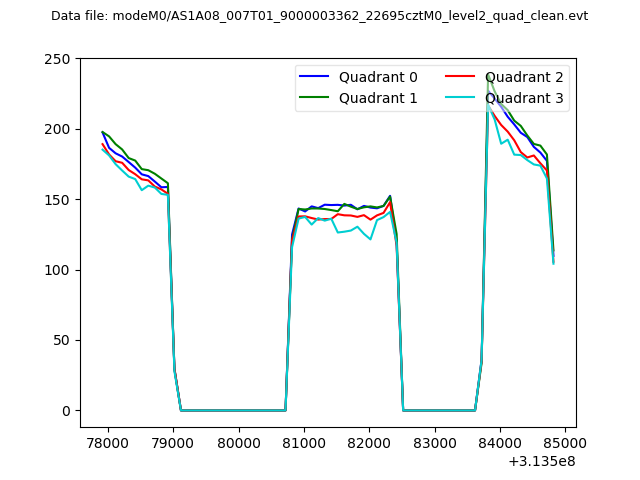 |
|
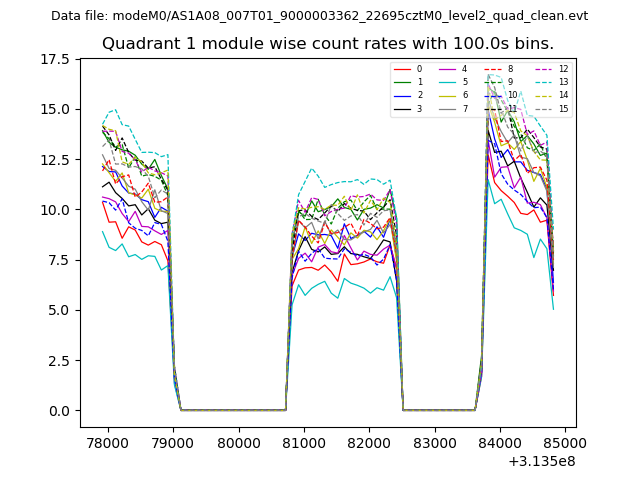
| Module-wise count rates for Quadrant A Data is divided into 100 sec bins |
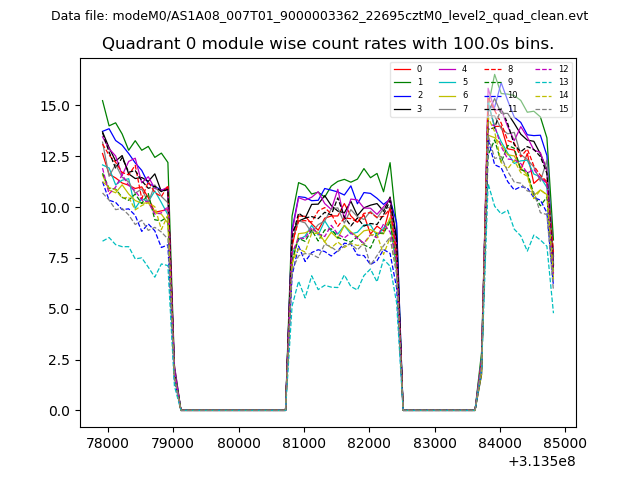 |
 |
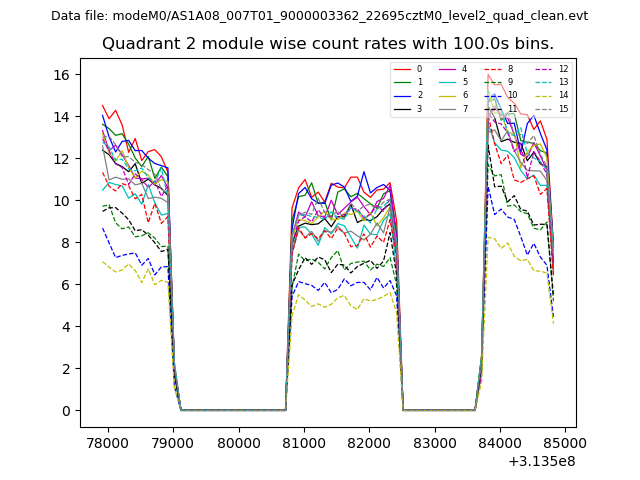
| Module-wise count rates for Quadrant B Data is divided into 100 sec bins |
 |
 |
| Module-wise count rates for Quadrant C Data is divided into 100 sec bins |
 |
 |
| Module-wise count rates for Quadrant D Data is divided into 100 sec bins |
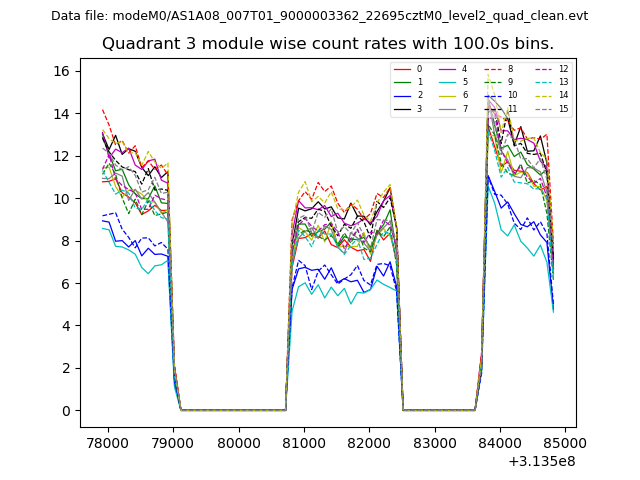 |
 |
| Parameter | Plot |
|---|---|
| CZT HV Monitor | 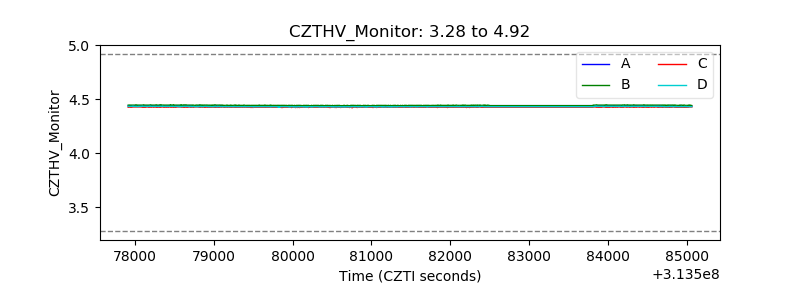 |
| D_VDD | 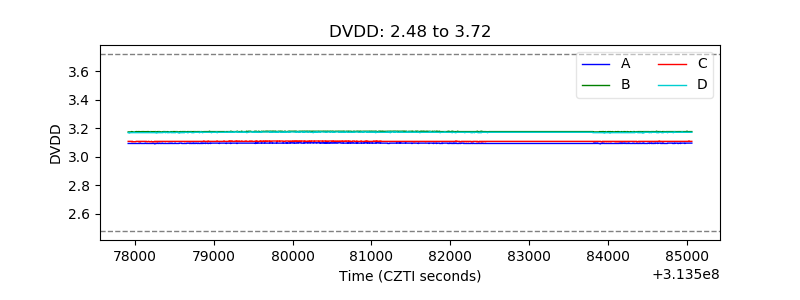 |
| Temperature 1 |  |
| Veto HV Monitor |  |
| Veto LLD | 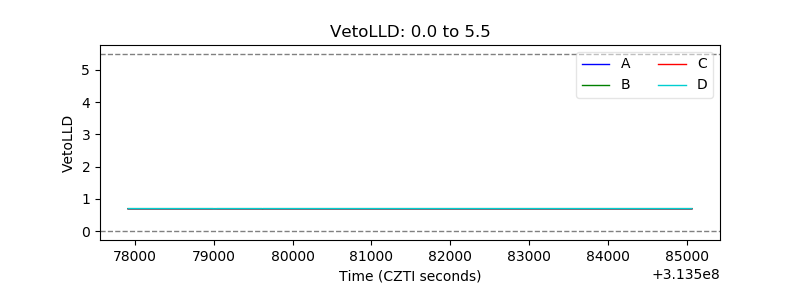 |
| Alpha Counter | 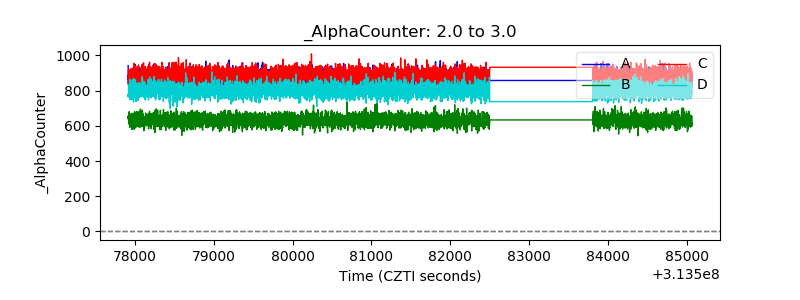 |
| _CPM_Rate | 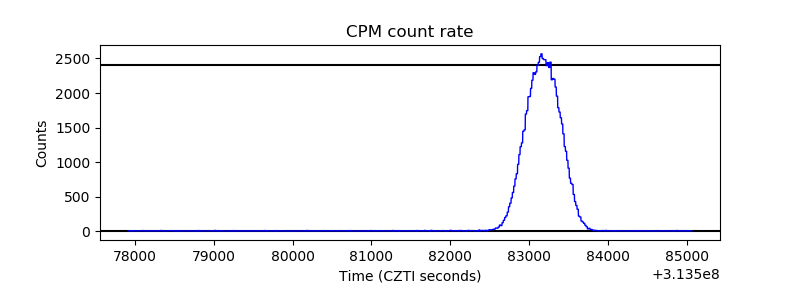 |
| CZT Counter | 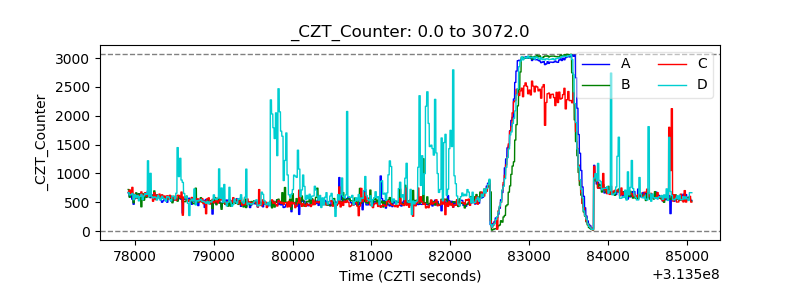 |
| +2.5 Volts monitor |  |
| +5 Volts monitor |  |
| _ROLL_ROT | 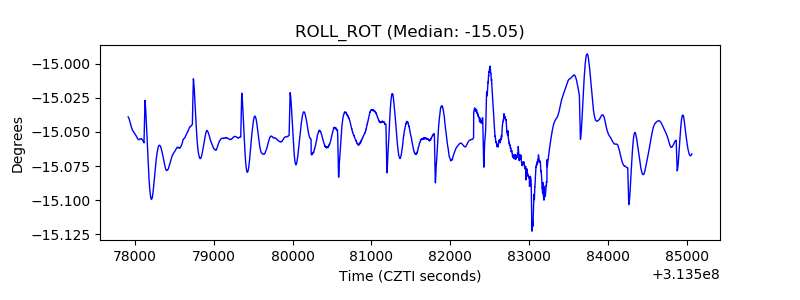 |
| _Roll_DEC | 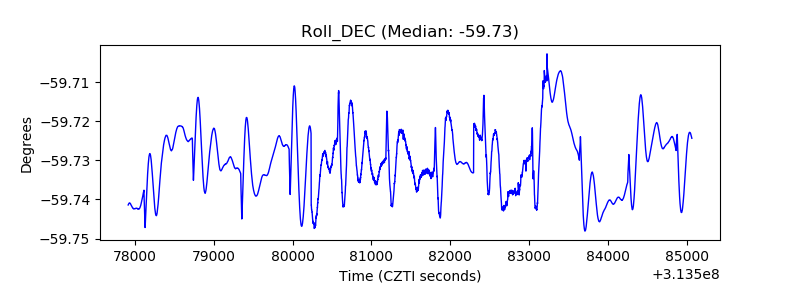 |
| _Roll_RA | 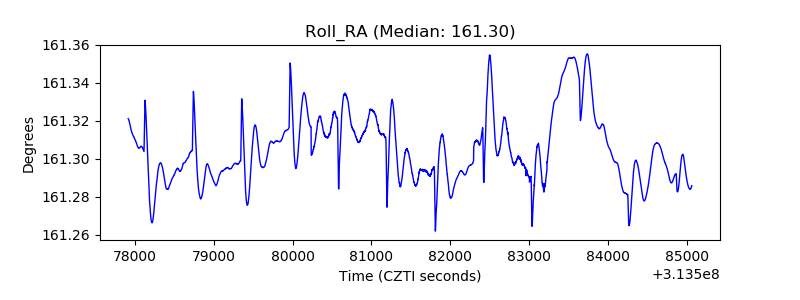 |
| Veto Counter | 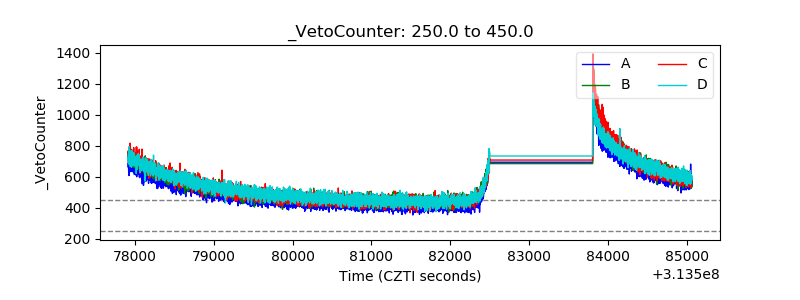 |