| Param | Original file | Final file |
|---|---|---|
| Filename | modeM0/AS1A08_007T01_9000003362_22696cztM0_level2.evt | modeM0/AS1A08_007T01_9000003362_22696cztM0_level2_quad_clean.evt |
| Size (bytes) | 536,581,440 | 88,899,840 |
| Size | 511.7 MB | 84.8 MB |
| Events in quadrant A | 3,391,917 | 585,980 |
| Events in quadrant B | 3,473,109 | 590,003 |
| Events in quadrant C | 3,503,065 | 550,715 |
| Events in quadrant D | 5,463,798 | 534,296 |
| Mode SS | |||
|---|---|---|---|
| Quadrant | BADHDUFLAG | Total packets | Discarded packets |
| A | 0 | 126 | 0 |
| B | 0 | 126 | 0 |
| C | 0 | 126 | 0 |
| D | 0 | 126 | 0 |
| Mode M0 | |||
|---|---|---|---|
| Quadrant | BADHDUFLAG | Total packets | Discarded packets |
| A | 0 | 13865 | 1 |
| B | 0 | 14151 | 1 |
| C | 0 | 14257 | 1 |
| D | 0 | 20517 | 1 |
| Mode M9 | |||
|---|---|---|---|
| Quadrant | BADHDUFLAG | Total packets | Discarded packets |
| A | 0 | 13 | 0 |
| B | 0 | 13 | 0 |
| C | 0 | 13 | 0 |
| D | 0 | 13 | 0 |
| Quadrant | Total seconds | Saturated seconds | Saturation percentage |
|---|---|---|---|
| A | 6172 | 65 | 1.053143% |
| B | 6173 | 80 | 1.295966% |
| C | 6173 | 167 | 2.705330% |
| D | 6173 | 550 | 8.909768% |
Noise dominated data is calculated using 1-second bins in cleaned event files. If a bin has >2000 counts, and if more than 50% of those come from <1% of pixels, then it is considered to be noise-dominated and hence unusable.
| Quadrant | # 1 sec bins | Bins with >0 counts | Bins with >2000 counts | High rate bins dominated by noise | Noise dominated (total time) | Noise dominated (detector-on time) | Marked lightcurve |
|---|---|---|---|---|---|---|---|
| A | 7538 | 6174 | 0 | 0 | 0.00% | 0.00% | 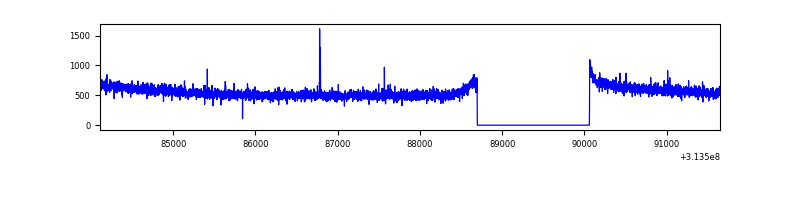 |
| B | 7539 | 6175 | 3 | 3 | 0.04% | 0.05% | 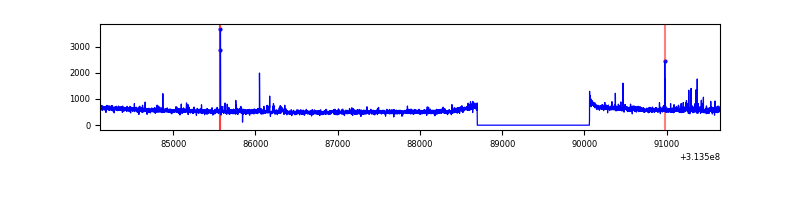 |
| C | 7539 | 6175 | 53 | 53 | 0.70% | 0.86% | 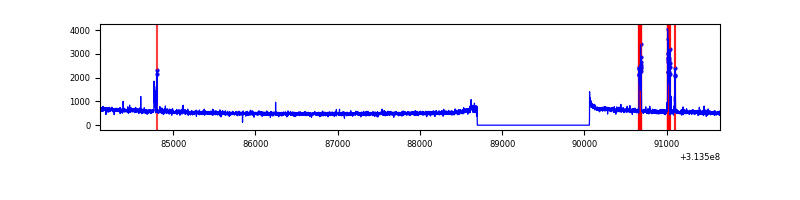 |
| D | 7539 | 6175 | 421 | 421 | 5.58% | 6.82% | 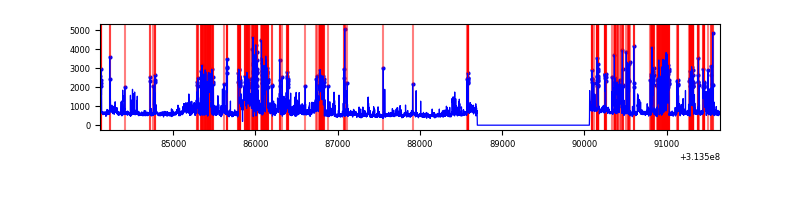 |
Top three noisy pixels from each quadrant. If the there are fewer than three noisy pixels in the level2.evt file, extra rows are filled as -1
| Pixel properties | Quadrant properties | ||||||
|---|---|---|---|---|---|---|---|
| Quadrant | DetID | PixID | Counts | Sigma | Mean | Median | Sigma |
| A | 13 | 254 | 11513 | 62.33 | 876 | 863 | 170.9 |
| A | 13 | 170 | 8383 | 44.01 | 876 | 863 | 170.9 |
| A | 0 | 226 | 7841 | 40.84 | 876 | 863 | 170.9 |
| B | 0 | 230 | 29540 | 183.3 | 860 | 844 | 156.5 |
| B | 0 | 228 | 28781 | 178.46 | 860 | 844 | 156.5 |
| B | 0 | 190 | 19135 | 116.84 | 860 | 844 | 156.5 |
| C | 10 | 22 | 176049 | 942.23 | 819 | 828 | 186.0 |
| C | 14 | 238 | 132641 | 708.81 | 819 | 828 | 186.0 |
| C | 13 | 61 | 5712 | 26.26 | 819 | 828 | 186.0 |
| D | 1 | 52 | 1343867 | 6871.73 | 823 | 804 | 195.4 |
| D | 12 | 33 | 525860 | 2686.43 | 823 | 804 | 195.4 |
| D | 12 | 233 | 190456 | 970.35 | 823 | 804 | 195.4 |
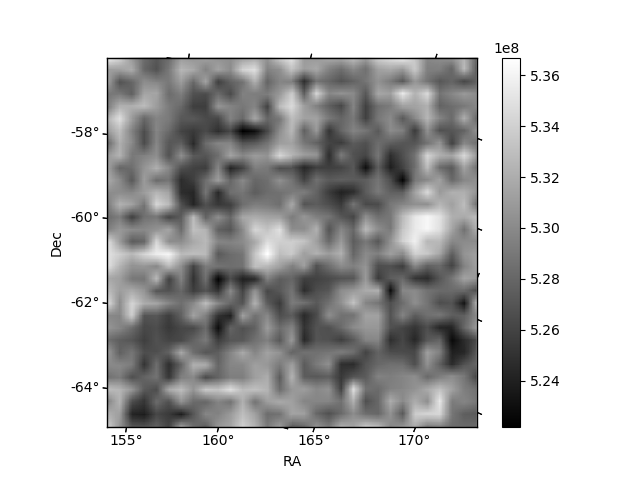
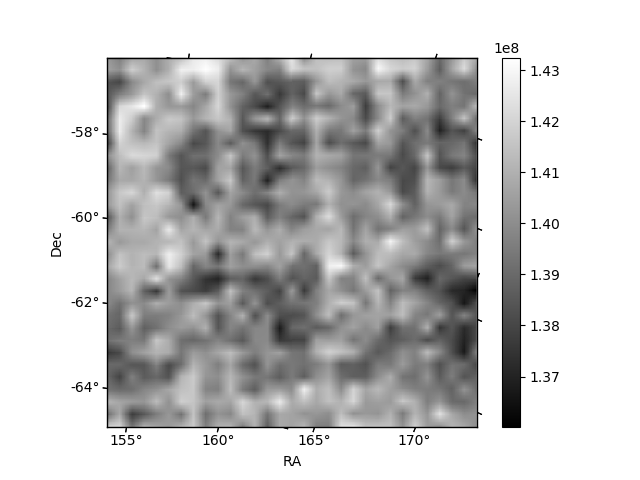
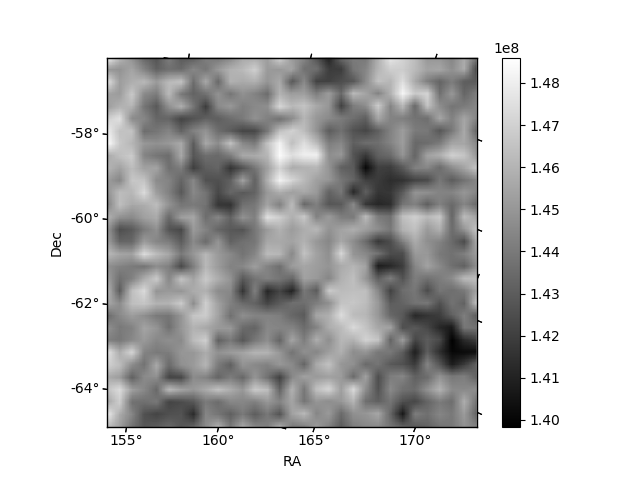
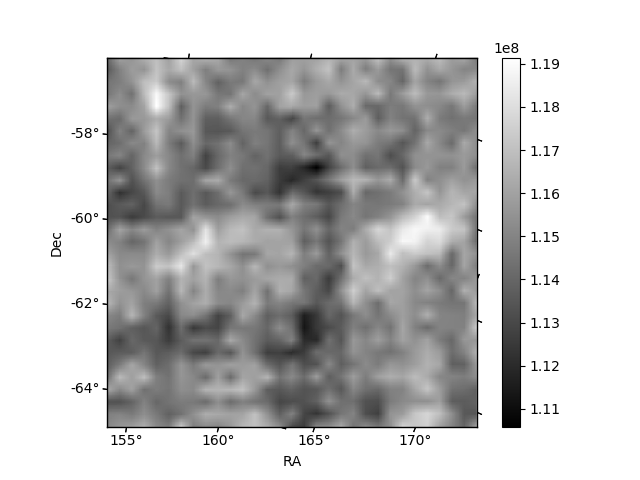
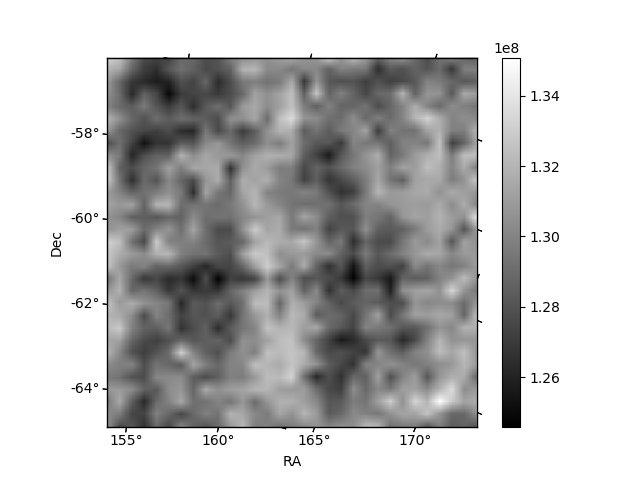
Histogram calculated using DETX and DETY for each event in the final _common_clean file
| Quadrant A | 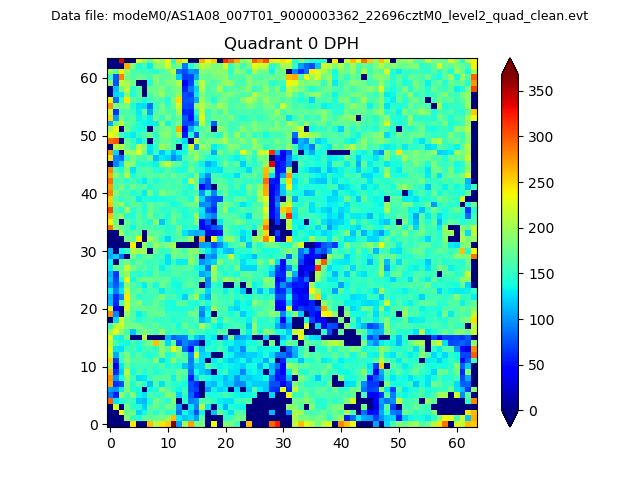 |
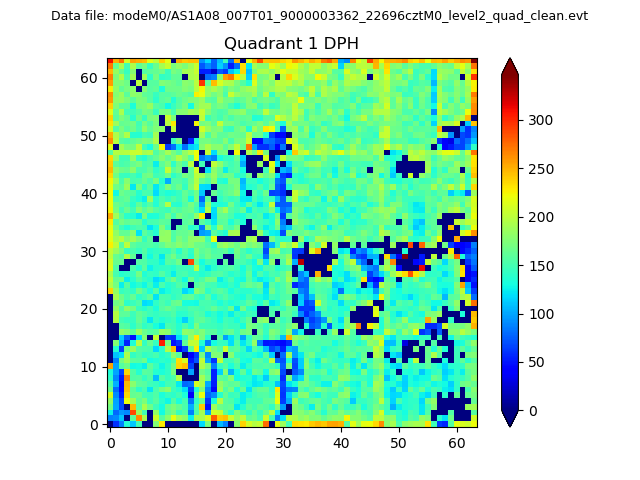 |
Quadrant B |
|---|---|---|---|
| Quadrant D | 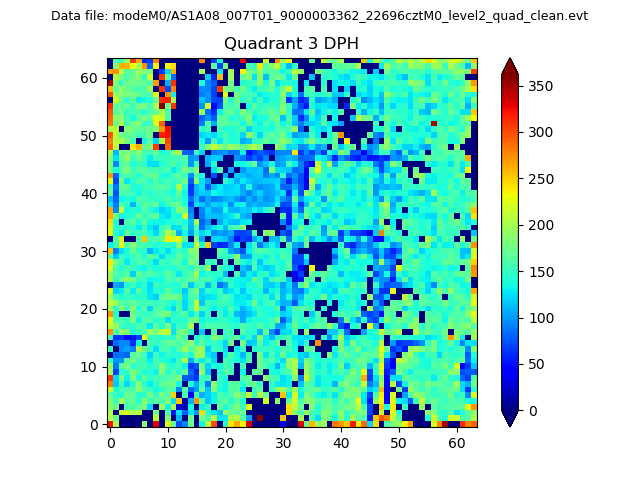 |
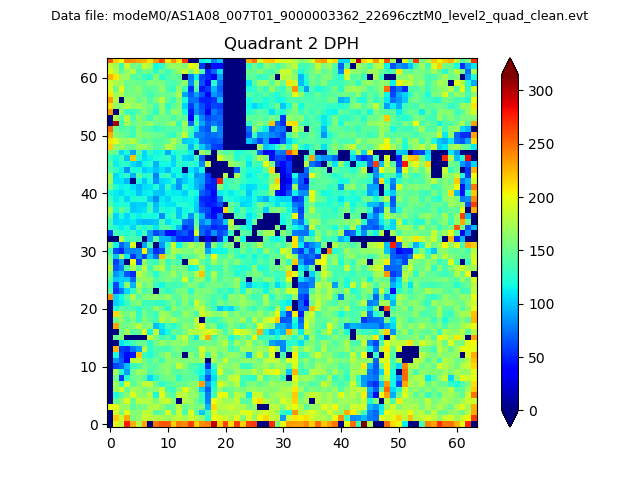 |
Quadrant C |
| Plot type | Count rate plots | Images |
|---|---|---|
| Comparison with Poisson distribution Blue bars denote a histogram of data divided into 1 sec bins. Red curve is a Poisson curve with rate = median count rate of data. |
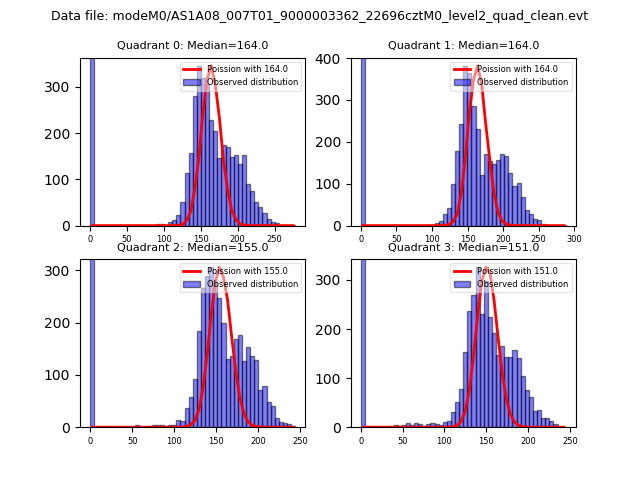 |
 |
| Quadrant-wise count rates Data is divided into 100 sec bins |
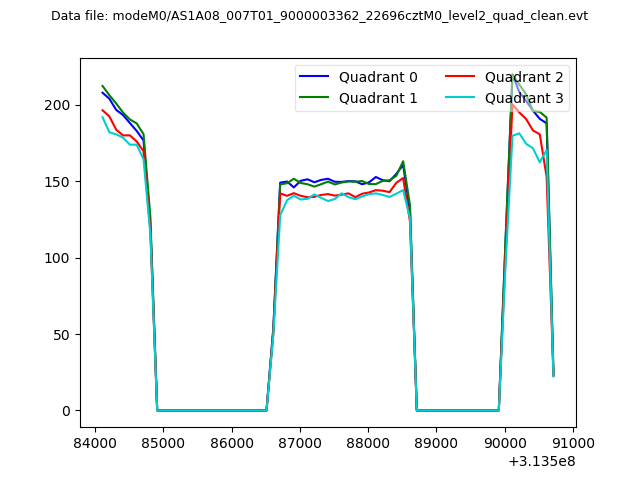 |
|
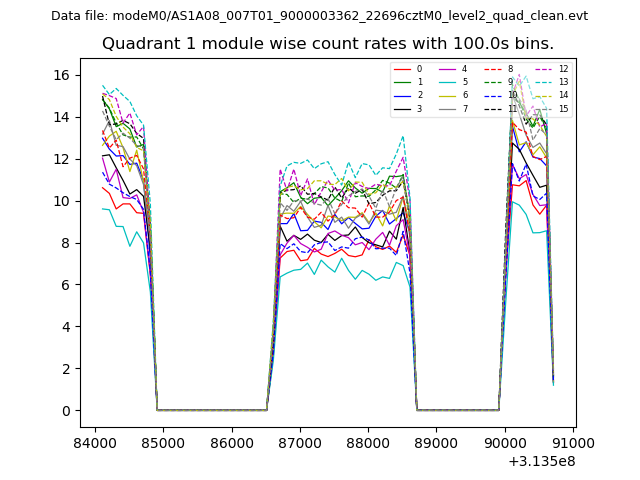
| Module-wise count rates for Quadrant A Data is divided into 100 sec bins |
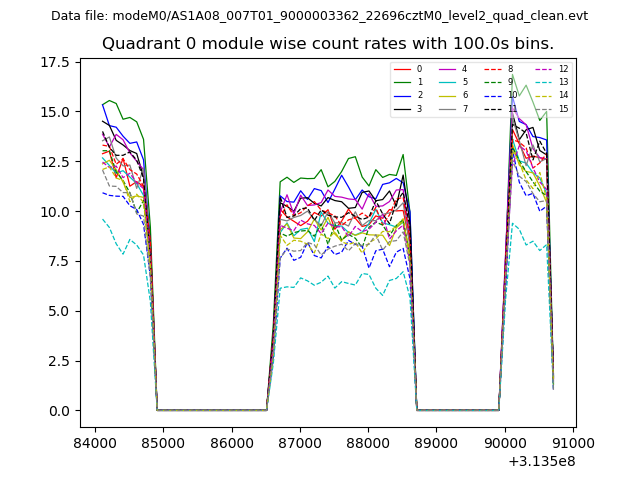 |
 |
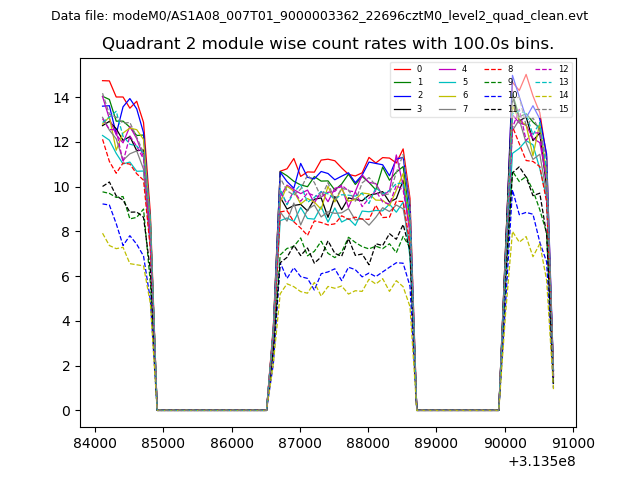
| Module-wise count rates for Quadrant B Data is divided into 100 sec bins |
 |
 |
| Module-wise count rates for Quadrant C Data is divided into 100 sec bins |
 |
 |
| Module-wise count rates for Quadrant D Data is divided into 100 sec bins |
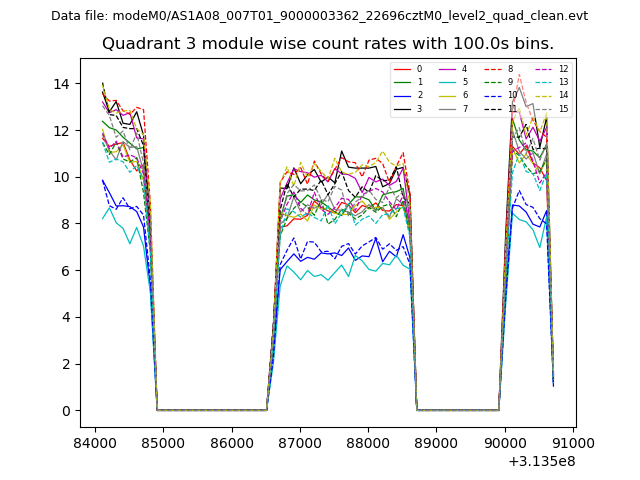 |
 |
| Parameter | Plot |
|---|---|
| CZT HV Monitor | 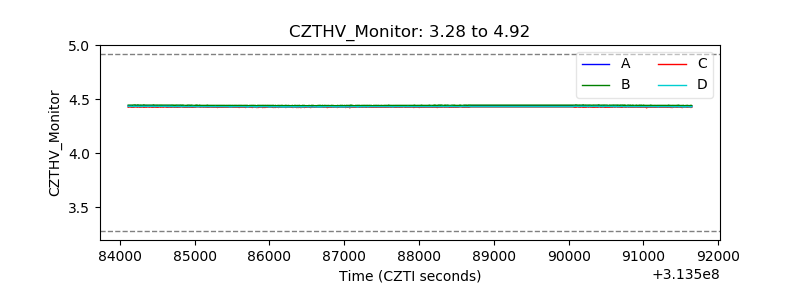 |
| D_VDD | 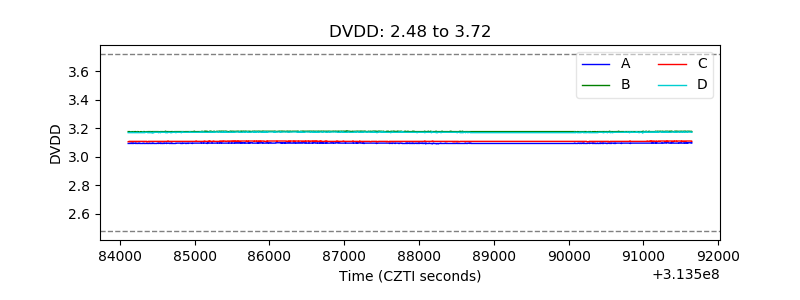 |
| Temperature 1 | 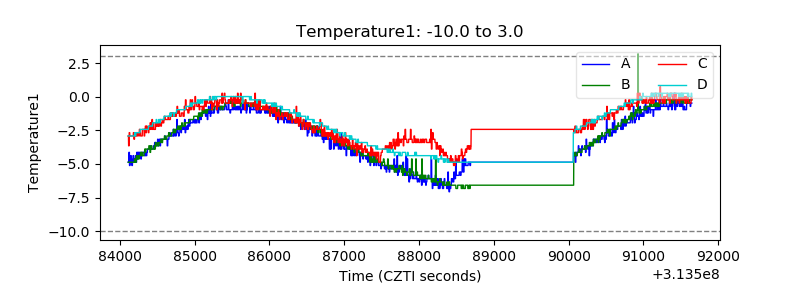 |
| Veto HV Monitor |  |
| Veto LLD | 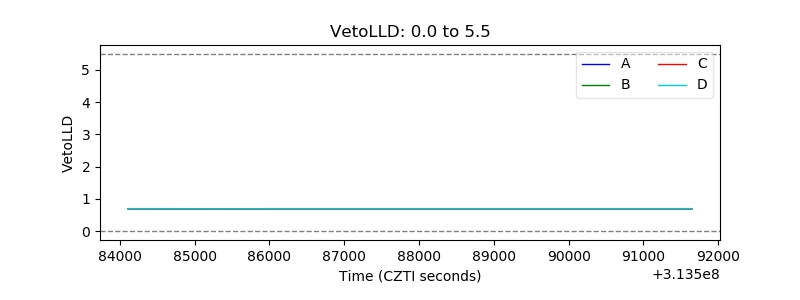 |
| Alpha Counter | 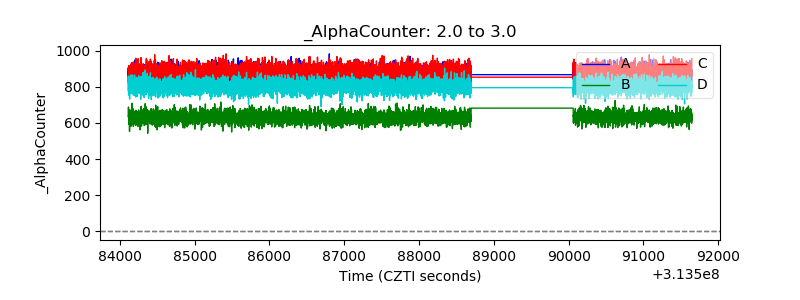 |
| _CPM_Rate | 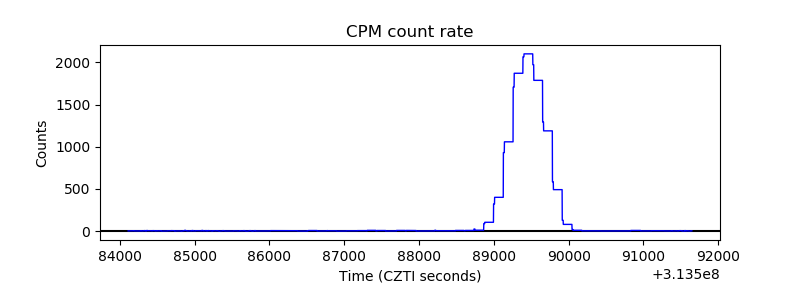 |
| CZT Counter | 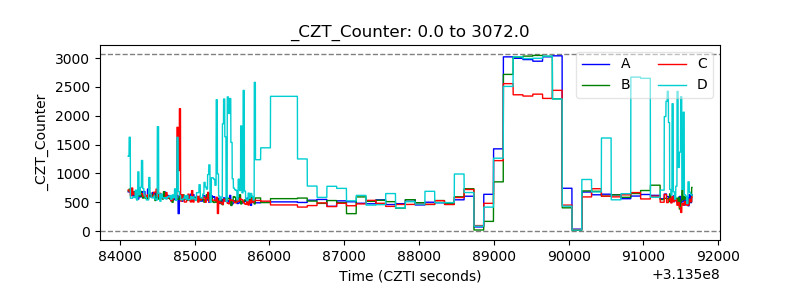 |
| +2.5 Volts monitor |  |
| +5 Volts monitor |  |
| _ROLL_ROT | 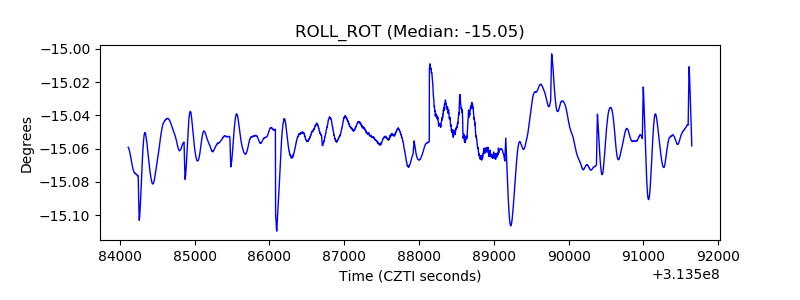 |
| _Roll_DEC |  |
| _Roll_RA | 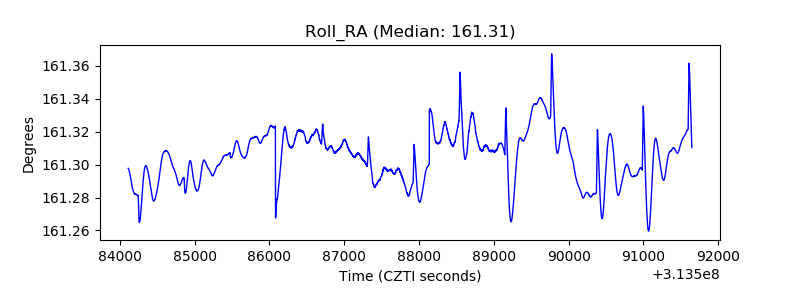 |
| Veto Counter | 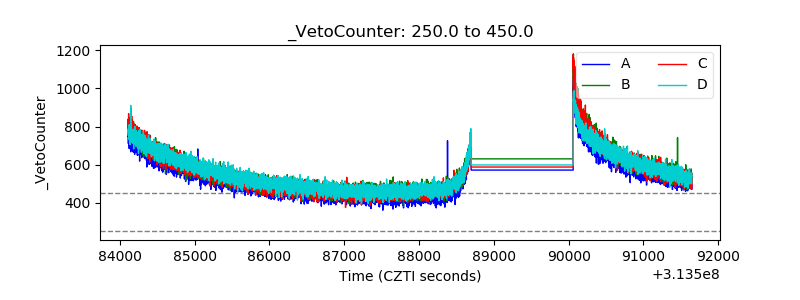 |