| Param | Original file | Final file |
|---|---|---|
| Filename | modeM0/AS1A08_007T01_9000003362_22699cztM0_level2.evt | modeM0/AS1A08_007T01_9000003362_22699cztM0_level2_quad_clean.evt |
| Size (bytes) | 497,004,480 | 83,289,600 |
| Size | 474.0 MB | 79.4 MB |
| Events in quadrant A | 3,140,623 | 534,172 |
| Events in quadrant B | 3,302,598 | 536,058 |
| Events in quadrant C | 3,148,605 | 509,905 |
| Events in quadrant D | 5,018,622 | 488,420 |
| Mode SS | |||
|---|---|---|---|
| Quadrant | BADHDUFLAG | Total packets | Discarded packets |
| A | 0 | 132 | 0 |
| B | 0 | 132 | 0 |
| C | 0 | 132 | 0 |
| D | 0 | 132 | 0 |
| Mode M0 | |||
|---|---|---|---|
| Quadrant | BADHDUFLAG | Total packets | Discarded packets |
| A | 0 | 13346 | 1 |
| B | 0 | 13757 | 1 |
| C | 0 | 13425 | 1 |
| D | 0 | 19226 | 1 |
| Mode M9 | |||
|---|---|---|---|
| Quadrant | BADHDUFLAG | Total packets | Discarded packets |
| A | 0 | 7 | 0 |
| B | 0 | 7 | 0 |
| C | 0 | 7 | 0 |
| D | 0 | 7 | 0 |
| Quadrant | Total seconds | Saturated seconds | Saturation percentage |
|---|---|---|---|
| A | 6501 | 89 | 1.369020% |
| B | 6501 | 103 | 1.584372% |
| C | 6501 | 110 | 1.692047% |
| D | 6502 | 429 | 6.597970% |
Noise dominated data is calculated using 1-second bins in cleaned event files. If a bin has >2000 counts, and if more than 50% of those come from <1% of pixels, then it is considered to be noise-dominated and hence unusable.
| Quadrant | # 1 sec bins | Bins with >0 counts | Bins with >2000 counts | High rate bins dominated by noise | Noise dominated (total time) | Noise dominated (detector-on time) | Marked lightcurve |
|---|---|---|---|---|---|---|---|
| A | 7256 | 6502 | 0 | 0 | 0.00% | 0.00% | 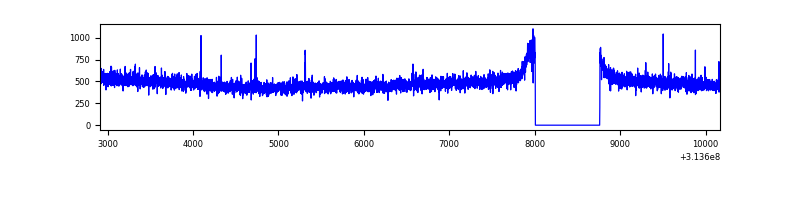 |
| B | 7256 | 6502 | 2 | 2 | 0.03% | 0.03% | 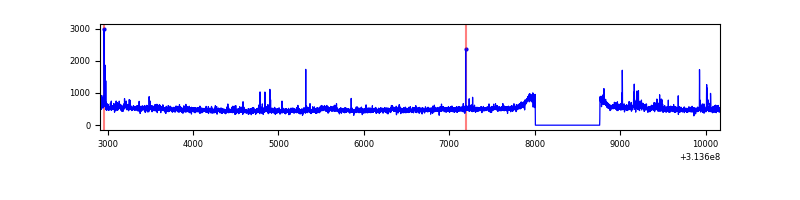 |
| C | 7256 | 6502 | 0 | 0 | 0.00% | 0.00% | 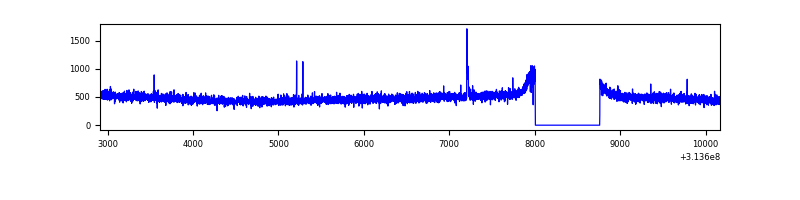 |
| D | 7257 | 6503 | 296 | 296 | 4.08% | 4.55% | 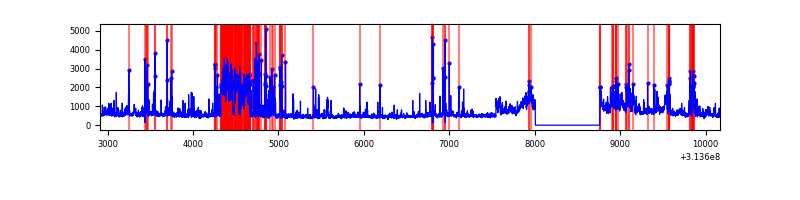 |
Top three noisy pixels from each quadrant. If the there are fewer than three noisy pixels in the level2.evt file, extra rows are filled as -1
| Pixel properties | Quadrant properties | ||||||
|---|---|---|---|---|---|---|---|
| Quadrant | DetID | PixID | Counts | Sigma | Mean | Median | Sigma |
| A | 13 | 254 | 11991 | 68.99 | 811 | 796 | 162.3 |
| A | 0 | 226 | 7164 | 39.25 | 811 | 796 | 162.3 |
| A | 3 | 137 | 6303 | 33.94 | 811 | 796 | 162.3 |
| B | 0 | 190 | 37940 | 241.99 | 808 | 789 | 153.5 |
| B | 0 | 230 | 30499 | 193.52 | 808 | 789 | 153.5 |
| B | 0 | 228 | 23315 | 146.73 | 808 | 789 | 153.5 |
| C | 14 | 238 | 122435 | 675.1 | 772 | 776 | 180.2 |
| C | 10 | 22 | 17240 | 91.36 | 772 | 776 | 180.2 |
| C | 13 | 61 | 5431 | 25.83 | 772 | 776 | 180.2 |
| D | 1 | 52 | 621906 | 3331.15 | 771 | 750 | 186.5 |
| D | 13 | 172 | 554796 | 2971.25 | 771 | 750 | 186.5 |
| D | 12 | 33 | 303356 | 1622.82 | 771 | 750 | 186.5 |
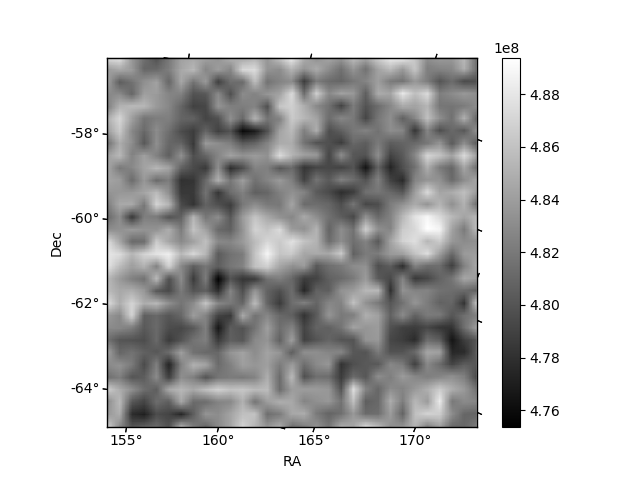
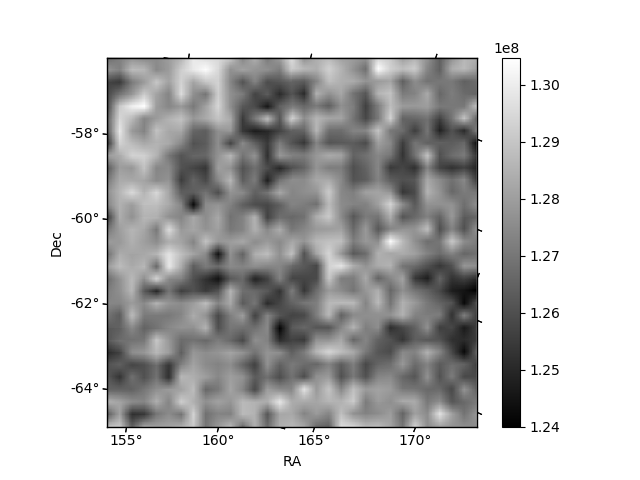
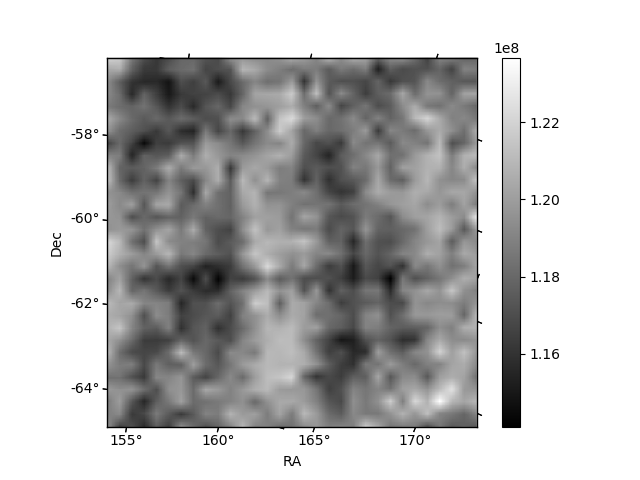
Histogram calculated using DETX and DETY for each event in the final _common_clean file
| Quadrant A | 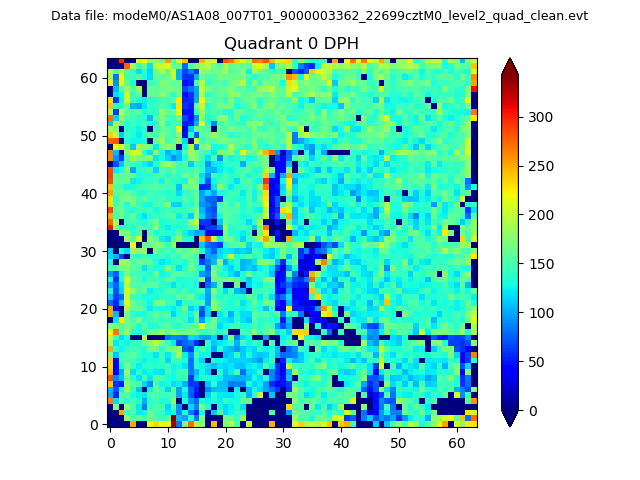 |
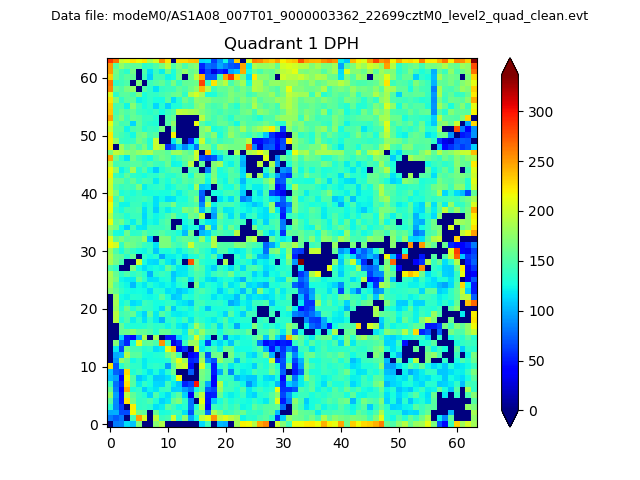 |
Quadrant B |
|---|---|---|---|
| Quadrant D | 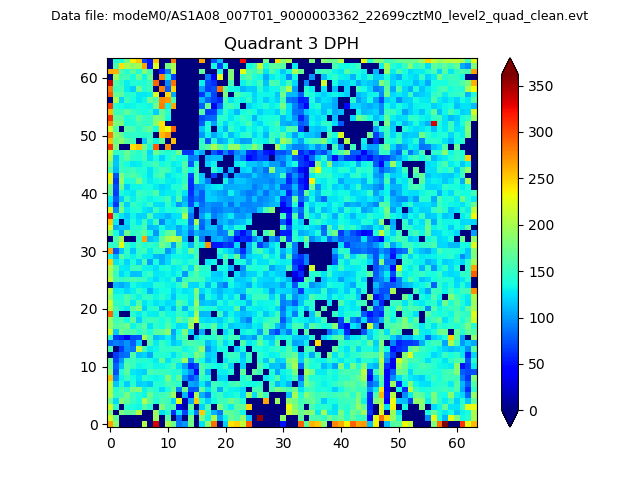 |
 |
Quadrant C |
| Plot type | Count rate plots | Images |
|---|---|---|
| Comparison with Poisson distribution Blue bars denote a histogram of data divided into 1 sec bins. Red curve is a Poisson curve with rate = median count rate of data. |
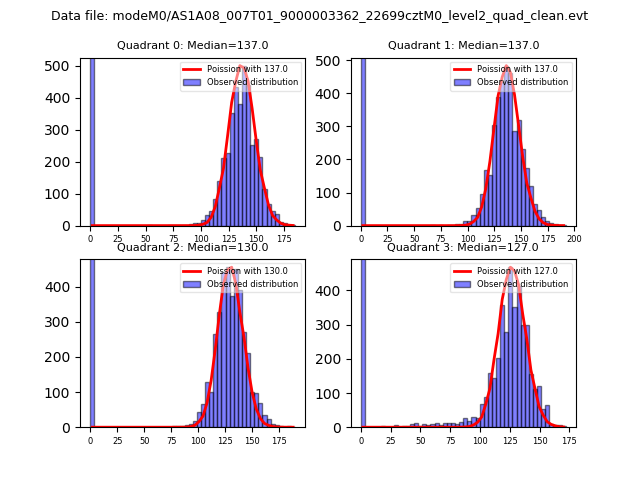 |
 |
| Quadrant-wise count rates Data is divided into 100 sec bins |
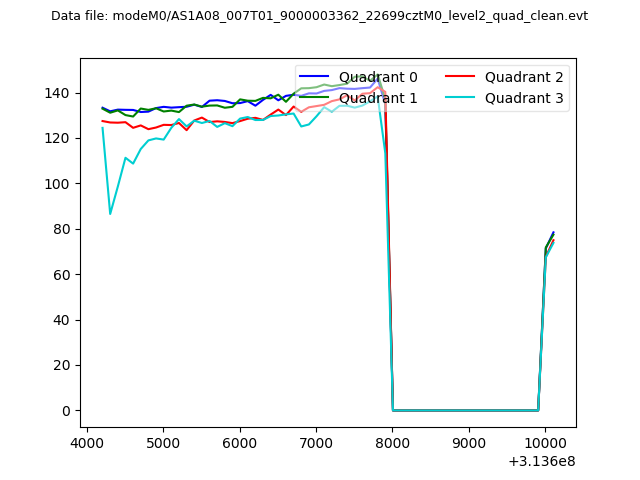 |
|
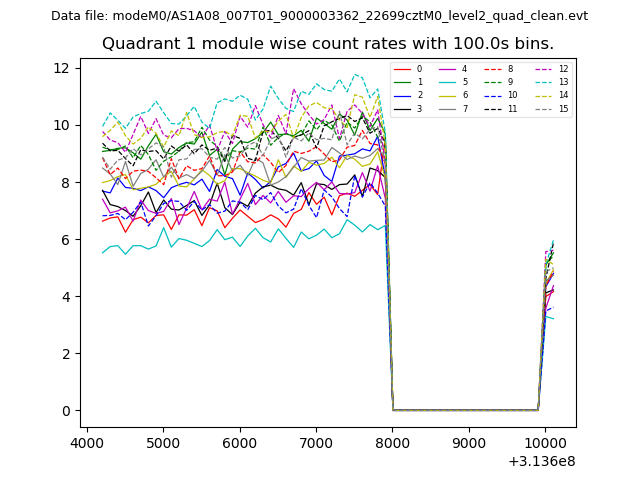
| Module-wise count rates for Quadrant A Data is divided into 100 sec bins |
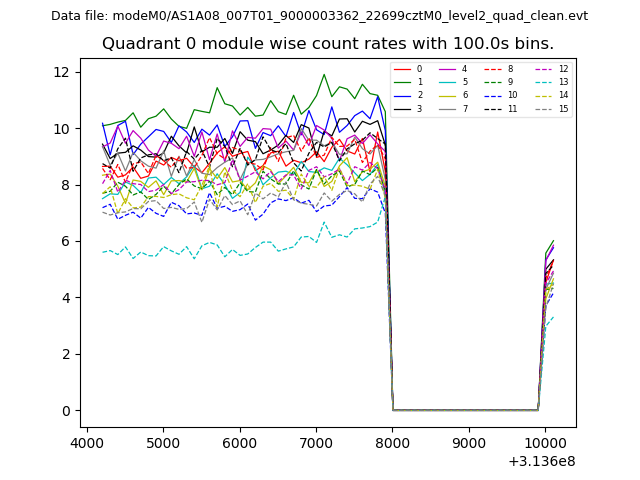 |
 |
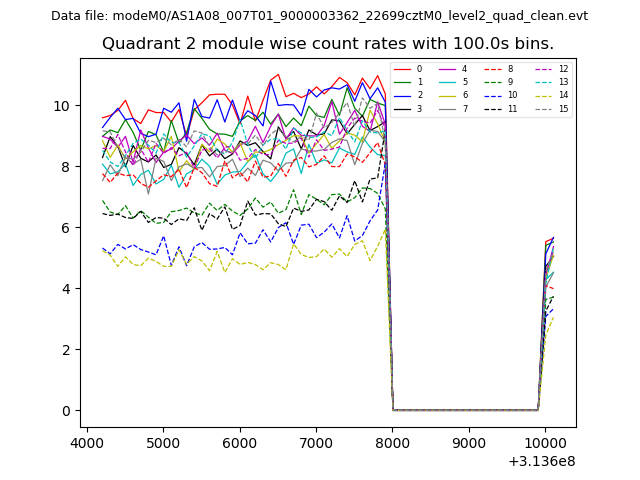
| Module-wise count rates for Quadrant B Data is divided into 100 sec bins |
 |
 |
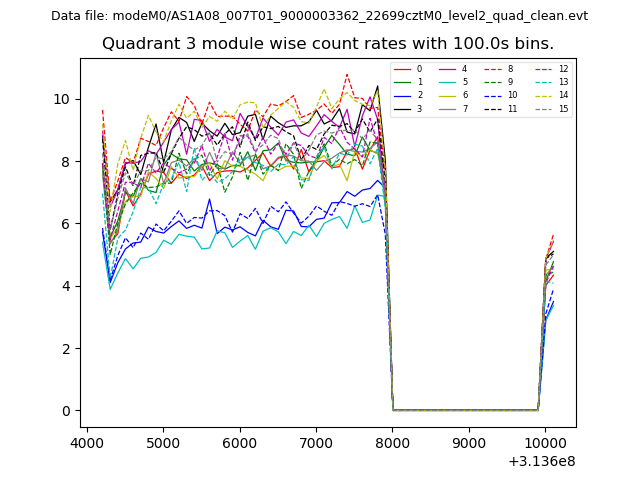
| Module-wise count rates for Quadrant C Data is divided into 100 sec bins |
 |
 |
| Module-wise count rates for Quadrant D Data is divided into 100 sec bins |
 |
 |
| Parameter | Plot |
|---|---|
| CZT HV Monitor | 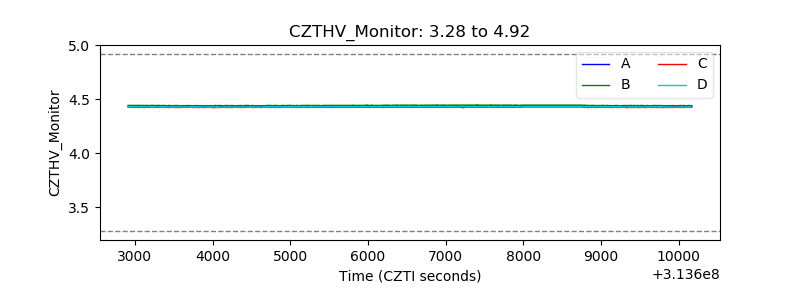 |
| D_VDD | 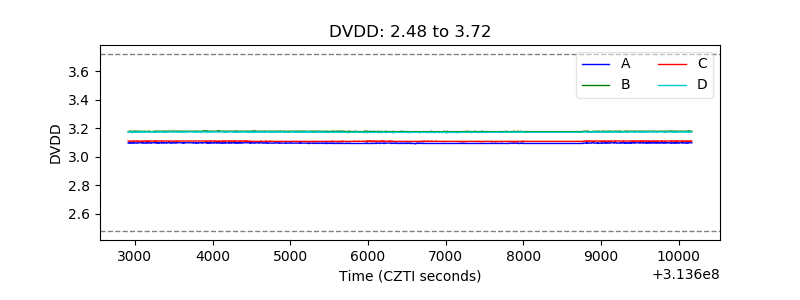 |
| Temperature 1 | 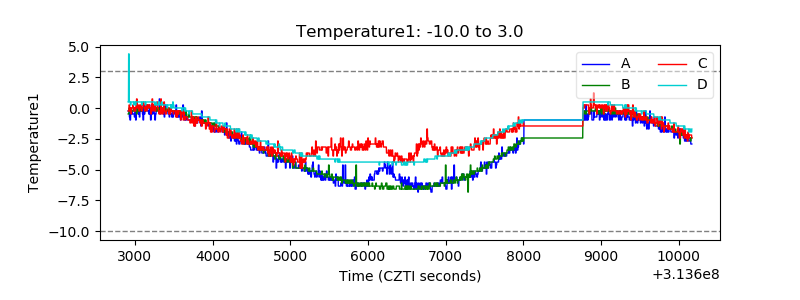 |
| Veto HV Monitor | 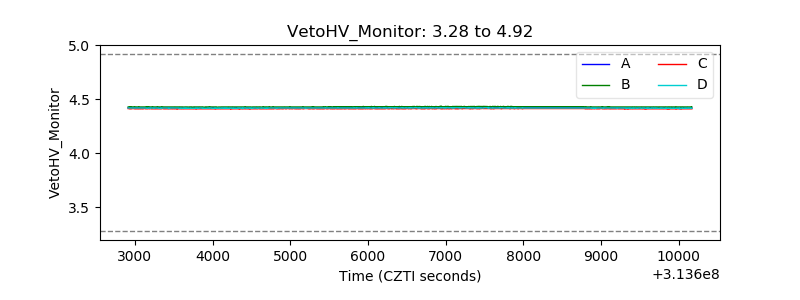 |
| Veto LLD | 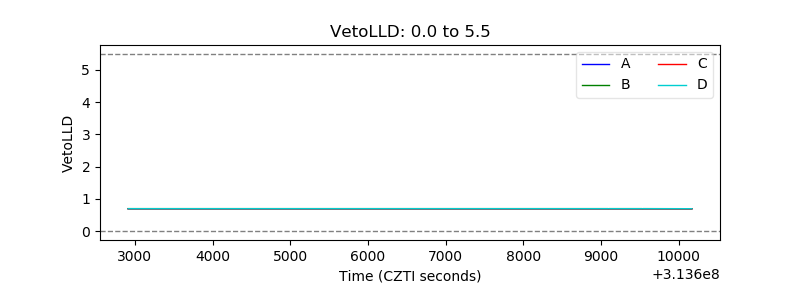 |
| Alpha Counter | 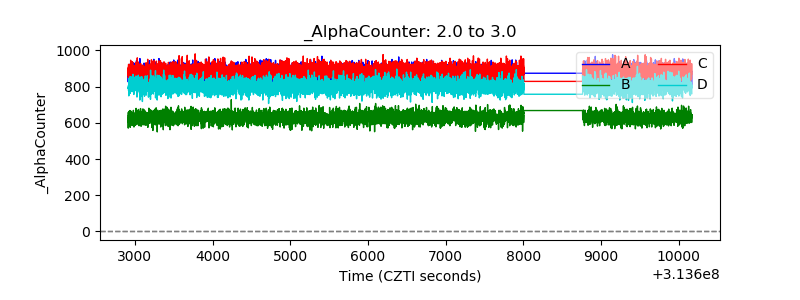 |
| _CPM_Rate | 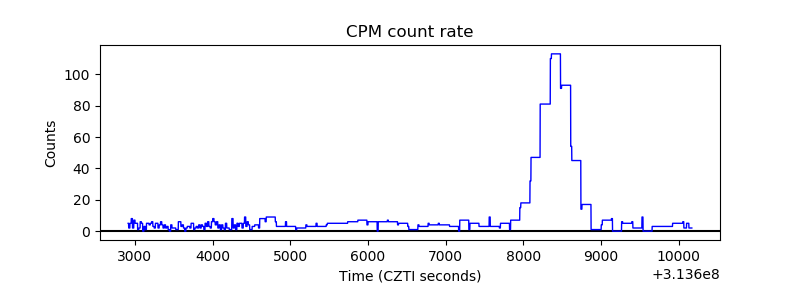 |
| CZT Counter | 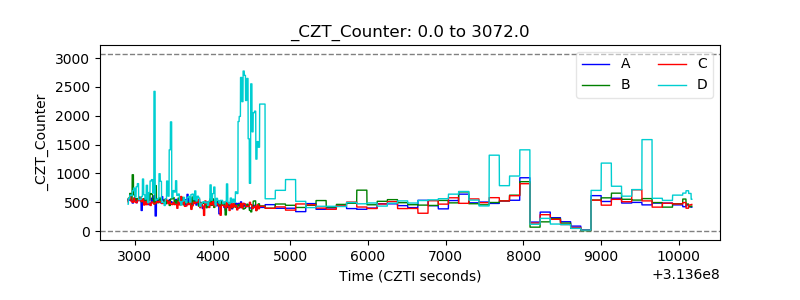 |
| +2.5 Volts monitor |  |
| +5 Volts monitor |  |
| _ROLL_ROT | 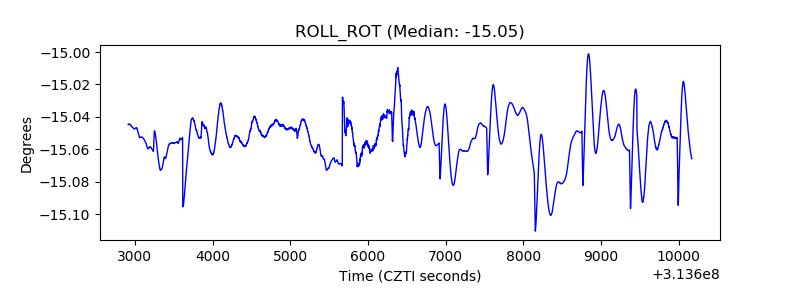 |
| _Roll_DEC | 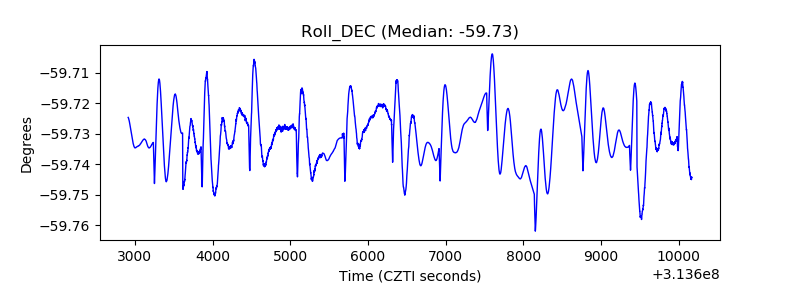 |
| _Roll_RA | 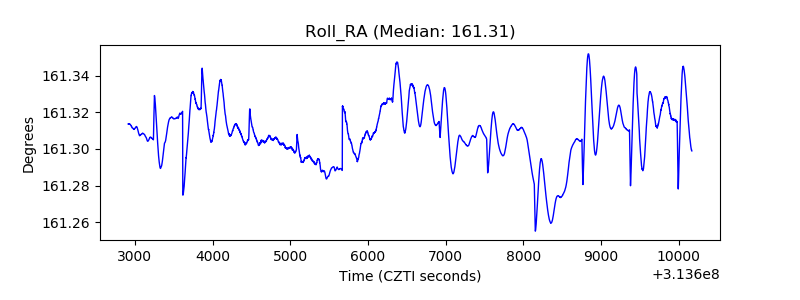 |
| Veto Counter | 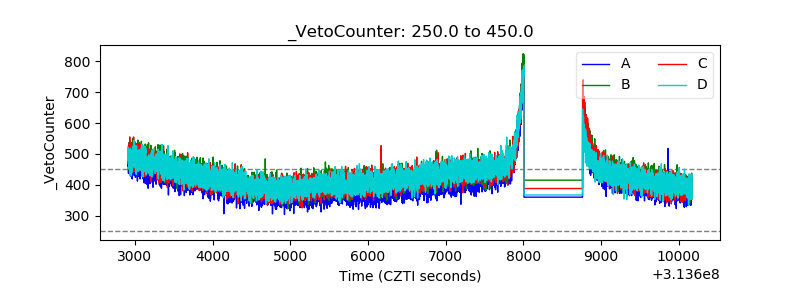 |