| Param | Original file | Final file |
|---|---|---|
| Filename | modeM0/AS1A08_007T01_9000003362_22700cztM0_level2.evt | modeM0/AS1A08_007T01_9000003362_22700cztM0_level2_quad_clean.evt |
| Size (bytes) | 499,570,560 | 92,597,760 |
| Size | 476.4 MB | 88.3 MB |
| Events in quadrant A | 3,221,873 | 597,118 |
| Events in quadrant B | 3,361,897 | 600,135 |
| Events in quadrant C | 3,242,018 | 574,015 |
| Events in quadrant D | 4,840,844 | 557,787 |
| Mode SS | |||
|---|---|---|---|
| Quadrant | BADHDUFLAG | Total packets | Discarded packets |
| A | 0 | 138 | 0 |
| B | 0 | 138 | 0 |
| C | 0 | 138 | 0 |
| D | 0 | 138 | 0 |
| Mode M0 | |||
|---|---|---|---|
| Quadrant | BADHDUFLAG | Total packets | Discarded packets |
| A | 0 | 14021 | 2 |
| B | 0 | 14348 | 1 |
| C | 0 | 14080 | 1 |
| D | 0 | 18855 | 1 |
| Mode M9 | |||
|---|---|---|---|
| Quadrant | BADHDUFLAG | Total packets | Discarded packets |
| A | 0 | 3 | 0 |
| B | 0 | 3 | 0 |
| C | 0 | 3 | 0 |
| D | 0 | 3 | 0 |
| Quadrant | Total seconds | Saturated seconds | Saturation percentage |
|---|---|---|---|
| A | 6819 | 76 | 1.114533% |
| B | 6820 | 102 | 1.495601% |
| C | 6820 | 95 | 1.392962% |
| D | 6820 | 235 | 3.445748% |
Noise dominated data is calculated using 1-second bins in cleaned event files. If a bin has >2000 counts, and if more than 50% of those come from <1% of pixels, then it is considered to be noise-dominated and hence unusable.
| Quadrant | # 1 sec bins | Bins with >0 counts | Bins with >2000 counts | High rate bins dominated by noise | Noise dominated (total time) | Noise dominated (detector-on time) | Marked lightcurve |
|---|---|---|---|---|---|---|---|
| A | 7144 | 6820 | 0 | 0 | 0.00% | 0.00% | 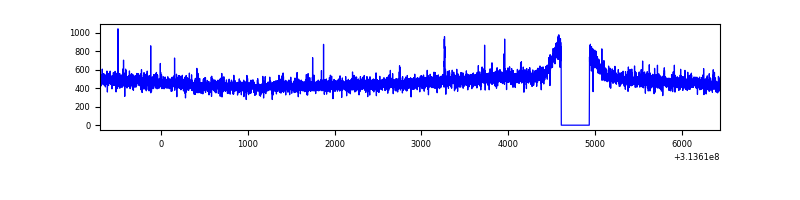 |
| B | 7145 | 6821 | 1 | 1 | 0.01% | 0.01% | 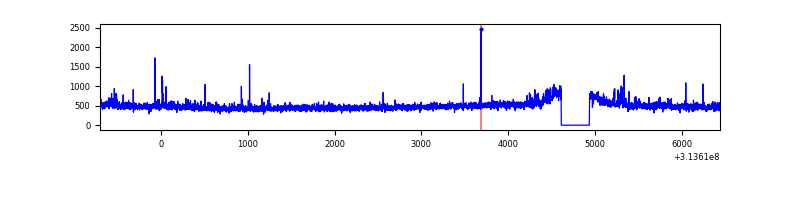 |
| C | 7145 | 6821 | 0 | 0 | 0.00% | 0.00% | 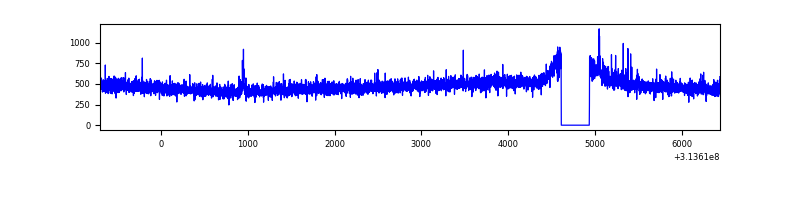 |
| D | 7145 | 6821 | 184 | 184 | 2.58% | 2.70% | 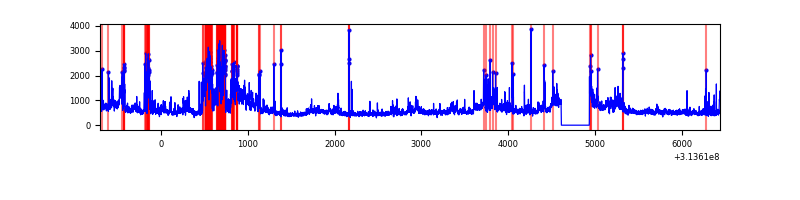 |
Top three noisy pixels from each quadrant. If the there are fewer than three noisy pixels in the level2.evt file, extra rows are filled as -1
| Pixel properties | Quadrant properties | ||||||
|---|---|---|---|---|---|---|---|
| Quadrant | DetID | PixID | Counts | Sigma | Mean | Median | Sigma |
| A | 13 | 254 | 12231 | 67.6 | 833 | 816 | 168.9 |
| A | 0 | 226 | 7257 | 38.14 | 833 | 816 | 168.9 |
| A | 3 | 137 | 6687 | 34.77 | 833 | 816 | 168.9 |
| B | 0 | 190 | 47802 | 298.83 | 827 | 807 | 157.3 |
| B | 0 | 230 | 44003 | 274.67 | 827 | 807 | 157.3 |
| B | 12 | 111 | 17494 | 106.11 | 827 | 807 | 157.3 |
| C | 14 | 238 | 124844 | 672.46 | 792 | 796 | 184.5 |
| C | 10 | 23 | 14795 | 75.89 | 792 | 796 | 184.5 |
| C | 10 | 22 | 7627 | 37.03 | 792 | 796 | 184.5 |
| D | 1 | 52 | 778351 | 4001.08 | 798 | 774 | 194.3 |
| D | 12 | 33 | 410823 | 2109.94 | 798 | 774 | 194.3 |
| D | 12 | 235 | 299553 | 1537.39 | 798 | 774 | 194.3 |
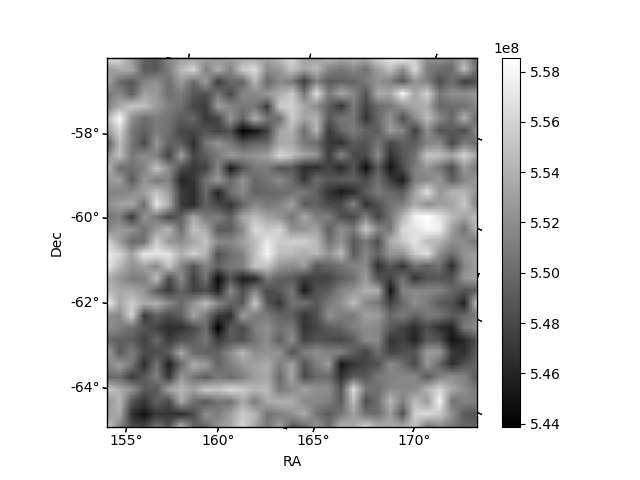
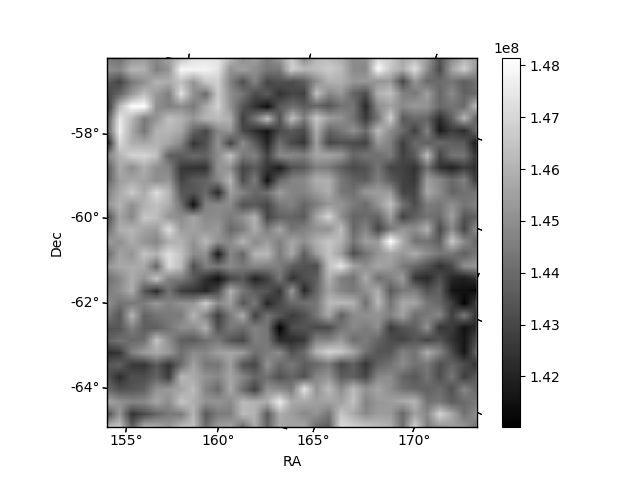
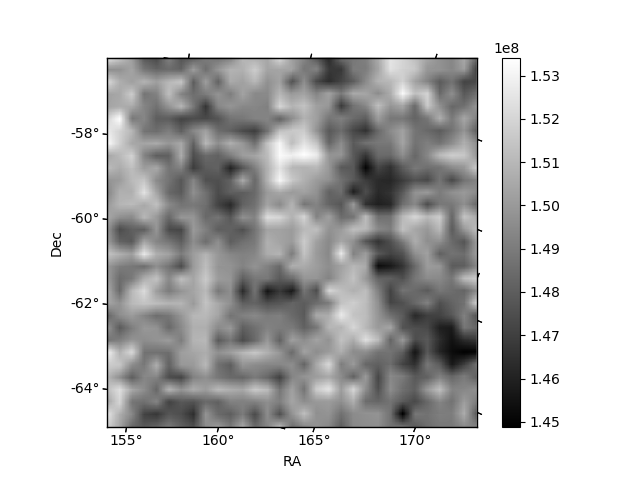
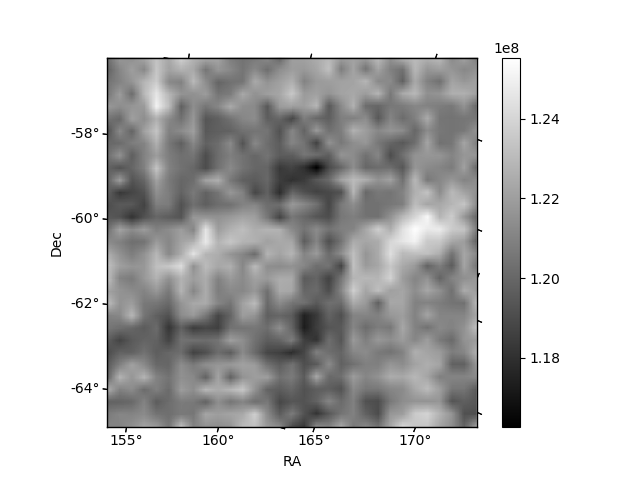
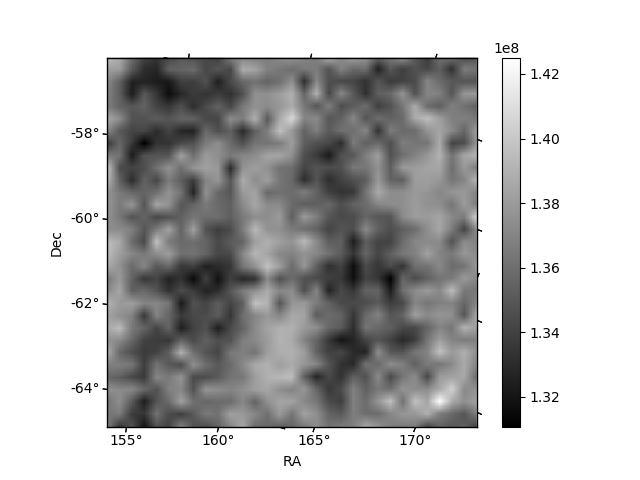
Histogram calculated using DETX and DETY for each event in the final _common_clean file
| Quadrant A | 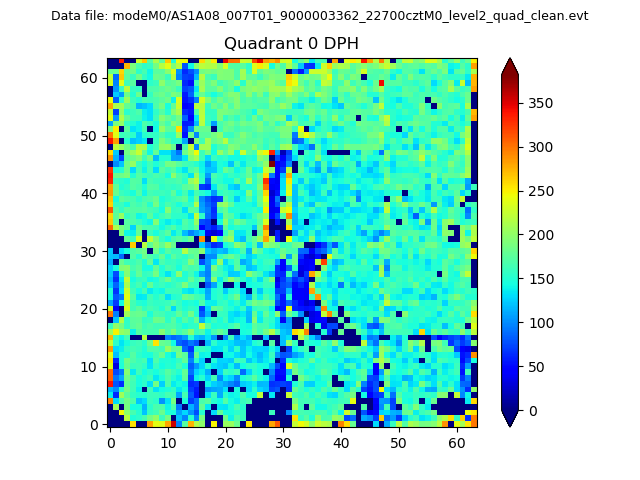 |
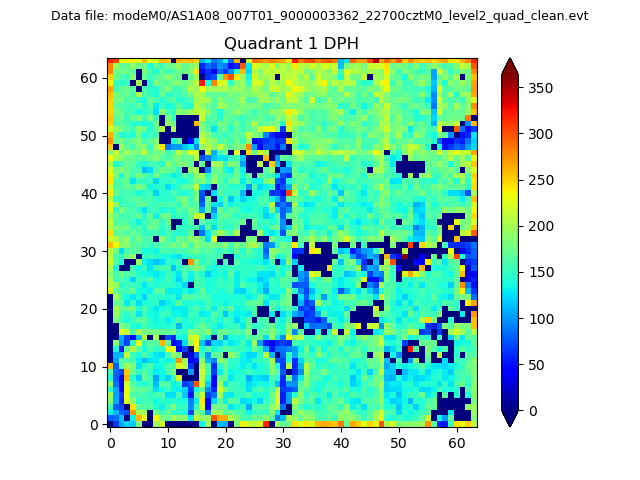 |
Quadrant B |
|---|---|---|---|
| Quadrant D | 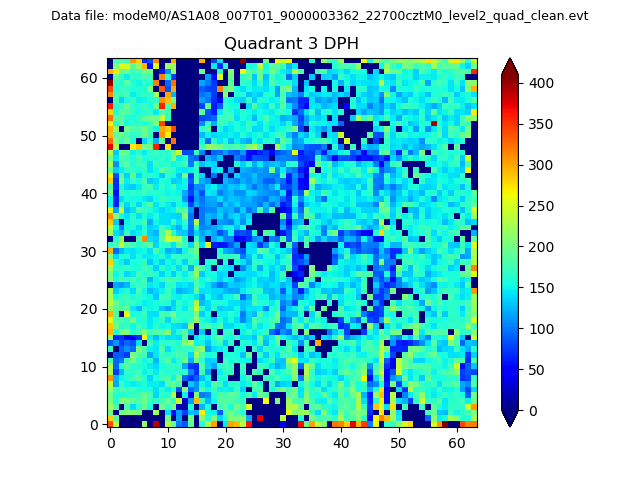 |
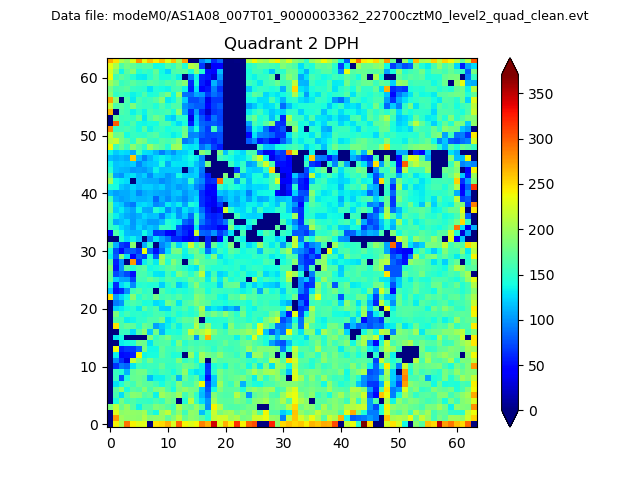 |
Quadrant C |
| Plot type | Count rate plots | Images |
|---|---|---|
| Comparison with Poisson distribution Blue bars denote a histogram of data divided into 1 sec bins. Red curve is a Poisson curve with rate = median count rate of data. |
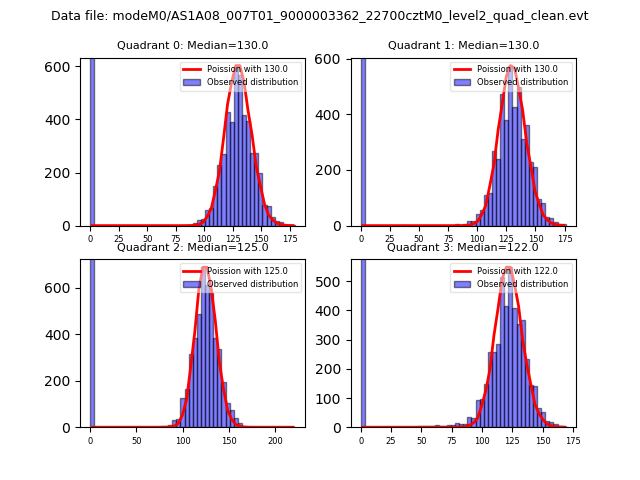 |
 |
| Quadrant-wise count rates Data is divided into 100 sec bins |
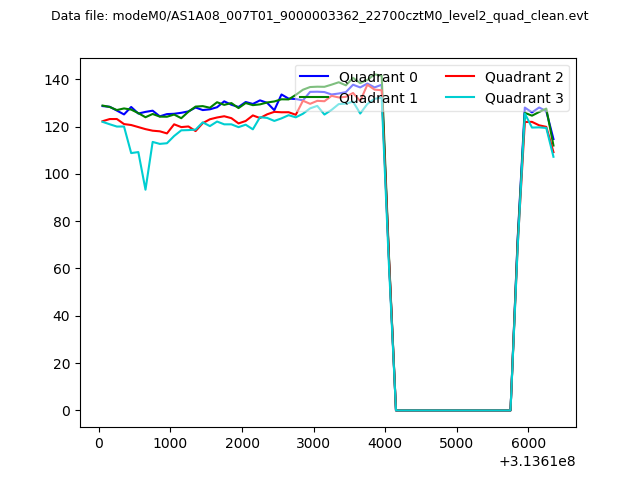 |
|
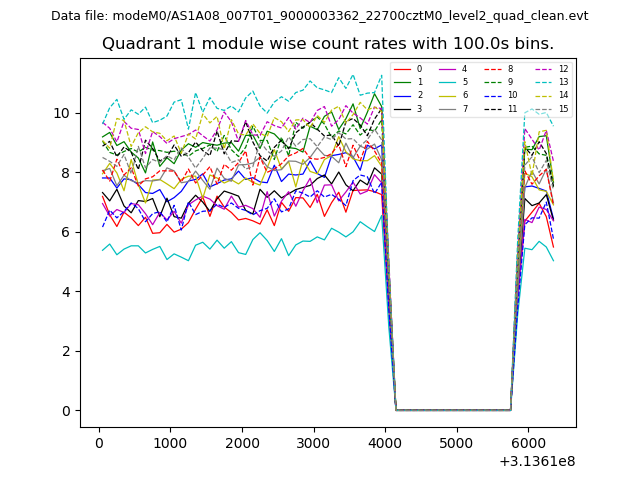
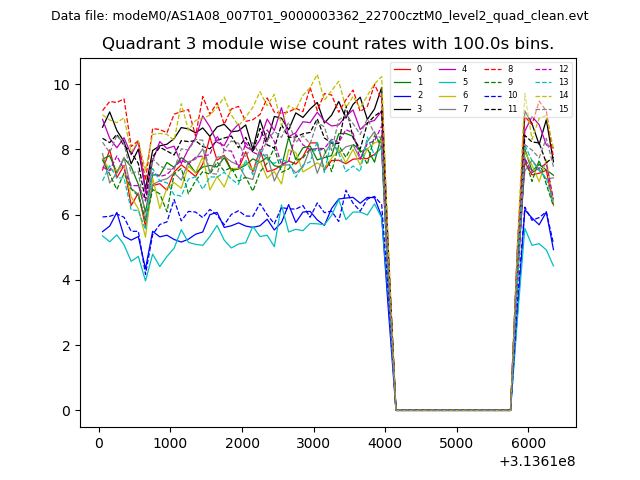
| Module-wise count rates for Quadrant A Data is divided into 100 sec bins |
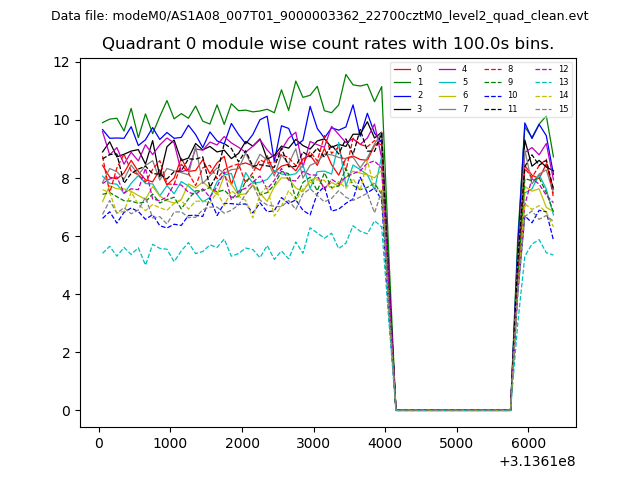 |
 |
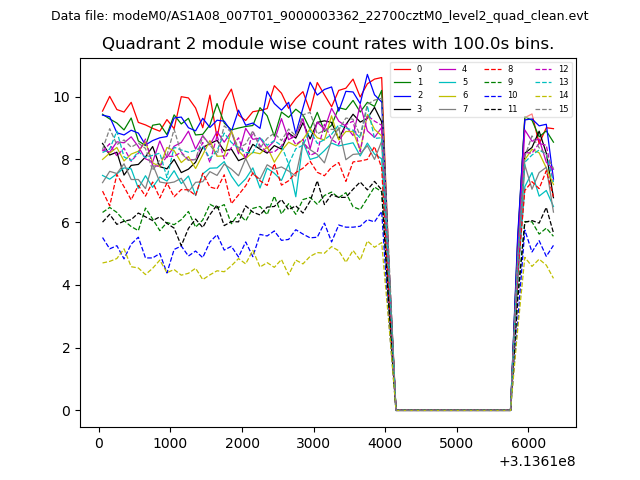
| Module-wise count rates for Quadrant B Data is divided into 100 sec bins |
 |
 |
| Module-wise count rates for Quadrant C Data is divided into 100 sec bins |
 |
 |
| Module-wise count rates for Quadrant D Data is divided into 100 sec bins |
 |
 |
| Parameter | Plot |
|---|---|
| CZT HV Monitor | 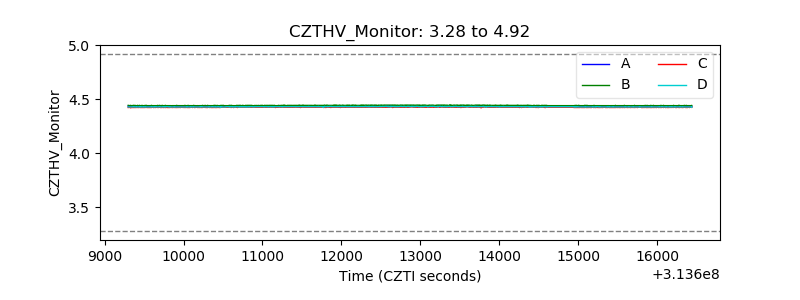 |
| D_VDD | 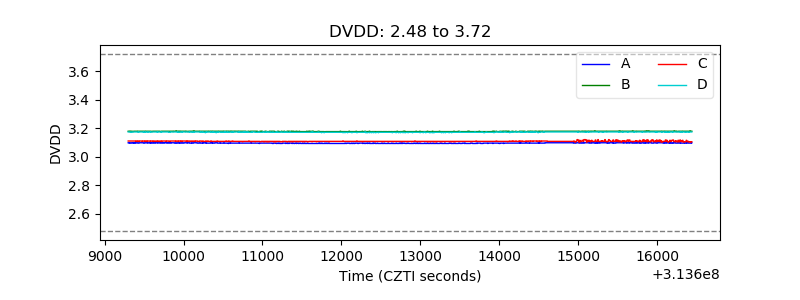 |
| Temperature 1 | 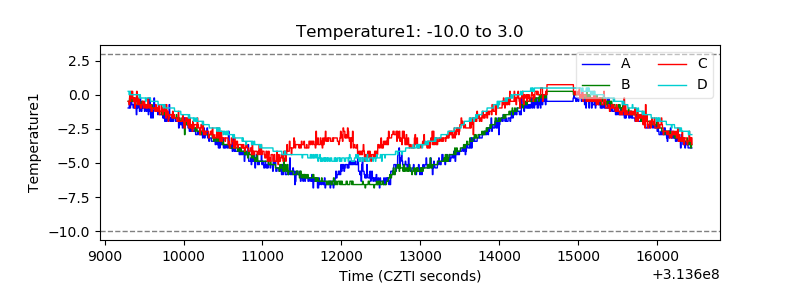 |
| Veto HV Monitor | 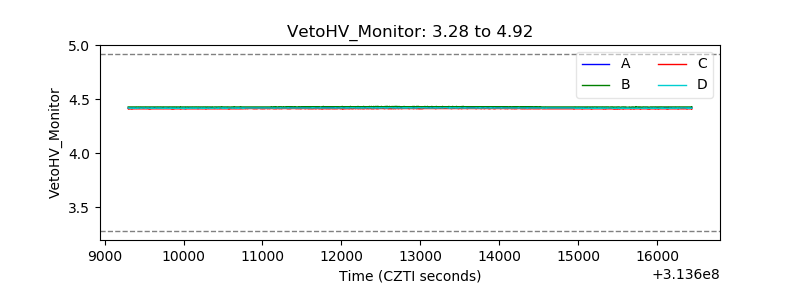 |
| Veto LLD | 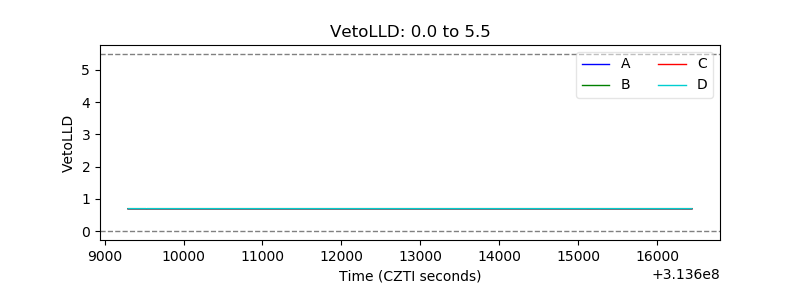 |
| Alpha Counter | 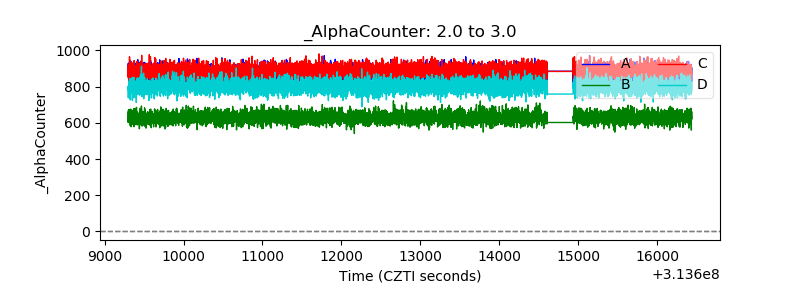 |
| _CPM_Rate | 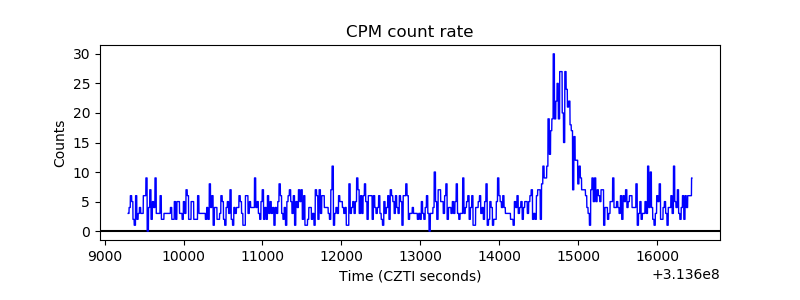 |
| CZT Counter | 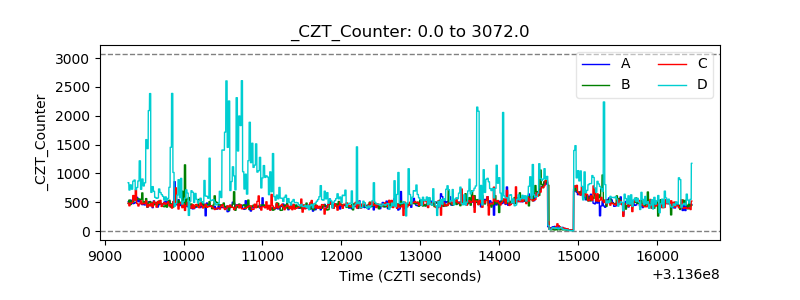 |
| +2.5 Volts monitor |  |
| +5 Volts monitor |  |
| _ROLL_ROT | 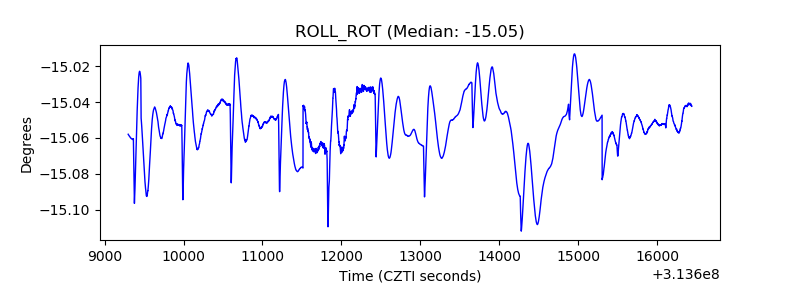 |
| _Roll_DEC | 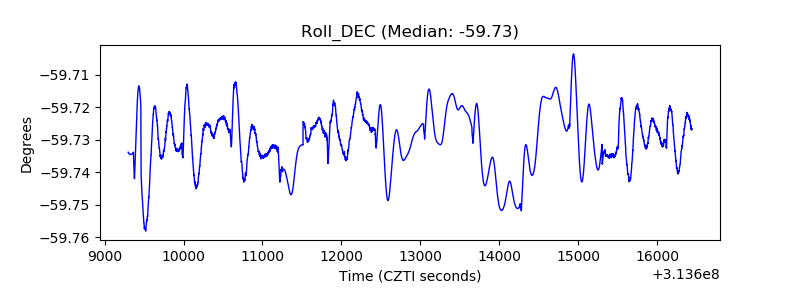 |
| _Roll_RA | 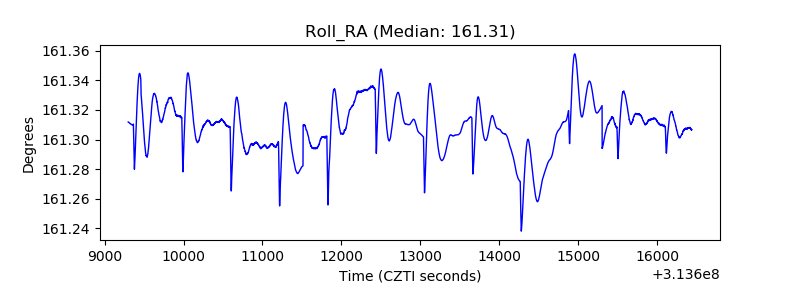 |
| Veto Counter | 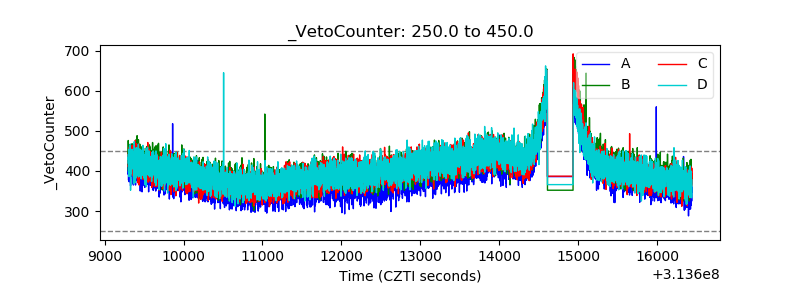 |