| Param | Original file | Final file |
|---|---|---|
| Filename | modeM0/AS1A08_007T01_9000003362_22701cztM0_level2.evt | modeM0/AS1A08_007T01_9000003362_22701cztM0_level2_quad_clean.evt |
| Size (bytes) | 501,275,520 | 99,103,680 |
| Size | 478.1 MB | 94.5 MB |
| Events in quadrant A | 3,368,487 | 639,395 |
| Events in quadrant B | 3,511,513 | 641,921 |
| Events in quadrant C | 3,423,465 | 611,189 |
| Events in quadrant D | 4,387,519 | 606,244 |
| Mode SS | |||
|---|---|---|---|
| Quadrant | BADHDUFLAG | Total packets | Discarded packets |
| A | 0 | 146 | 0 |
| B | 0 | 146 | 0 |
| C | 0 | 146 | 0 |
| D | 0 | 146 | 0 |
| Mode M0 | |||
|---|---|---|---|
| Quadrant | BADHDUFLAG | Total packets | Discarded packets |
| A | 0 | 14809 | 1 |
| B | 0 | 15048 | 1 |
| C | 0 | 14859 | 1 |
| D | 0 | 17800 | 1 |
| Mode M9 | |||
|---|---|---|---|
| Quadrant | BADHDUFLAG | Total packets | Discarded packets |
| A | 0 | 2 | 0 |
| B | 0 | 2 | 0 |
| C | 0 | 2 | 0 |
| D | 0 | 2 | 0 |
| Quadrant | Total seconds | Saturated seconds | Saturation percentage |
|---|---|---|---|
| A | 7218 | 53 | 0.734275% |
| B | 7218 | 85 | 1.177612% |
| C | 7219 | 89 | 1.232858% |
| D | 7218 | 135 | 1.870324% |
Noise dominated data is calculated using 1-second bins in cleaned event files. If a bin has >2000 counts, and if more than 50% of those come from <1% of pixels, then it is considered to be noise-dominated and hence unusable.
| Quadrant | # 1 sec bins | Bins with >0 counts | Bins with >2000 counts | High rate bins dominated by noise | Noise dominated (total time) | Noise dominated (detector-on time) | Marked lightcurve |
|---|---|---|---|---|---|---|---|
| A | 7413 | 7220 | 0 | 0 | 0.00% | 0.00% | 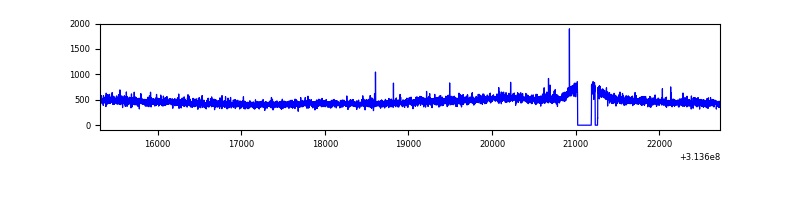 |
| B | 7413 | 7220 | 1 | 1 | 0.01% | 0.01% | 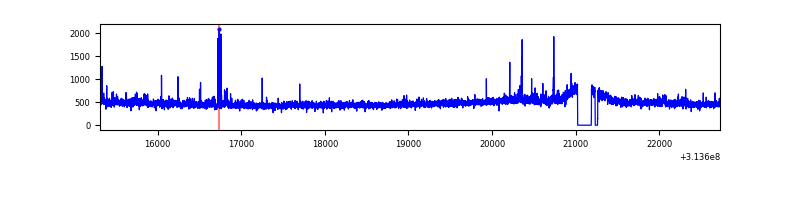 |
| C | 7414 | 7221 | 12 | 12 | 0.16% | 0.17% |  |
| D | 7413 | 7220 | 79 | 79 | 1.07% | 1.09% | 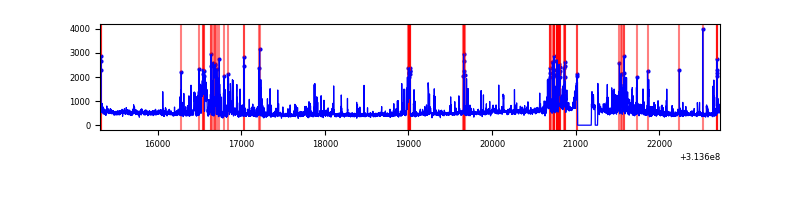 |
Top three noisy pixels from each quadrant. If the there are fewer than three noisy pixels in the level2.evt file, extra rows are filled as -1
| Pixel properties | Quadrant properties | ||||||
|---|---|---|---|---|---|---|---|
| Quadrant | DetID | PixID | Counts | Sigma | Mean | Median | Sigma |
| A | 13 | 254 | 12724 | 66.59 | 870 | 851 | 178.3 |
| A | 0 | 226 | 7700 | 38.42 | 870 | 851 | 178.3 |
| A | 3 | 137 | 7008 | 34.53 | 870 | 851 | 178.3 |
| B | 0 | 230 | 38395 | 230.28 | 866 | 844 | 163.1 |
| B | 0 | 190 | 32577 | 194.6 | 866 | 844 | 163.1 |
| B | 0 | 245 | 26683 | 158.46 | 866 | 844 | 163.1 |
| C | 14 | 238 | 130366 | 669.36 | 827 | 833 | 193.5 |
| C | 10 | 22 | 30139 | 151.44 | 827 | 833 | 193.5 |
| C | 10 | 23 | 29520 | 148.24 | 827 | 833 | 193.5 |
| D | 1 | 52 | 549448 | 2658.86 | 839 | 815 | 206.3 |
| D | 12 | 233 | 382381 | 1849.2 | 839 | 815 | 206.3 |
| D | 12 | 33 | 108898 | 523.81 | 839 | 815 | 206.3 |
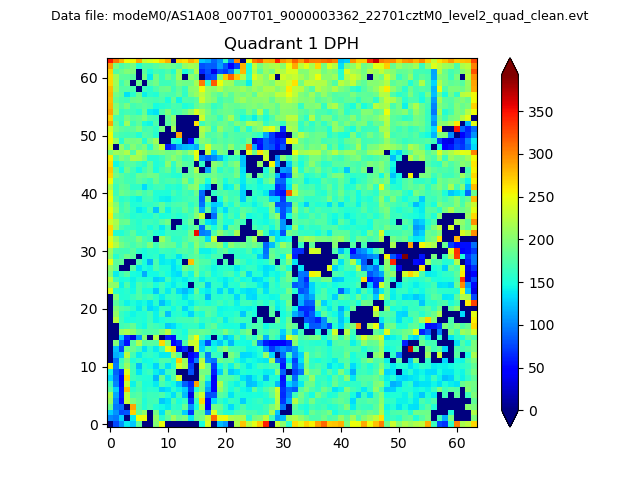
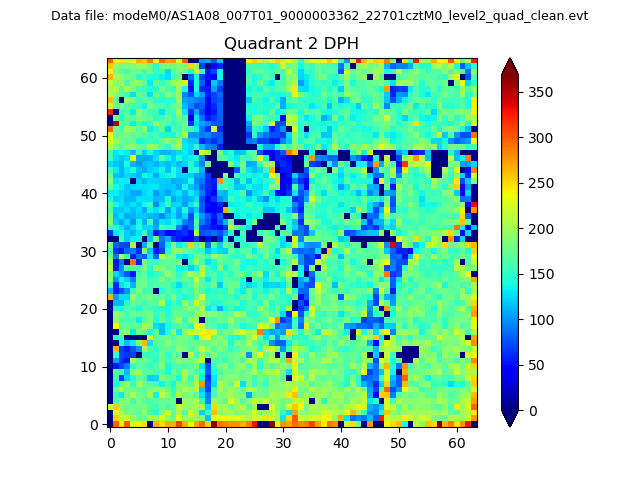
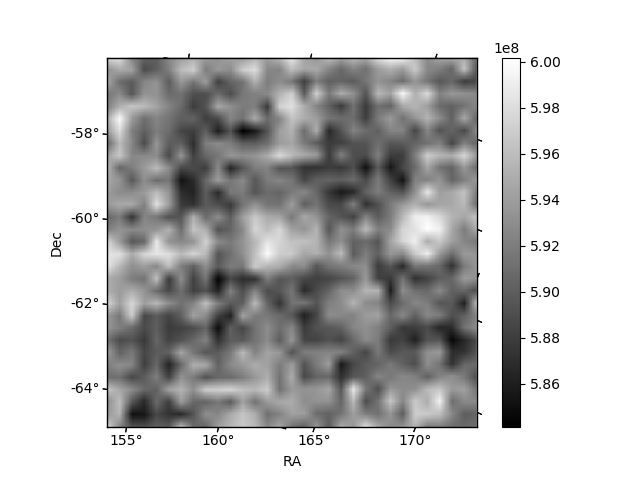
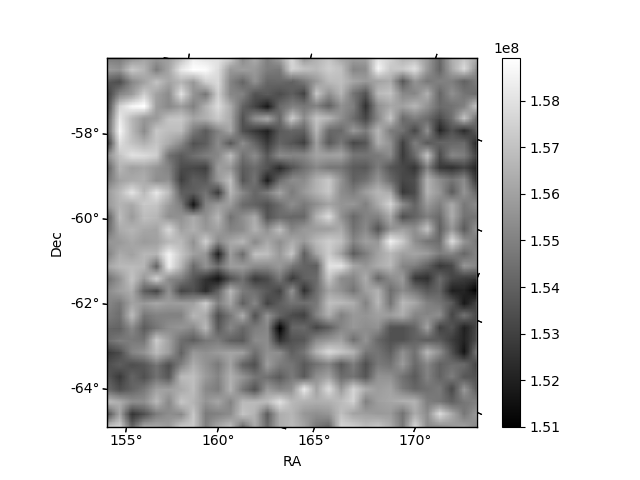
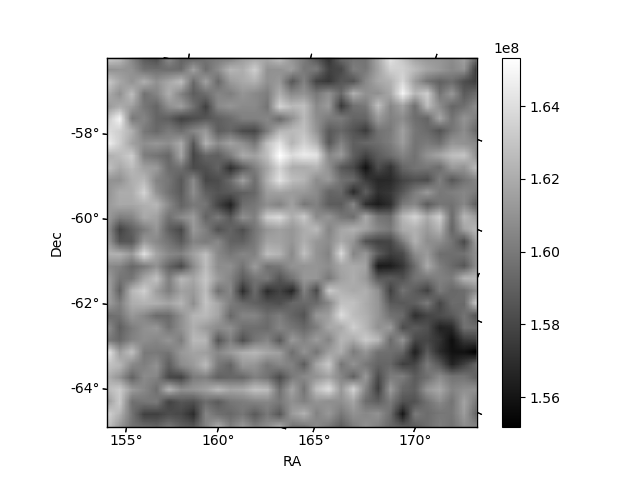
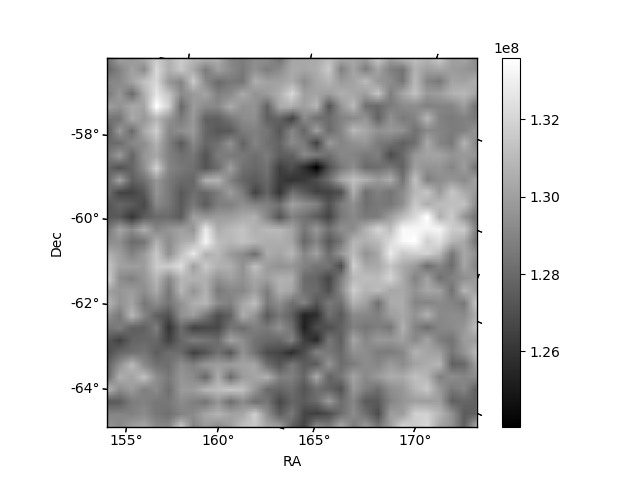
Histogram calculated using DETX and DETY for each event in the final _common_clean file
| Quadrant A | 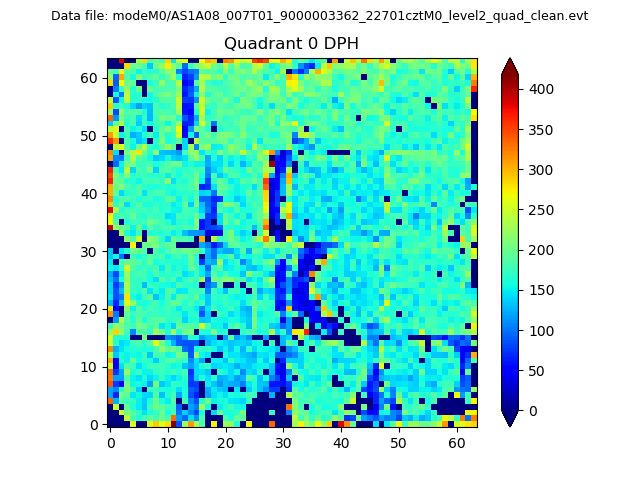 |
 |
Quadrant B |
|---|---|---|---|
| Quadrant D | 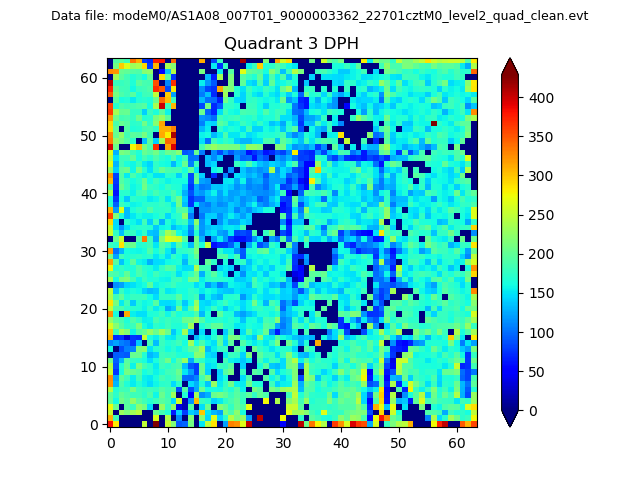 |
 |
Quadrant C |
| Plot type | Count rate plots | Images |
|---|---|---|
| Comparison with Poisson distribution Blue bars denote a histogram of data divided into 1 sec bins. Red curve is a Poisson curve with rate = median count rate of data. |
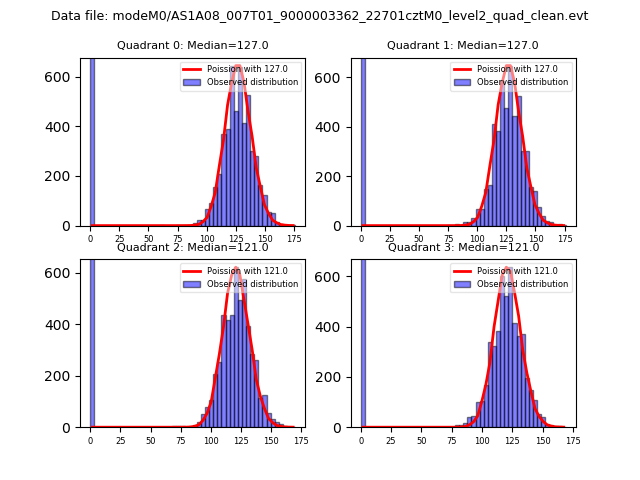 |
 |
| Quadrant-wise count rates Data is divided into 100 sec bins |
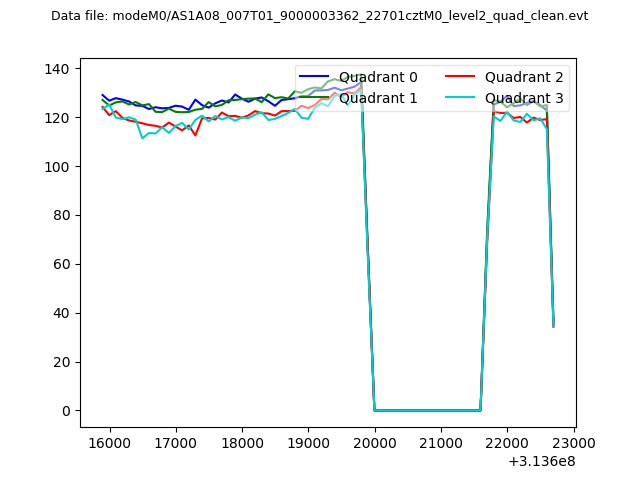 |
|
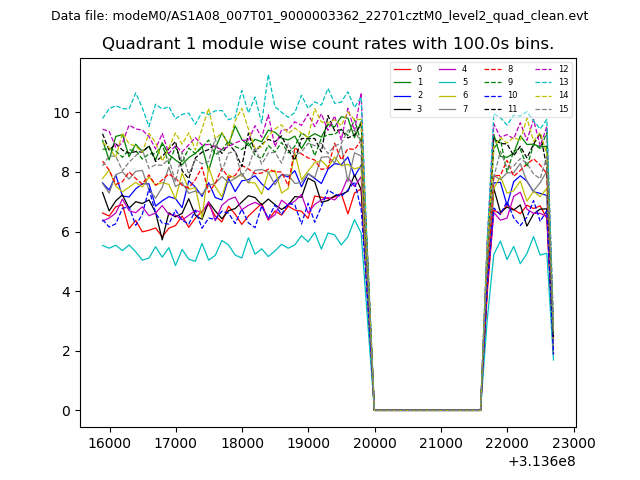
| Module-wise count rates for Quadrant A Data is divided into 100 sec bins |
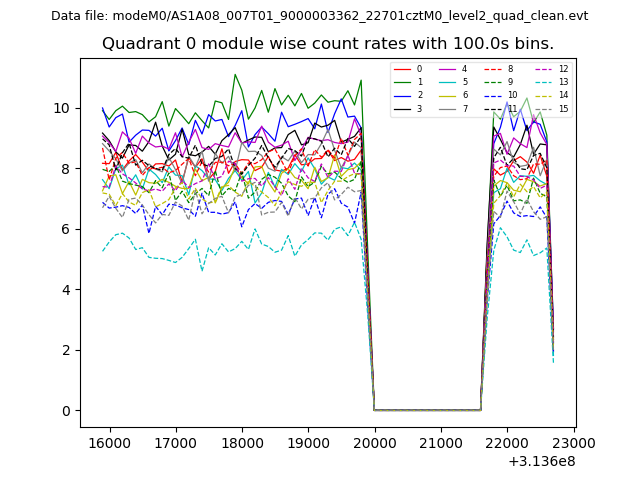 |
 |
| Module-wise count rates for Quadrant B Data is divided into 100 sec bins |
 |
 |
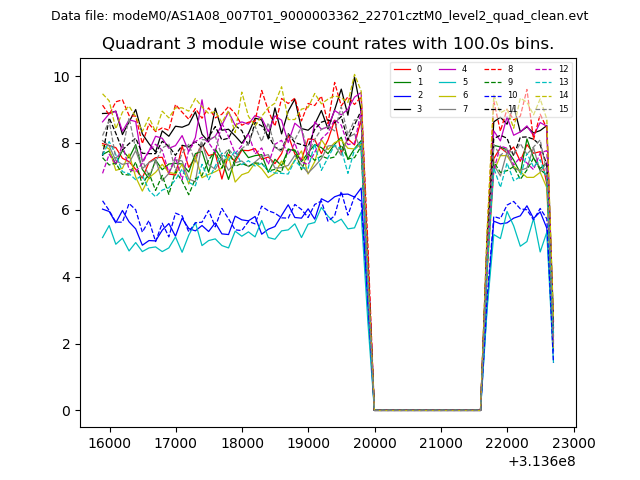
| Module-wise count rates for Quadrant C Data is divided into 100 sec bins |
 |
 |
| Module-wise count rates for Quadrant D Data is divided into 100 sec bins |
 |
 |
| Parameter | Plot |
|---|---|
| CZT HV Monitor |  |
| D_VDD | 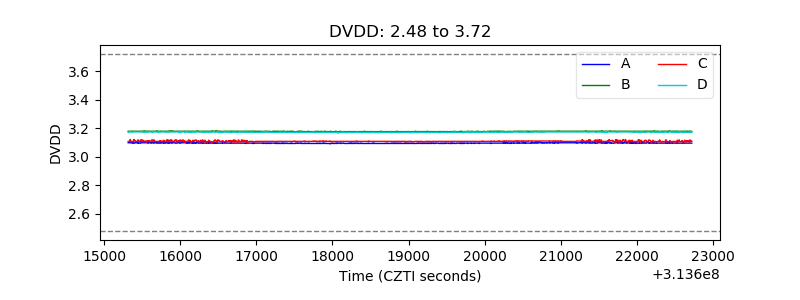 |
| Temperature 1 | 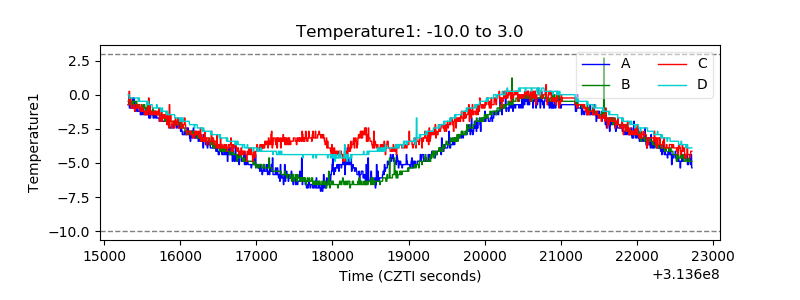 |
| Veto HV Monitor | 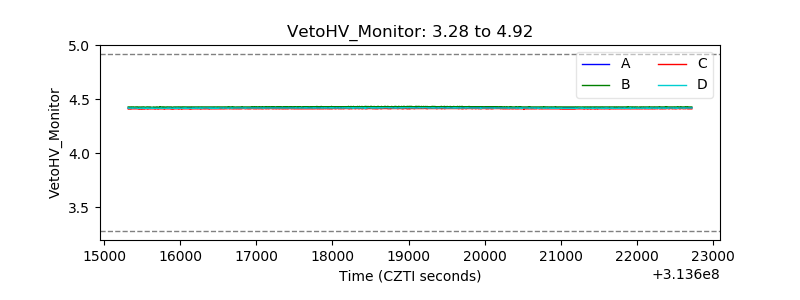 |
| Veto LLD | 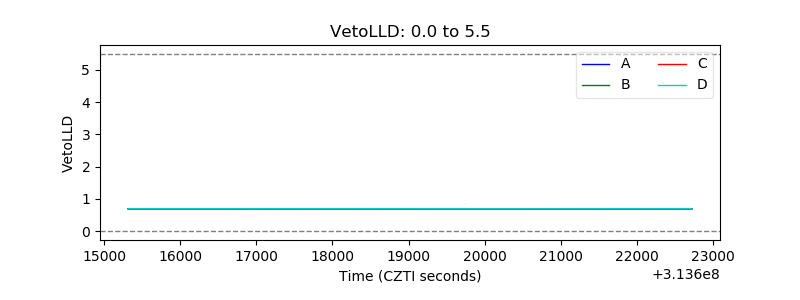 |
| Alpha Counter | 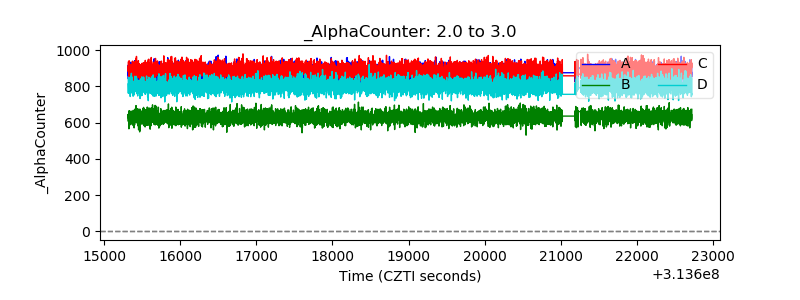 |
| _CPM_Rate | 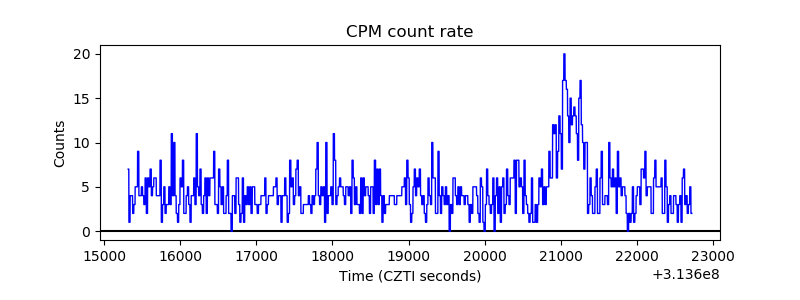 |
| CZT Counter |  |
| +2.5 Volts monitor |  |
| +5 Volts monitor | 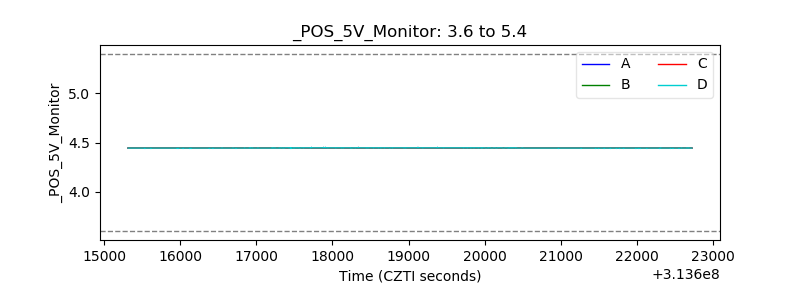 |
| _ROLL_ROT | 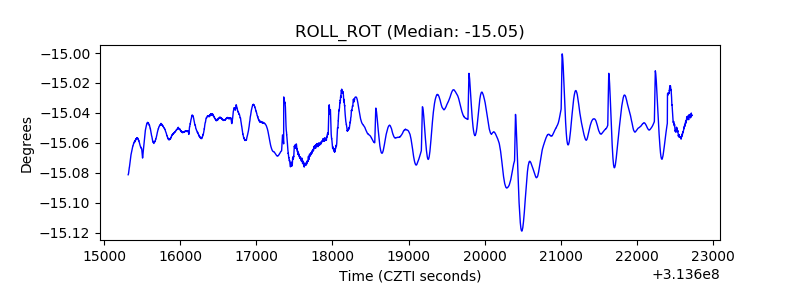 |
| _Roll_DEC | 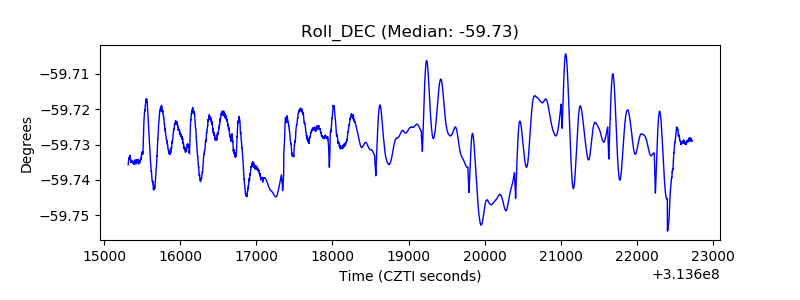 |
| _Roll_RA | 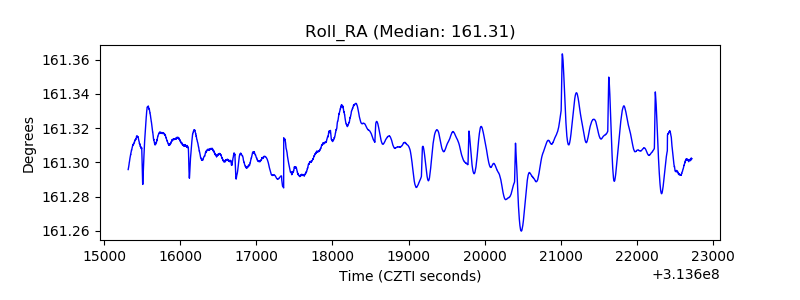 |
| Veto Counter | 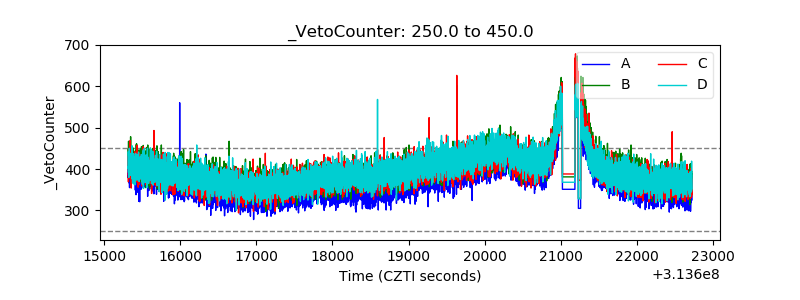 |