| Param | Original file | Final file |
|---|---|---|
| Filename | modeM0/AS1A08_007T01_9000003362_22709cztM0_level2.evt | modeM0/AS1A08_007T01_9000003362_22709cztM0_level2_quad_clean.evt |
| Size (bytes) | 449,867,520 | 100,373,760 |
| Size | 429.0 MB | 95.7 MB |
| Events in quadrant A | 3,091,146 | 671,807 |
| Events in quadrant B | 3,183,274 | 678,862 |
| Events in quadrant C | 3,184,023 | 647,179 |
| Events in quadrant D | 3,766,175 | 630,879 |
| Mode SS | |||
|---|---|---|---|
| Quadrant | BADHDUFLAG | Total packets | Discarded packets |
| A | 0 | 120 | 0 |
| B | 0 | 120 | 0 |
| C | 0 | 120 | 0 |
| D | 0 | 120 | 0 |
| Mode M0 | |||
|---|---|---|---|
| Quadrant | BADHDUFLAG | Total packets | Discarded packets |
| A | 0 | 12749 | 1 |
| B | 0 | 12955 | 1 |
| C | 0 | 13159 | 1 |
| D | 0 | 15064 | 1 |
| Mode M9 | |||
|---|---|---|---|
| Quadrant | BADHDUFLAG | Total packets | Discarded packets |
| A | 0 | 13 | 0 |
| B | 0 | 13 | 0 |
| C | 0 | 13 | 0 |
| D | 0 | 13 | 0 |
| Quadrant | Total seconds | Saturated seconds | Saturation percentage |
|---|---|---|---|
| A | 5884 | 42 | 0.713800% |
| B | 5884 | 46 | 0.781781% |
| C | 5884 | 83 | 1.410605% |
| D | 5885 | 118 | 2.005098% |
Noise dominated data is calculated using 1-second bins in cleaned event files. If a bin has >2000 counts, and if more than 50% of those come from <1% of pixels, then it is considered to be noise-dominated and hence unusable.
| Quadrant | # 1 sec bins | Bins with >0 counts | Bins with >2000 counts | High rate bins dominated by noise | Noise dominated (total time) | Noise dominated (detector-on time) | Marked lightcurve |
|---|---|---|---|---|---|---|---|
| A | 7164 | 5885 | 0 | 0 | 0.00% | 0.00% | 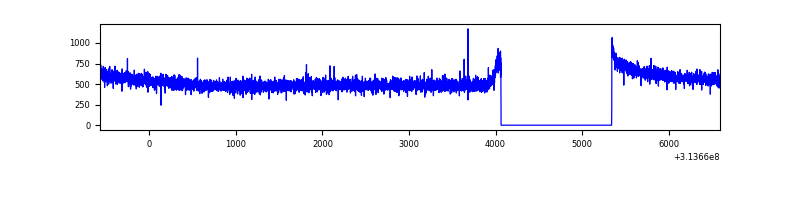 |
| B | 7164 | 5885 | 10 | 10 | 0.14% | 0.17% | 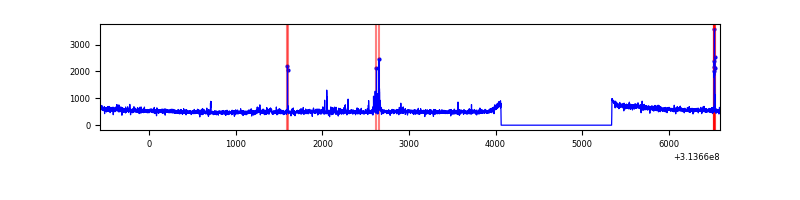 |
| C | 7164 | 5885 | 0 | 0 | 0.00% | 0.00% | 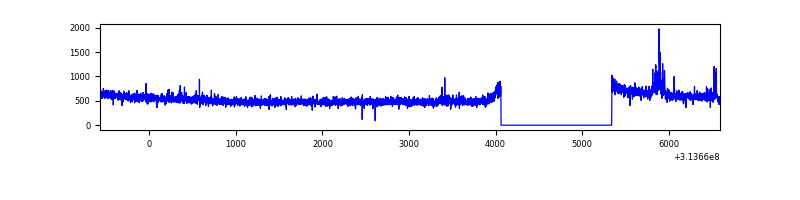 |
| D | 7165 | 5886 | 66 | 66 | 0.92% | 1.12% | 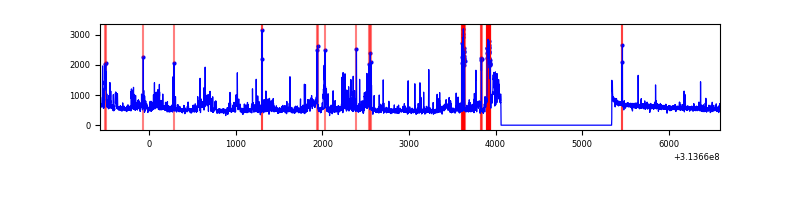 |
Top three noisy pixels from each quadrant. If the there are fewer than three noisy pixels in the level2.evt file, extra rows are filled as -1
| Pixel properties | Quadrant properties | ||||||
|---|---|---|---|---|---|---|---|
| Quadrant | DetID | PixID | Counts | Sigma | Mean | Median | Sigma |
| A | 13 | 254 | 10500 | 61.62 | 801 | 787 | 157.6 |
| A | 0 | 226 | 6934 | 39.0 | 801 | 787 | 157.6 |
| A | 12 | 194 | 5977 | 32.93 | 801 | 787 | 157.6 |
| B | 0 | 228 | 33700 | 227.46 | 785 | 769 | 144.8 |
| B | 4 | 216 | 26016 | 174.38 | 785 | 769 | 144.8 |
| B | 12 | 111 | 15933 | 104.74 | 785 | 769 | 144.8 |
| C | 14 | 238 | 123359 | 696.3 | 768 | 775 | 176.0 |
| C | 10 | 22 | 63947 | 358.83 | 768 | 775 | 176.0 |
| C | 13 | 61 | 5300 | 25.7 | 768 | 775 | 176.0 |
| D | 1 | 52 | 382888 | 2026.23 | 784 | 763 | 188.6 |
| D | 7 | 238 | 225069 | 1189.39 | 784 | 763 | 188.6 |
| D | 12 | 233 | 91315 | 480.15 | 784 | 763 | 188.6 |
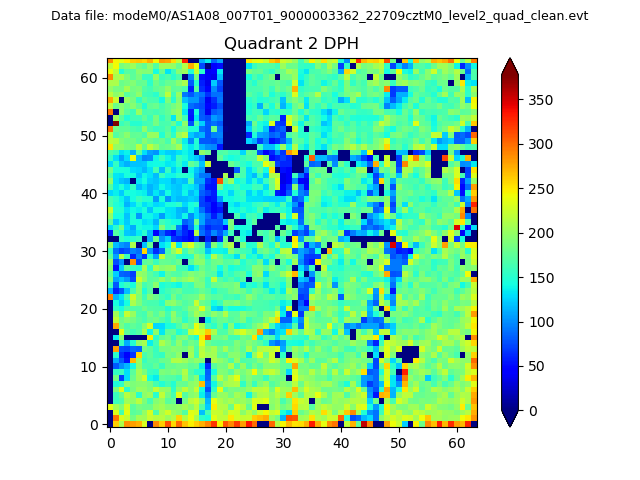
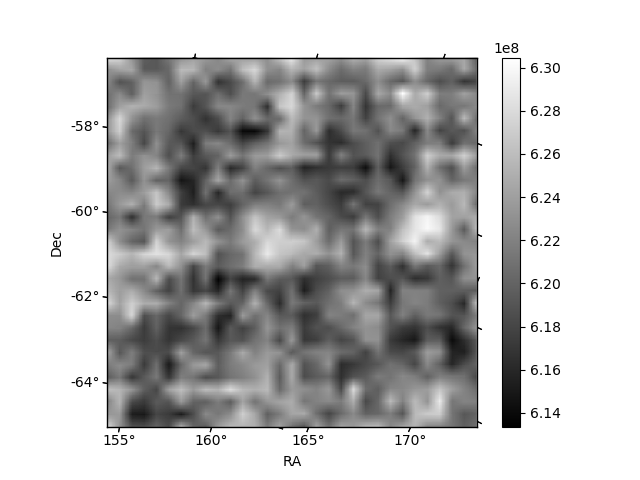
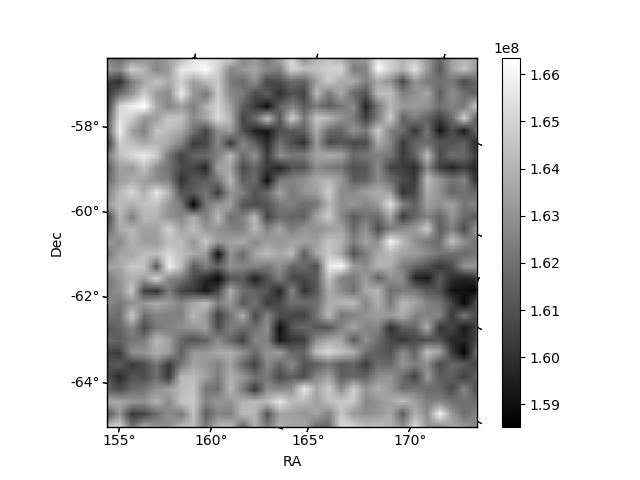
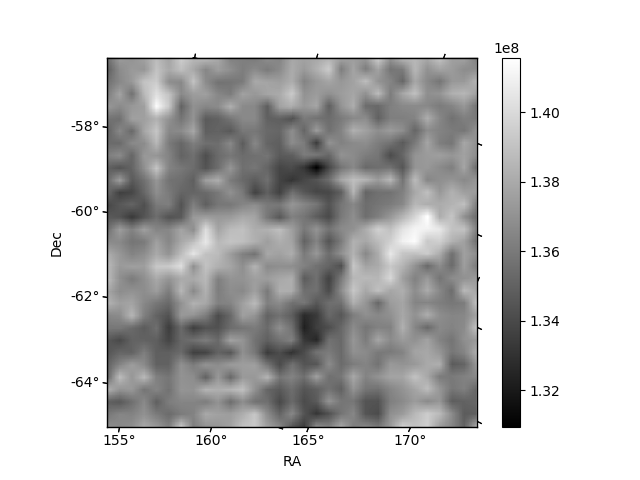
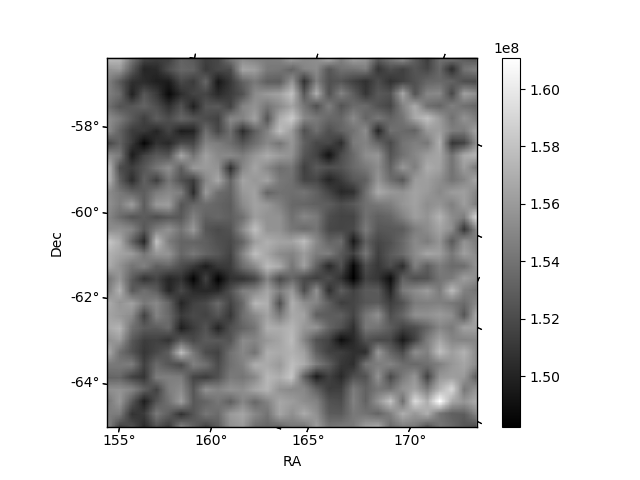
Histogram calculated using DETX and DETY for each event in the final _common_clean file
| Quadrant A | 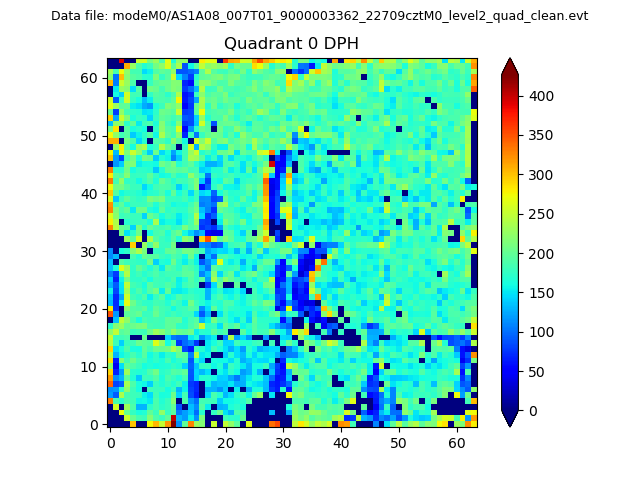 |
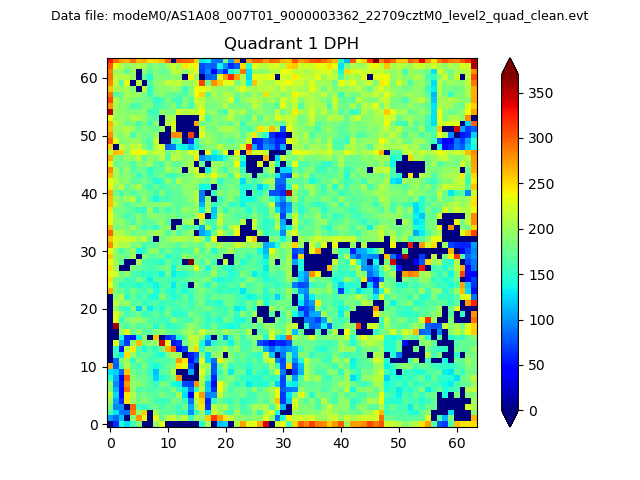 |
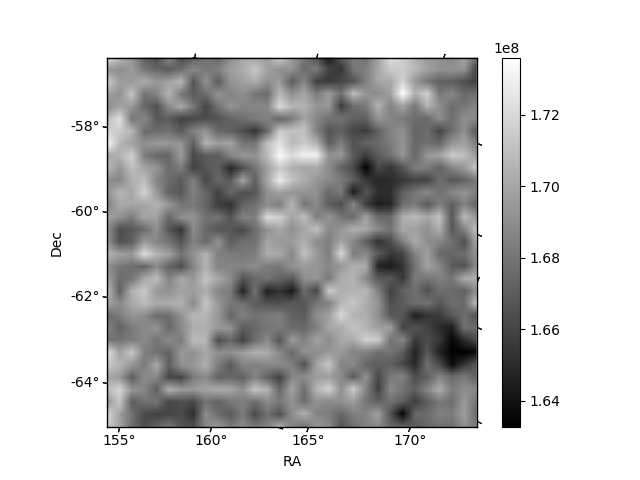
Quadrant B |
|---|---|---|---|
| Quadrant D | 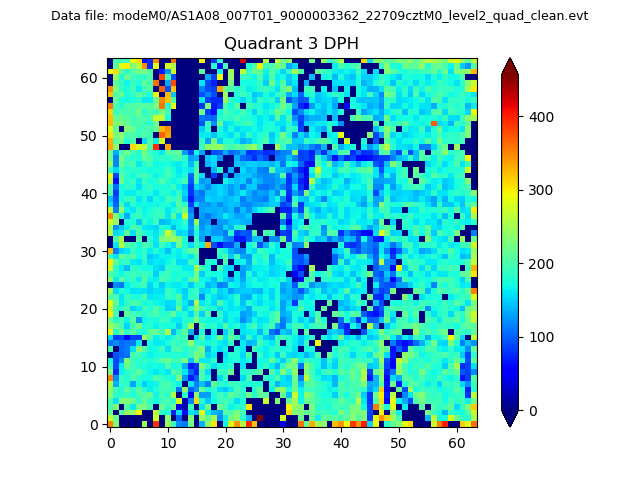 |
 |
Quadrant C |
| Plot type | Count rate plots | Images |
|---|---|---|
| Comparison with Poisson distribution Blue bars denote a histogram of data divided into 1 sec bins. Red curve is a Poisson curve with rate = median count rate of data. |
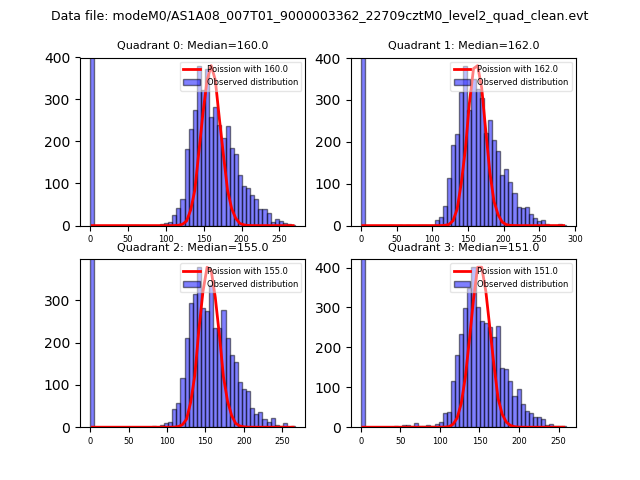 |
 |
| Quadrant-wise count rates Data is divided into 100 sec bins |
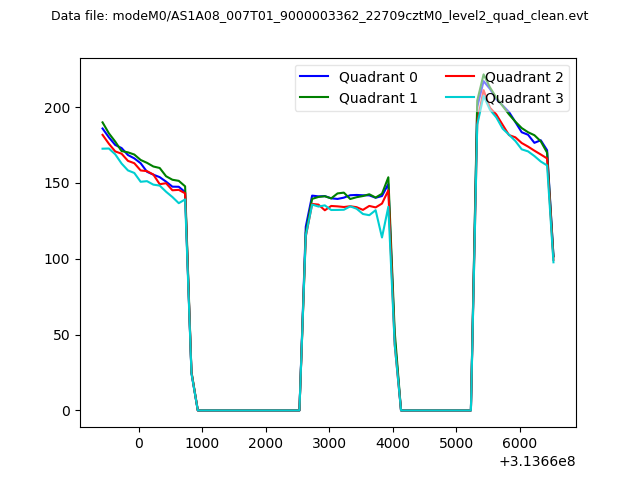 |
|
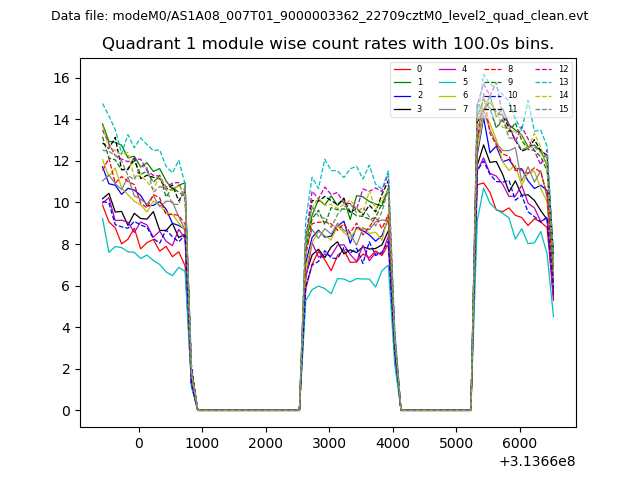
| Module-wise count rates for Quadrant A Data is divided into 100 sec bins |
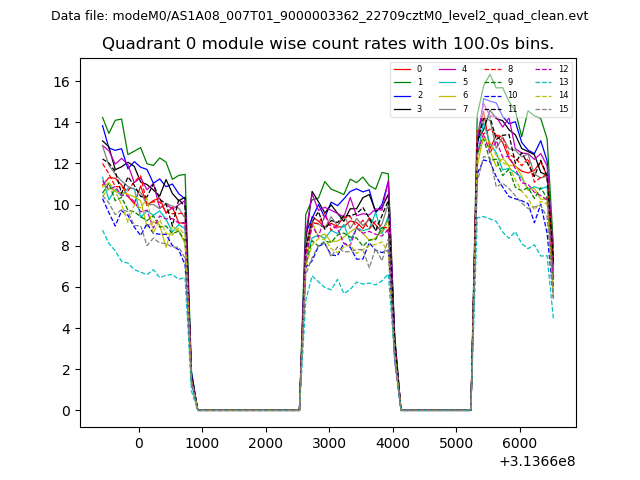 |
 |
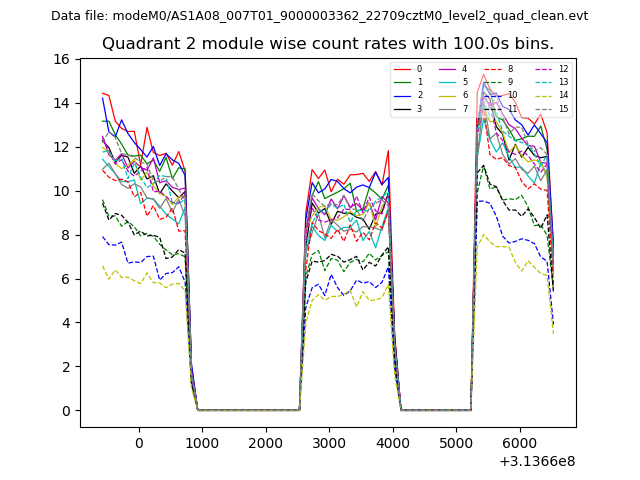
| Module-wise count rates for Quadrant B Data is divided into 100 sec bins |
 |
 |
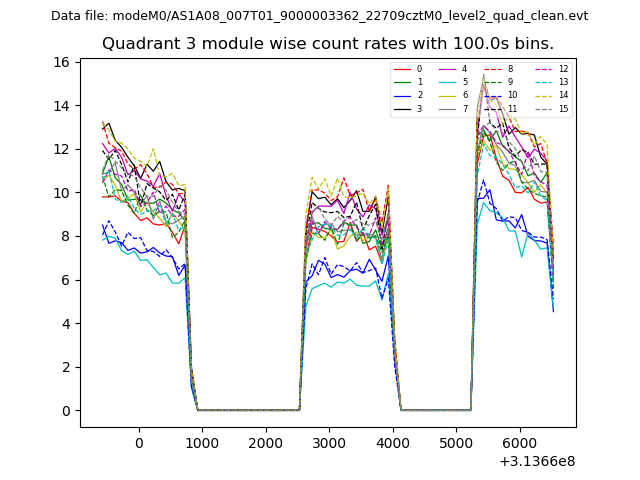
| Module-wise count rates for Quadrant C Data is divided into 100 sec bins |
 |
 |
| Module-wise count rates for Quadrant D Data is divided into 100 sec bins |
 |
 |
| Parameter | Plot |
|---|---|
| CZT HV Monitor | 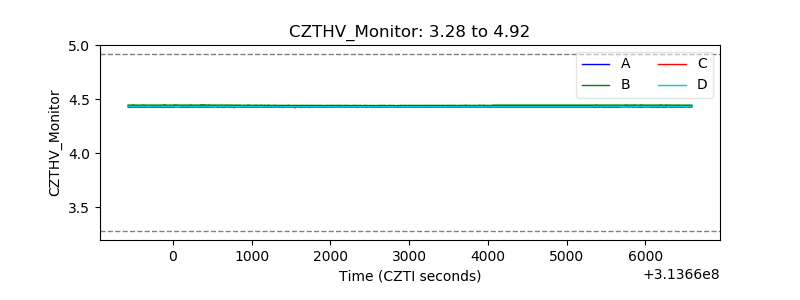 |
| D_VDD | 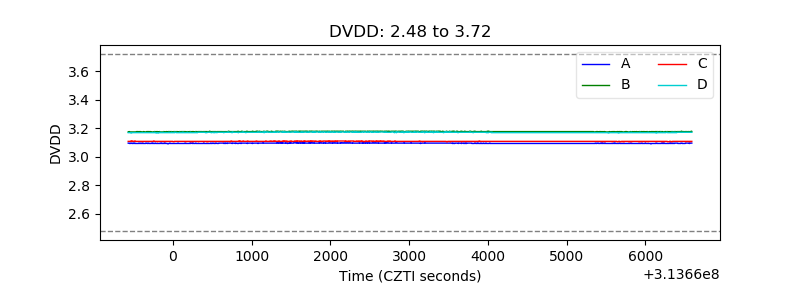 |
| Temperature 1 | 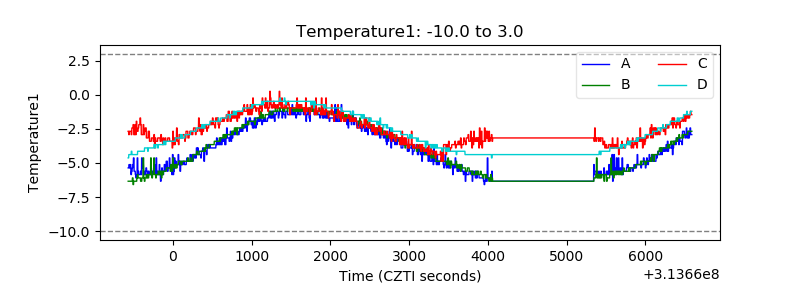 |
| Veto HV Monitor | 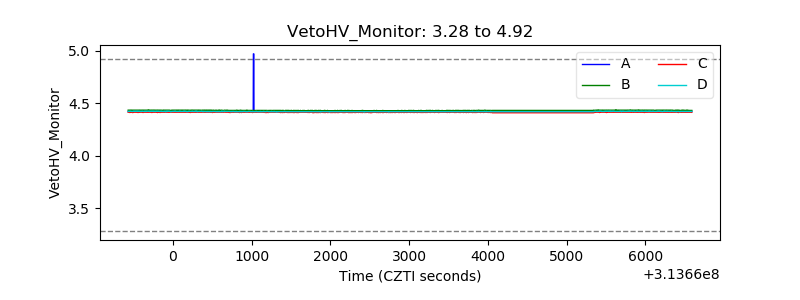 |
| Veto LLD | 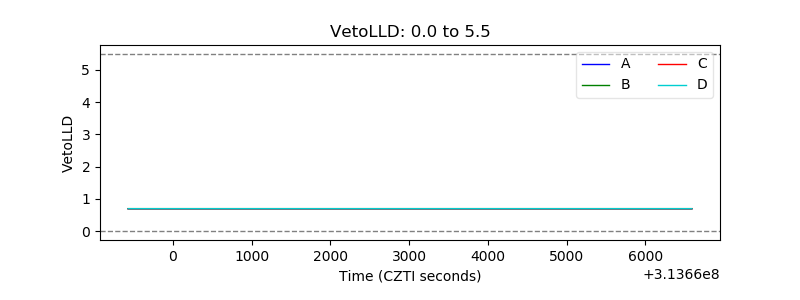 |
| Alpha Counter | 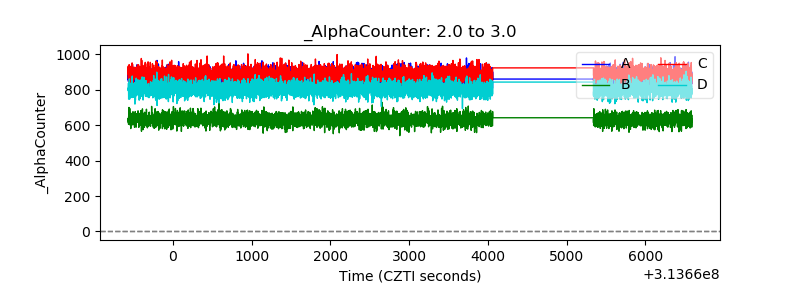 |
| _CPM_Rate | 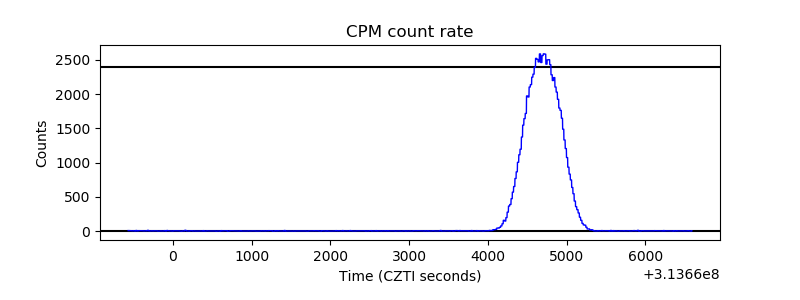 |
| CZT Counter | 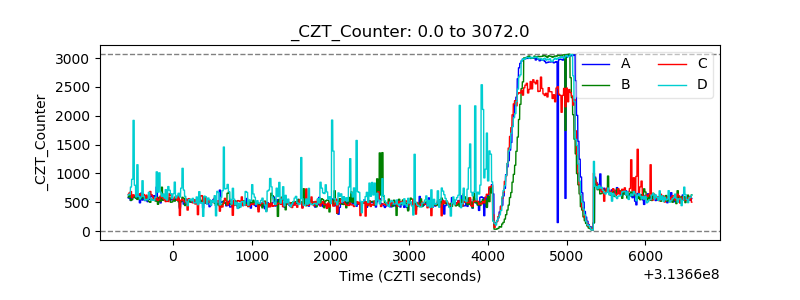 |
| +2.5 Volts monitor |  |
| +5 Volts monitor | 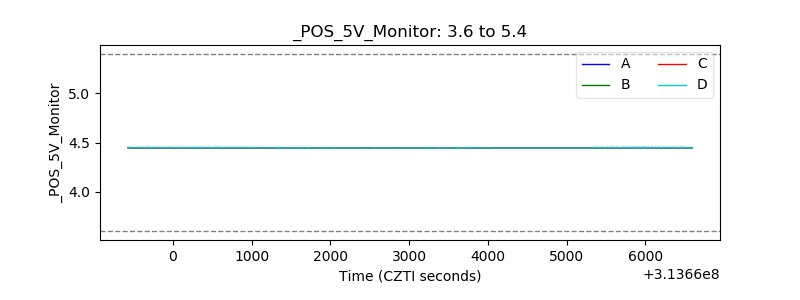 |
| _ROLL_ROT | 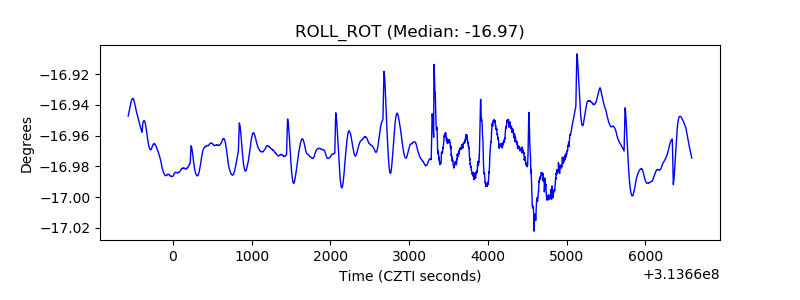 |
| _Roll_DEC |  |
| _Roll_RA | 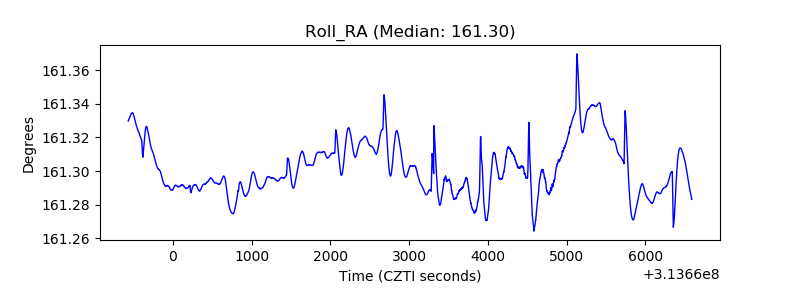 |
| Veto Counter | 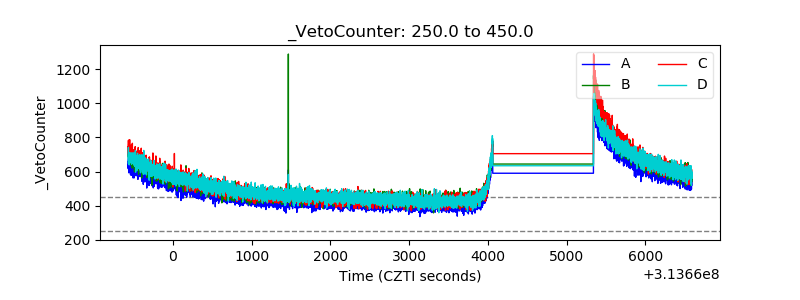 |