| Param | Original file | Final file |
|---|---|---|
| Filename | modeM0/AS1A08_007T01_9000003362_22710cztM0_level2.evt | modeM0/AS1A08_007T01_9000003362_22710cztM0_level2_quad_clean.evt |
| Size (bytes) | 443,136,960 | 94,363,200 |
| Size | 422.6 MB | 90.0 MB |
| Events in quadrant A | 3,146,933 | 631,931 |
| Events in quadrant B | 3,225,267 | 632,556 |
| Events in quadrant C | 3,207,314 | 598,737 |
| Events in quadrant D | 3,448,705 | 590,812 |
| Mode SS | |||
|---|---|---|---|
| Quadrant | BADHDUFLAG | Total packets | Discarded packets |
| A | 0 | 116 | 0 |
| B | 0 | 116 | 0 |
| C | 0 | 116 | 0 |
| D | 0 | 116 | 0 |
| Mode M0 | |||
|---|---|---|---|
| Quadrant | BADHDUFLAG | Total packets | Discarded packets |
| A | 0 | 12890 | 1 |
| B | 0 | 13102 | 3 |
| C | 0 | 13153 | 1 |
| D | 0 | 13938 | 1 |
| Mode M9 | |||
|---|---|---|---|
| Quadrant | BADHDUFLAG | Total packets | Discarded packets |
| A | 0 | 14 | 0 |
| B | 0 | 14 | 0 |
| C | 0 | 14 | 0 |
| D | 0 | 14 | 0 |
| Quadrant | Total seconds | Saturated seconds | Saturation percentage |
|---|---|---|---|
| A | 5781 | 51 | 0.882200% |
| B | 5780 | 61 | 1.055363% |
| C | 5781 | 101 | 1.747103% |
| D | 5781 | 63 | 1.089777% |
Noise dominated data is calculated using 1-second bins in cleaned event files. If a bin has >2000 counts, and if more than 50% of those come from <1% of pixels, then it is considered to be noise-dominated and hence unusable.
| Quadrant | # 1 sec bins | Bins with >0 counts | Bins with >2000 counts | High rate bins dominated by noise | Noise dominated (total time) | Noise dominated (detector-on time) | Marked lightcurve |
|---|---|---|---|---|---|---|---|
| A | 7126 | 5782 | 0 | 0 | 0.00% | 0.00% | 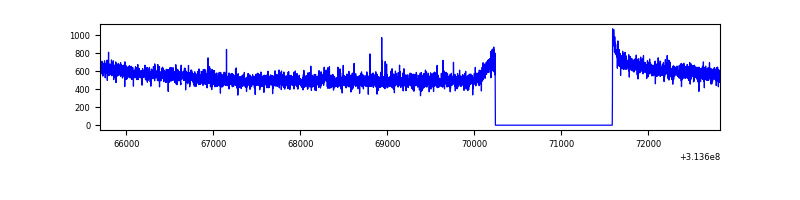 |
| B | 7125 | 5781 | 6 | 6 | 0.08% | 0.10% |  |
| C | 7126 | 5782 | 0 | 0 | 0.00% | 0.00% | 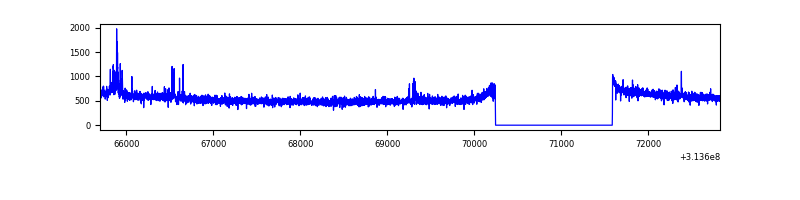 |
| D | 7126 | 5782 | 25 | 25 | 0.35% | 0.43% |  |
Top three noisy pixels from each quadrant. If the there are fewer than three noisy pixels in the level2.evt file, extra rows are filled as -1
| Pixel properties | Quadrant properties | ||||||
|---|---|---|---|---|---|---|---|
| Quadrant | DetID | PixID | Counts | Sigma | Mean | Median | Sigma |
| A | 13 | 254 | 10766 | 62.34 | 814 | 800 | 159.9 |
| A | 0 | 226 | 7159 | 39.78 | 814 | 800 | 159.9 |
| A | 11 | 47 | 6932 | 38.36 | 814 | 800 | 159.9 |
| B | 4 | 216 | 26435 | 175.53 | 797 | 781 | 146.2 |
| B | 0 | 190 | 26222 | 174.07 | 797 | 781 | 146.2 |
| B | 12 | 16 | 24718 | 163.78 | 797 | 781 | 146.2 |
| C | 14 | 238 | 124425 | 699.22 | 773 | 780 | 176.8 |
| C | 10 | 22 | 71439 | 399.58 | 773 | 780 | 176.8 |
| C | 13 | 61 | 5347 | 25.83 | 773 | 780 | 176.8 |
| D | 12 | 233 | 174270 | 908.97 | 794 | 774 | 190.9 |
| D | 1 | 52 | 133668 | 696.25 | 794 | 774 | 190.9 |
| D | 7 | 238 | 39103 | 200.81 | 794 | 774 | 190.9 |
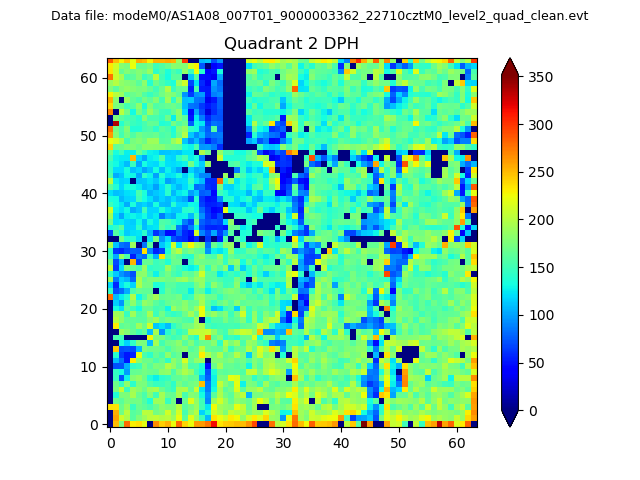
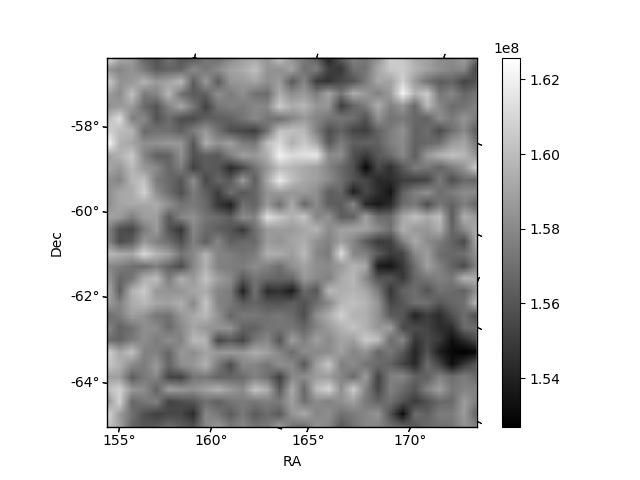
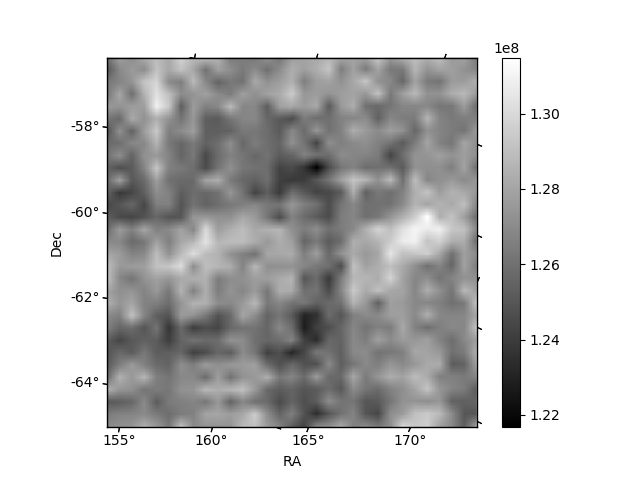
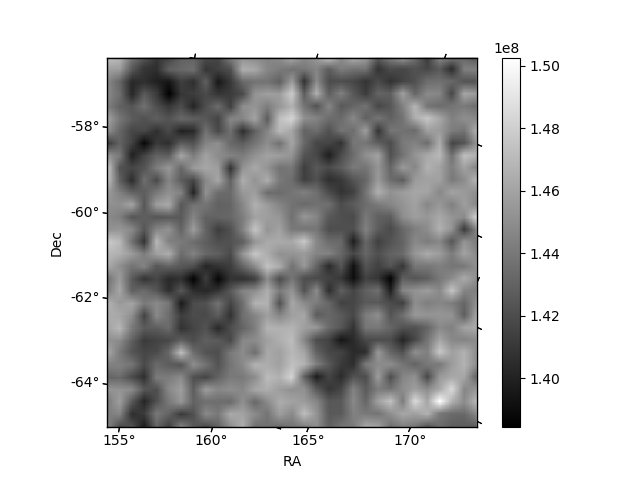
Histogram calculated using DETX and DETY for each event in the final _common_clean file
| Quadrant A | 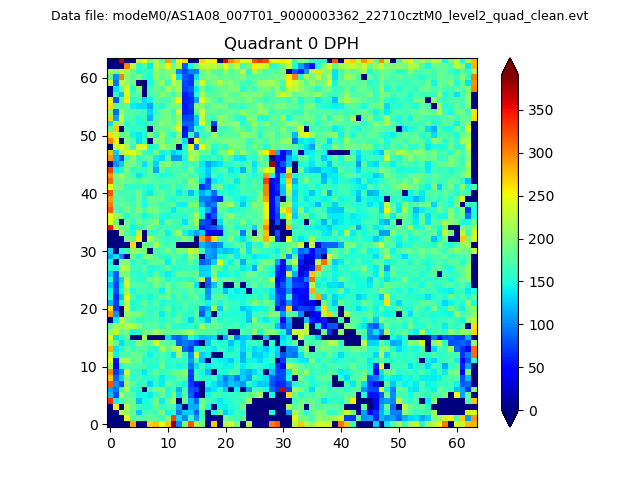 |
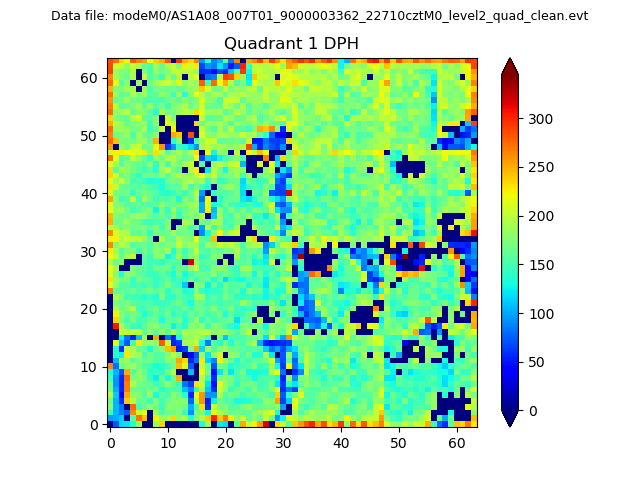 |
Quadrant B |
|---|---|---|---|
| Quadrant D | 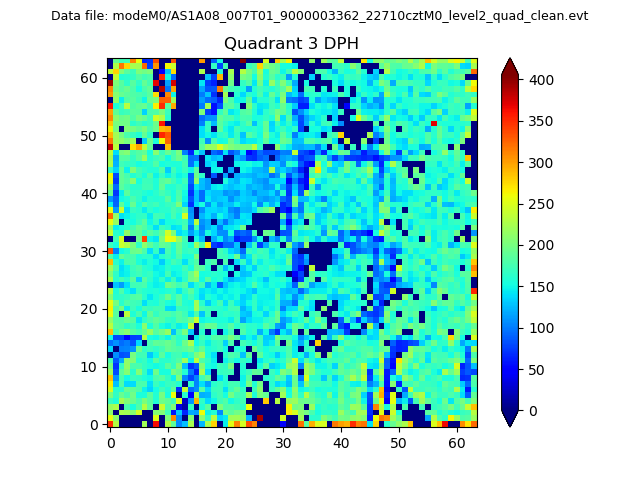 |
 |
Quadrant C |
| Plot type | Count rate plots | Images |
|---|---|---|
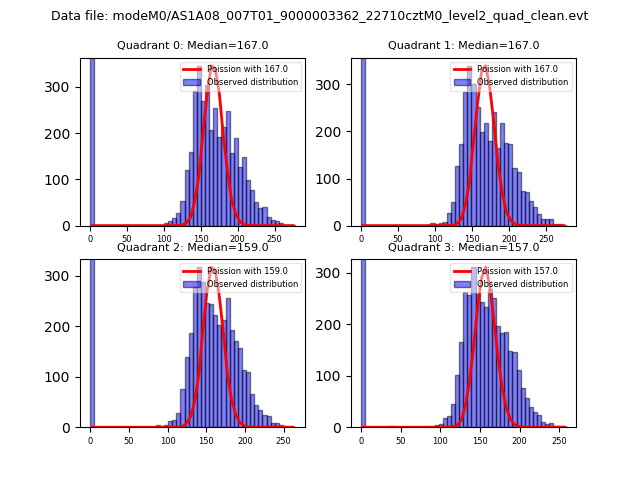
| Comparison with Poisson distribution Blue bars denote a histogram of data divided into 1 sec bins. Red curve is a Poisson curve with rate = median count rate of data. |
 |
 |
| Quadrant-wise count rates Data is divided into 100 sec bins |
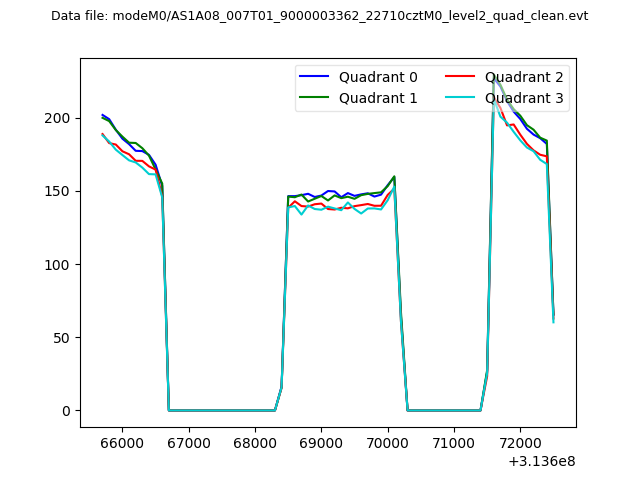 |
|
| Module-wise count rates for Quadrant A Data is divided into 100 sec bins |
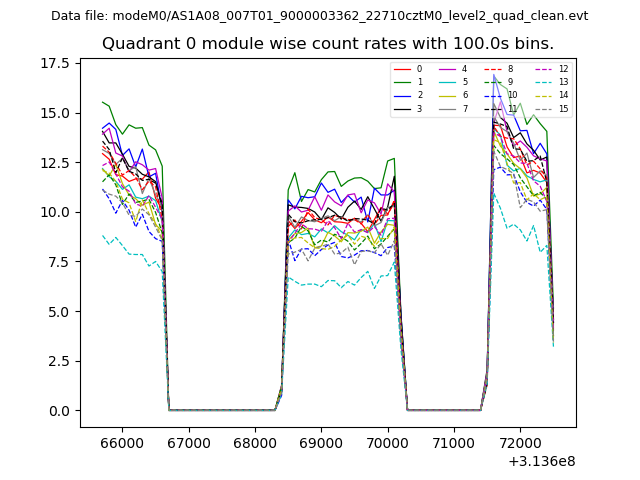 |
 |
| Module-wise count rates for Quadrant B Data is divided into 100 sec bins |
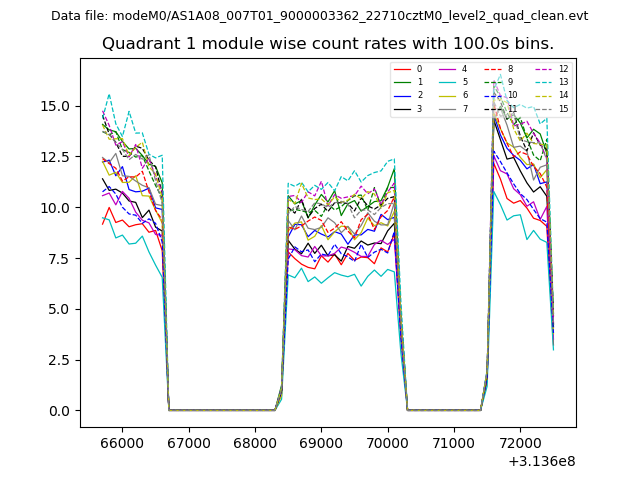 |
 |
| Module-wise count rates for Quadrant C Data is divided into 100 sec bins |
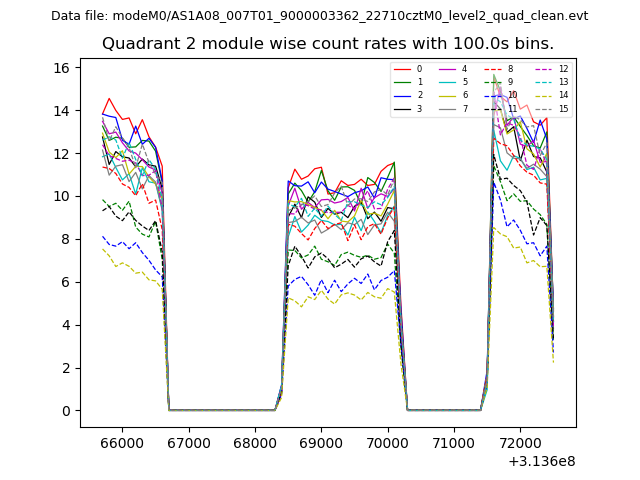 |
 |
| Module-wise count rates for Quadrant D Data is divided into 100 sec bins |
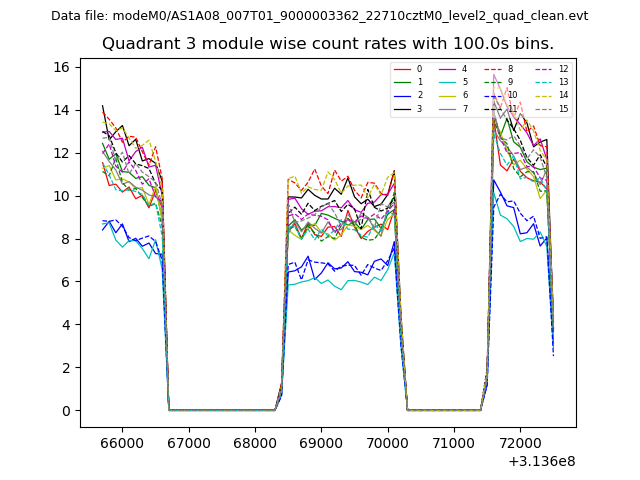 |
 |
| Parameter | Plot |
|---|---|
| CZT HV Monitor | 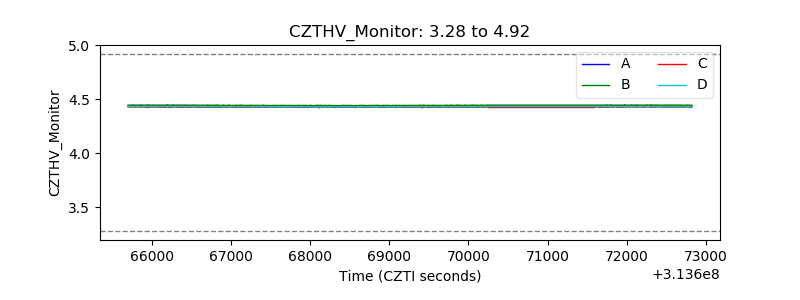 |
| D_VDD | 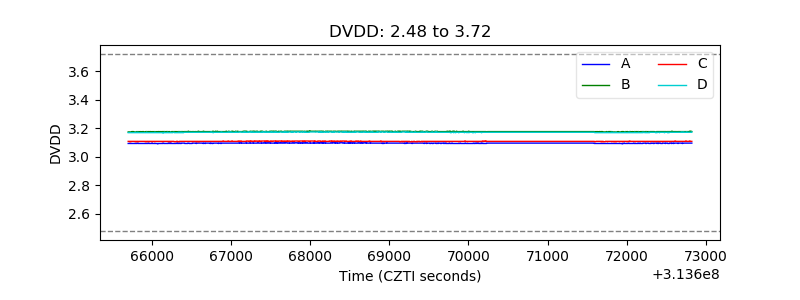 |
| Temperature 1 | 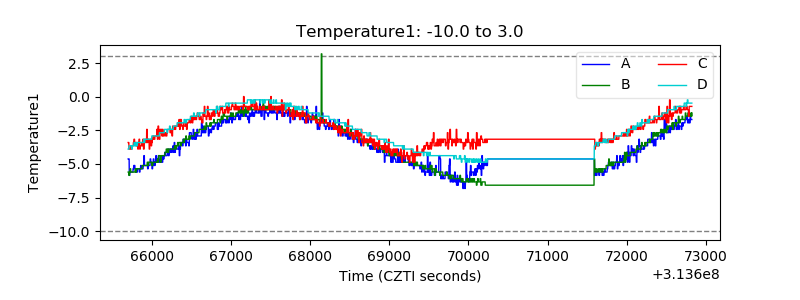 |
| Veto HV Monitor | 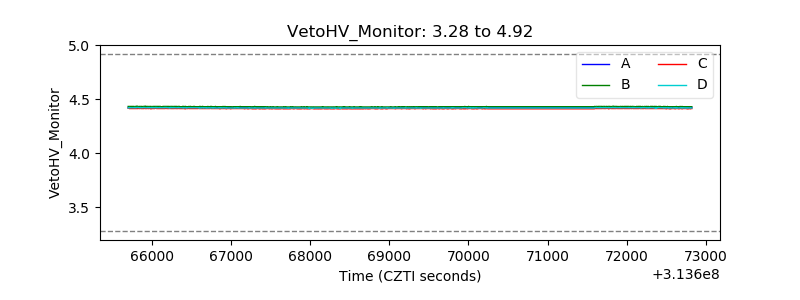 |
| Veto LLD |  |
| Alpha Counter | 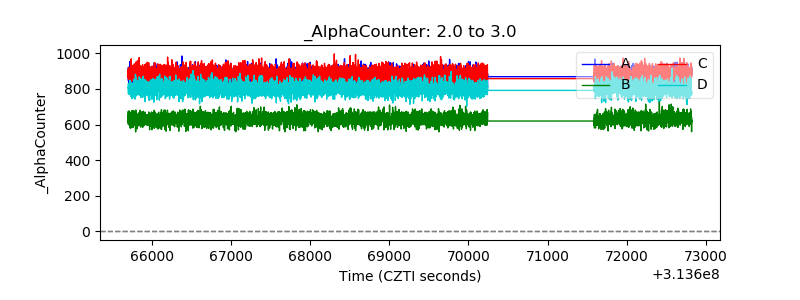 |
| _CPM_Rate | 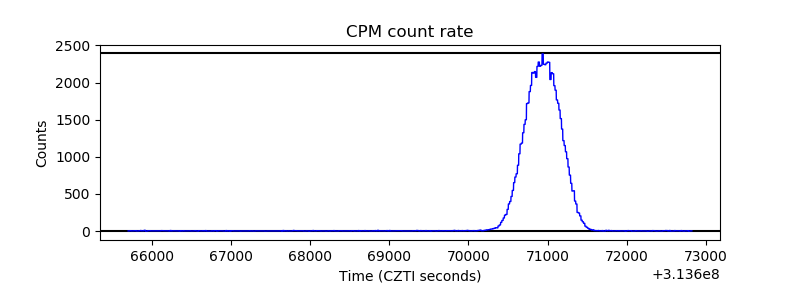 |
| CZT Counter | 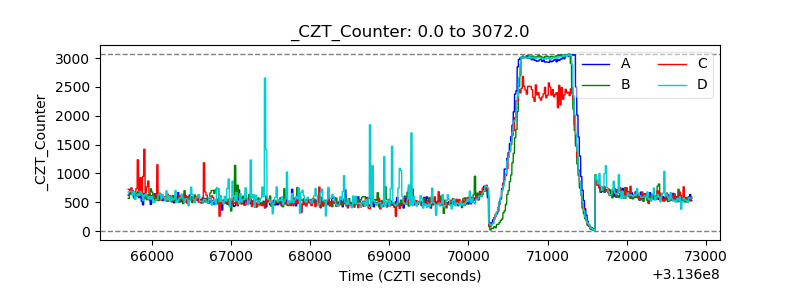 |
| +2.5 Volts monitor |  |
| +5 Volts monitor |  |
| _ROLL_ROT | 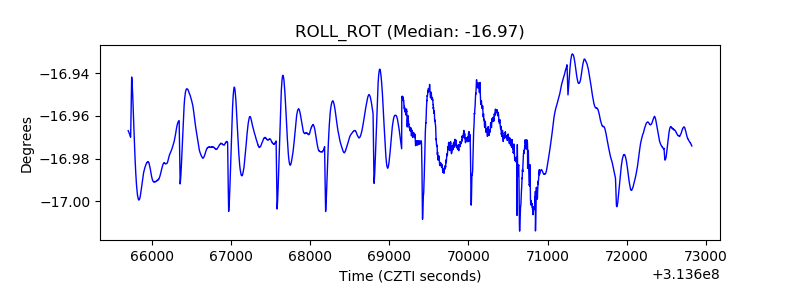 |
| _Roll_DEC | 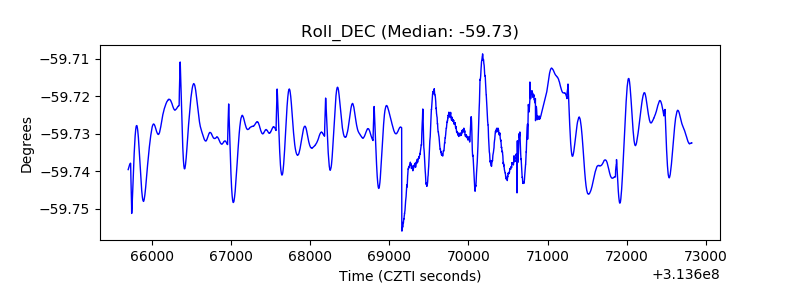 |
| _Roll_RA | 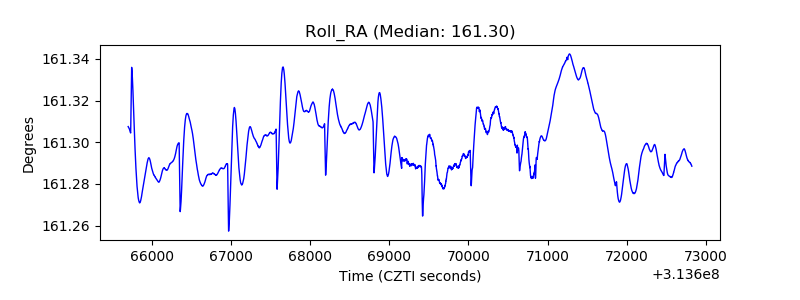 |
| Veto Counter | 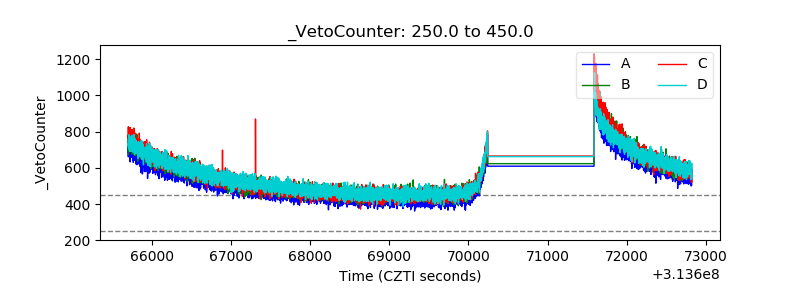 |