| Param | Original file | Final file |
|---|---|---|
| Filename | modeM0/AS1A08_007T01_9000003362_22711cztM0_level2.evt | modeM0/AS1A08_007T01_9000003362_22711cztM0_level2_quad_clean.evt |
| Size (bytes) | 471,709,440 | 82,877,760 |
| Size | 449.9 MB | 79.0 MB |
| Events in quadrant A | 3,322,150 | 536,026 |
| Events in quadrant B | 3,396,137 | 538,525 |
| Events in quadrant C | 3,327,534 | 506,885 |
| Events in quadrant D | 3,825,451 | 501,899 |
| Mode SS | |||
|---|---|---|---|
| Quadrant | BADHDUFLAG | Total packets | Discarded packets |
| A | 0 | 126 | 0 |
| B | 0 | 126 | 0 |
| C | 0 | 126 | 0 |
| D | 0 | 126 | 0 |
| Mode M0 | |||
|---|---|---|---|
| Quadrant | BADHDUFLAG | Total packets | Discarded packets |
| A | 0 | 13542 | 1 |
| B | 0 | 13788 | 1 |
| C | 0 | 13641 | 1 |
| D | 0 | 15402 | 1 |
| Mode M9 | |||
|---|---|---|---|
| Quadrant | BADHDUFLAG | Total packets | Discarded packets |
| A | 0 | 13 | 0 |
| B | 0 | 13 | 0 |
| C | 0 | 13 | 0 |
| D | 0 | 13 | 0 |
| Quadrant | Total seconds | Saturated seconds | Saturation percentage |
|---|---|---|---|
| A | 6100 | 99 | 1.622951% |
| B | 6101 | 94 | 1.540731% |
| C | 6101 | 144 | 2.360269% |
| D | 6101 | 104 | 1.704639% |
Noise dominated data is calculated using 1-second bins in cleaned event files. If a bin has >2000 counts, and if more than 50% of those come from <1% of pixels, then it is considered to be noise-dominated and hence unusable.
| Quadrant | # 1 sec bins | Bins with >0 counts | Bins with >2000 counts | High rate bins dominated by noise | Noise dominated (total time) | Noise dominated (detector-on time) | Marked lightcurve |
|---|---|---|---|---|---|---|---|
| A | 7440 | 6101 | 0 | 0 | 0.00% | 0.00% | 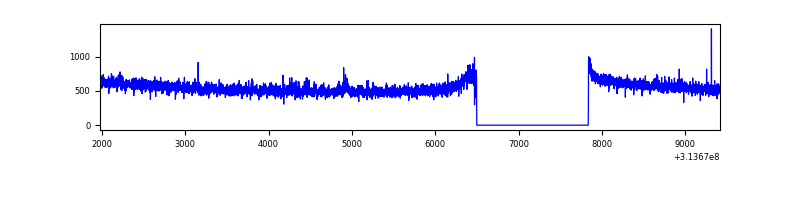 |
| B | 7441 | 6102 | 3 | 3 | 0.04% | 0.05% | 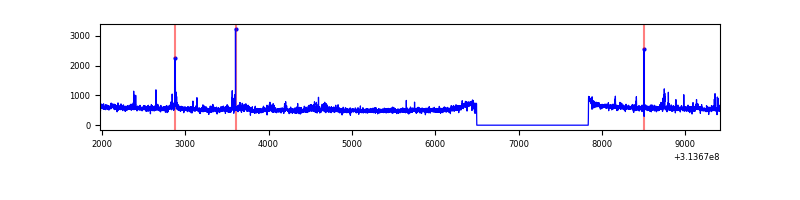 |
| C | 7441 | 6102 | 5 | 5 | 0.07% | 0.08% | 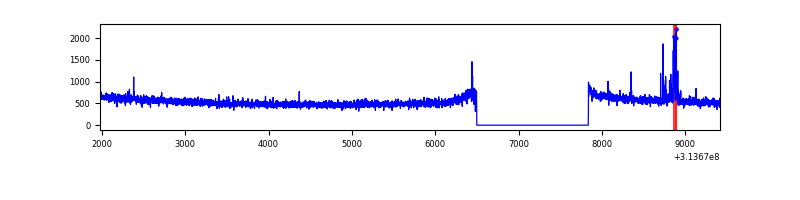 |
| D | 7441 | 6102 | 27 | 27 | 0.36% | 0.44% | 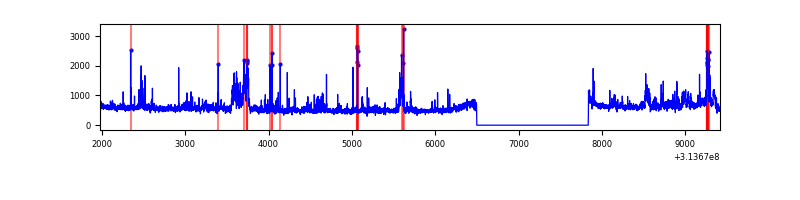 |
Top three noisy pixels from each quadrant. If the there are fewer than three noisy pixels in the level2.evt file, extra rows are filled as -1
| Pixel properties | Quadrant properties | ||||||
|---|---|---|---|---|---|---|---|
| Quadrant | DetID | PixID | Counts | Sigma | Mean | Median | Sigma |
| A | 11 | 47 | 34179 | 199.23 | 851 | 838 | 167.4 |
| A | 13 | 254 | 11350 | 62.81 | 851 | 838 | 167.4 |
| A | 0 | 226 | 7694 | 40.97 | 851 | 838 | 167.4 |
| B | 0 | 219 | 34809 | 224.19 | 835 | 818 | 151.6 |
| B | 0 | 190 | 31346 | 201.35 | 835 | 818 | 151.6 |
| B | 0 | 245 | 25050 | 159.83 | 835 | 818 | 151.6 |
| C | 14 | 238 | 129230 | 708.59 | 800 | 806 | 181.2 |
| C | 9 | 54 | 60471 | 329.21 | 800 | 806 | 181.2 |
| C | 10 | 22 | 16882 | 88.7 | 800 | 806 | 181.2 |
| D | 12 | 227 | 384914 | 1952.81 | 826 | 805 | 196.7 |
| D | 1 | 52 | 145915 | 737.74 | 826 | 805 | 196.7 |
| D | 12 | 233 | 81142 | 408.43 | 826 | 805 | 196.7 |
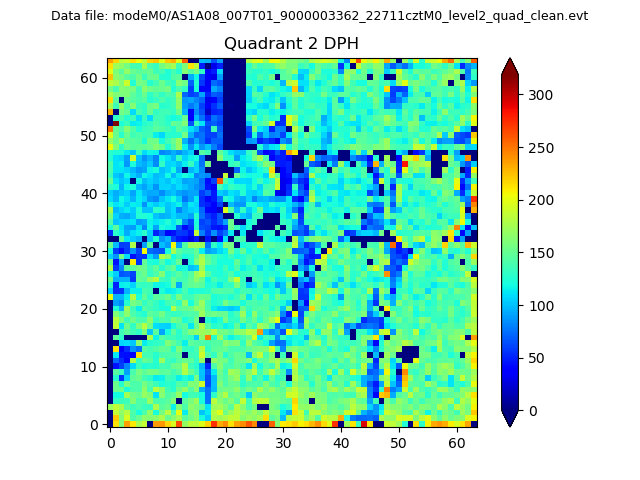
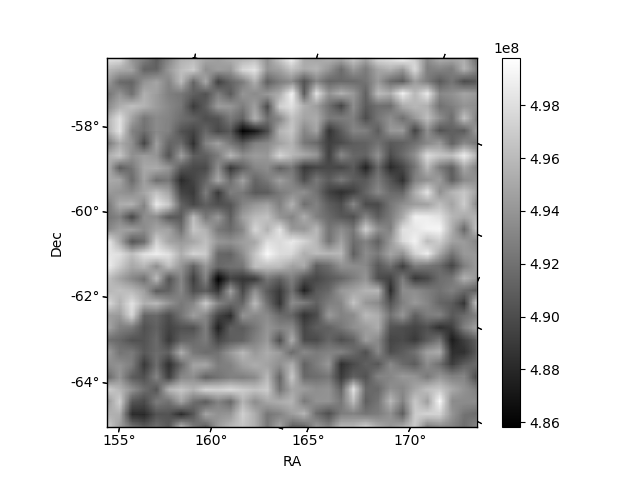
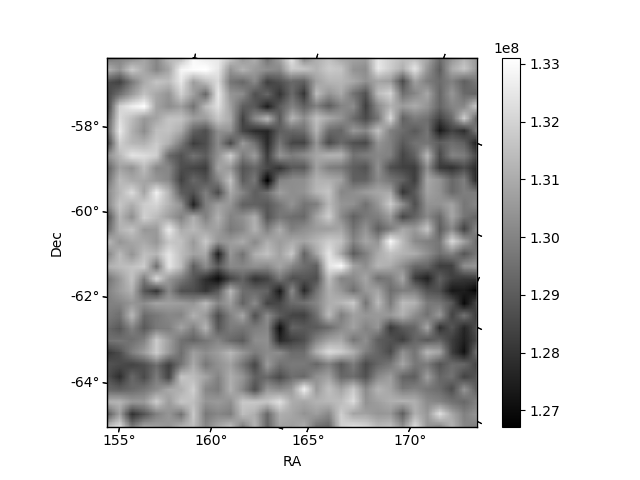
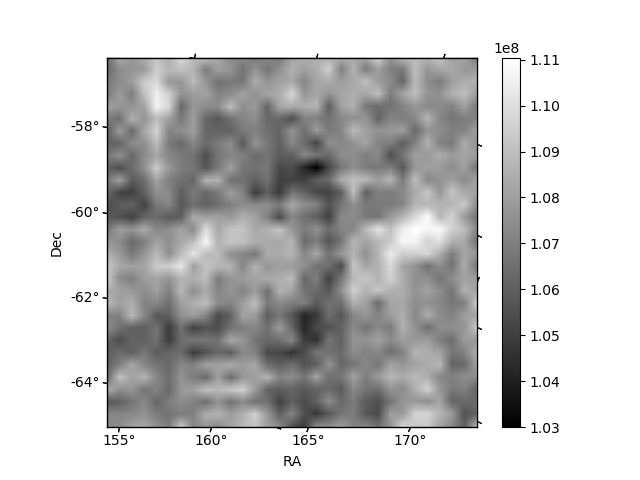
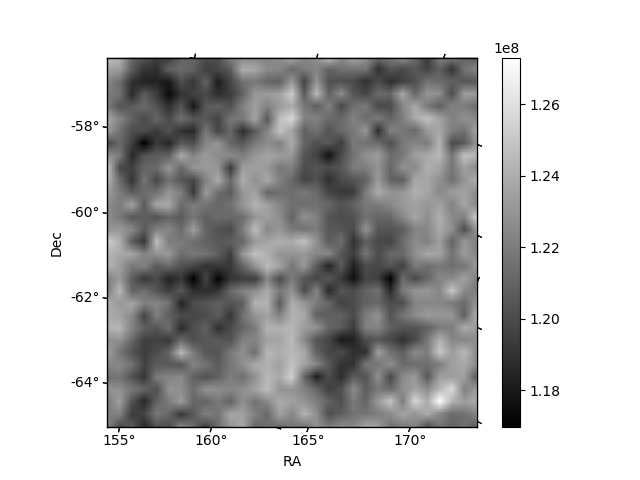
Histogram calculated using DETX and DETY for each event in the final _common_clean file
| Quadrant A | 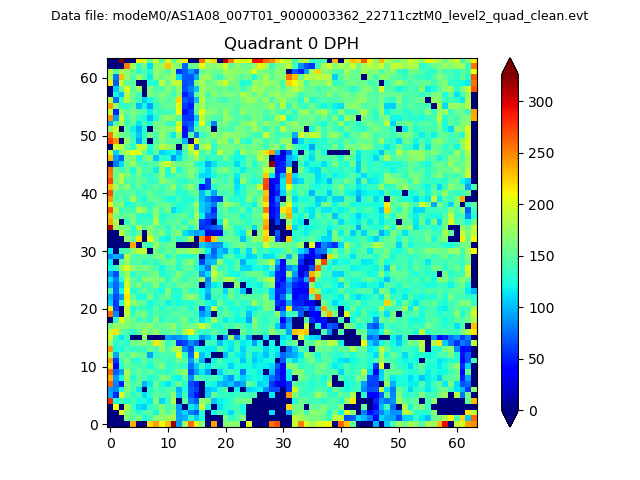 |
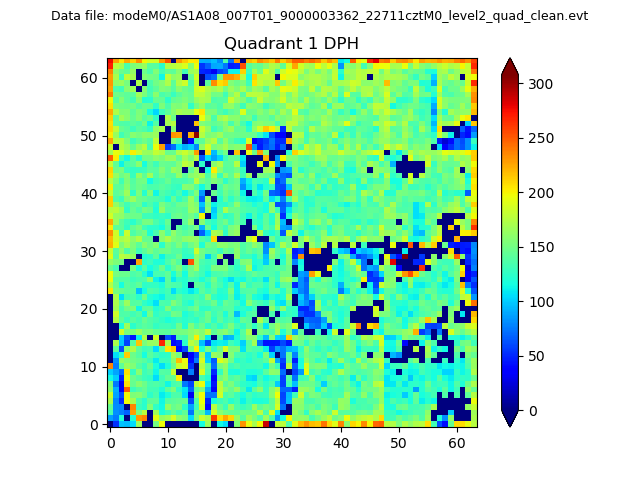 |
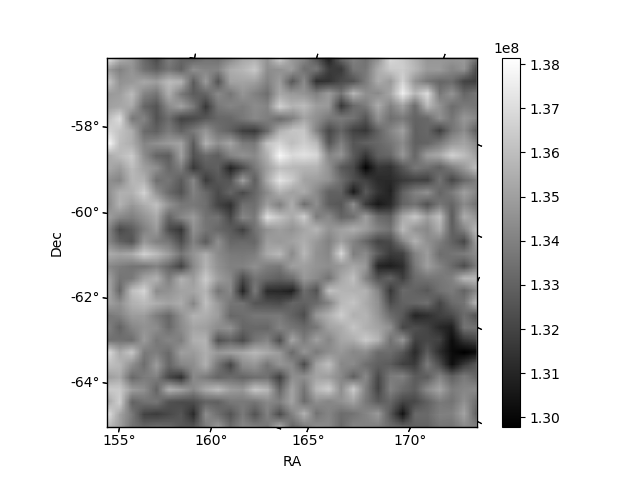
Quadrant B |
|---|---|---|---|
| Quadrant D | 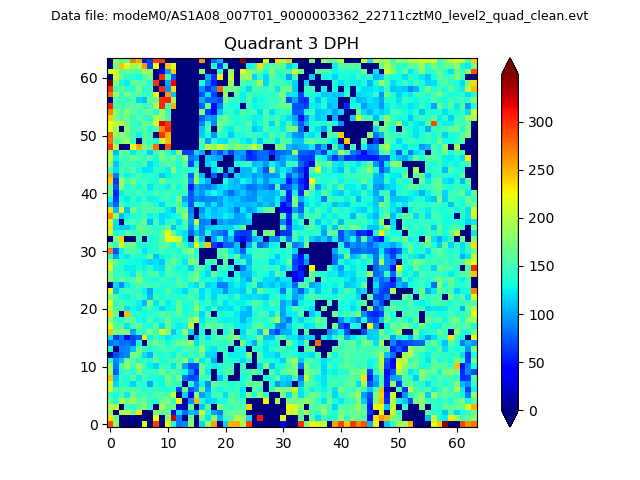 |
 |
Quadrant C |
| Plot type | Count rate plots | Images |
|---|---|---|
| Comparison with Poisson distribution Blue bars denote a histogram of data divided into 1 sec bins. Red curve is a Poisson curve with rate = median count rate of data. |
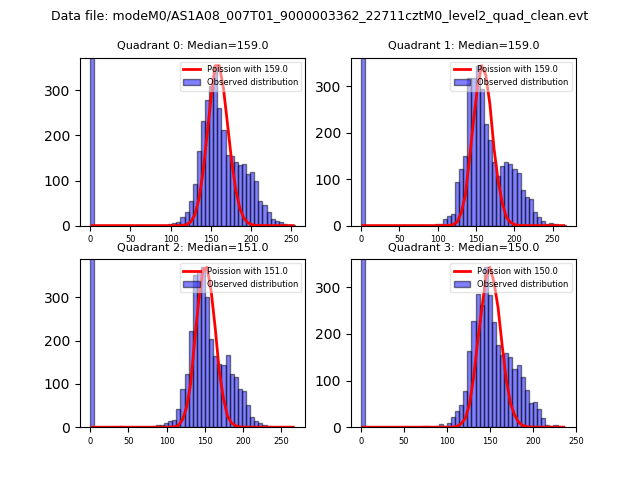 |
 |
| Quadrant-wise count rates Data is divided into 100 sec bins |
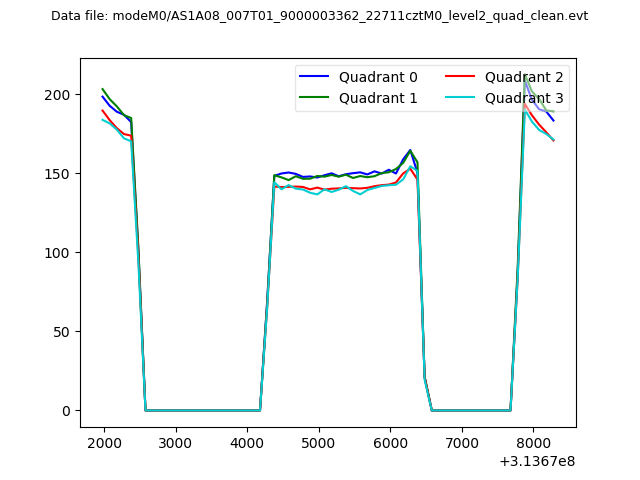 |
|
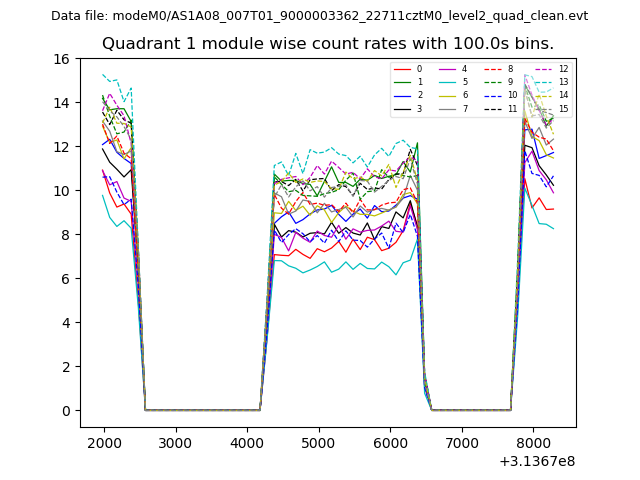
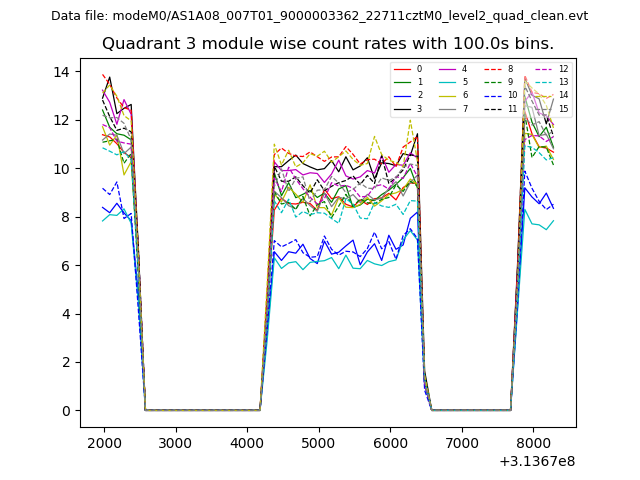
| Module-wise count rates for Quadrant A Data is divided into 100 sec bins |
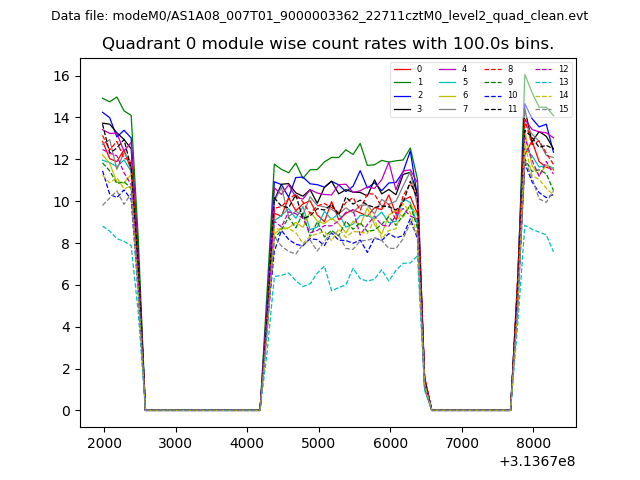 |
 |
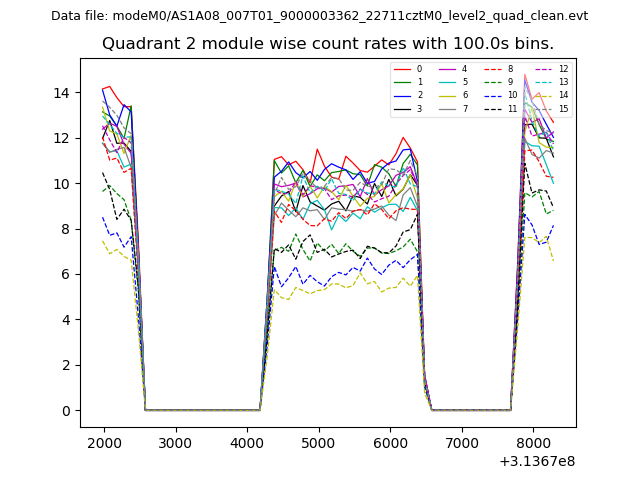
| Module-wise count rates for Quadrant B Data is divided into 100 sec bins |
 |
 |
| Module-wise count rates for Quadrant C Data is divided into 100 sec bins |
 |
 |
| Module-wise count rates for Quadrant D Data is divided into 100 sec bins |
 |
 |
| Parameter | Plot |
|---|---|
| CZT HV Monitor | 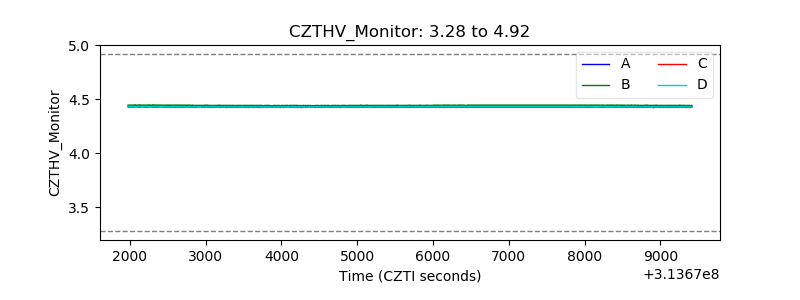 |
| D_VDD | 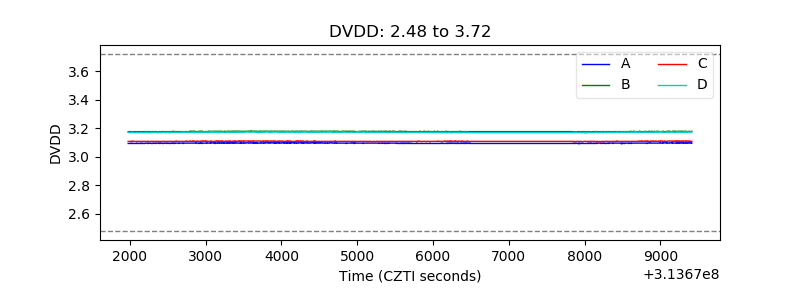 |
| Temperature 1 | 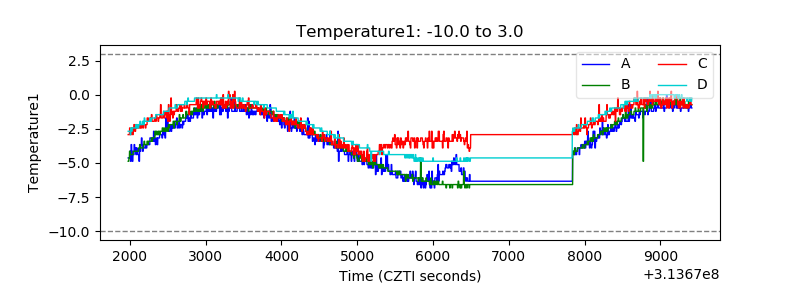 |
| Veto HV Monitor | 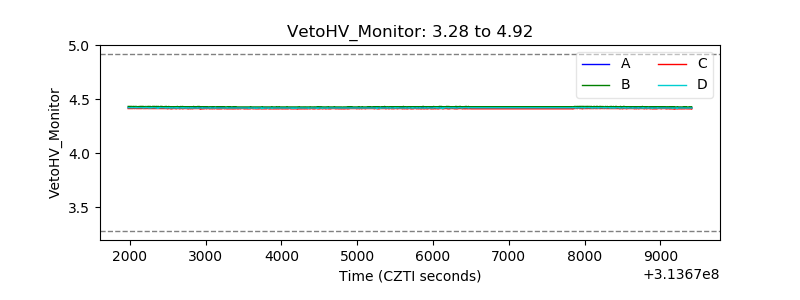 |
| Veto LLD | 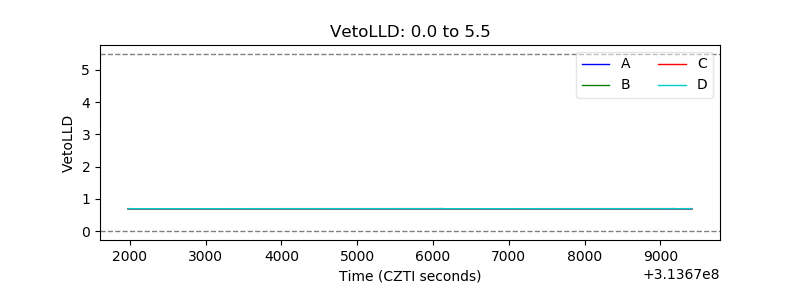 |
| Alpha Counter | 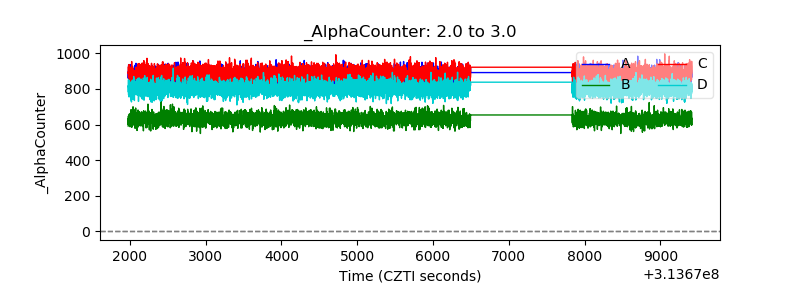 |
| _CPM_Rate | 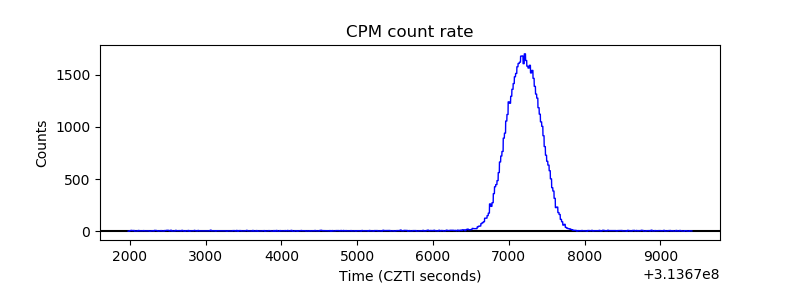 |
| CZT Counter | 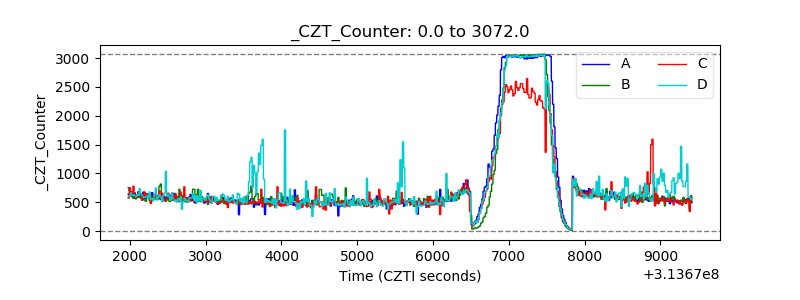 |
| +2.5 Volts monitor |  |
| +5 Volts monitor | 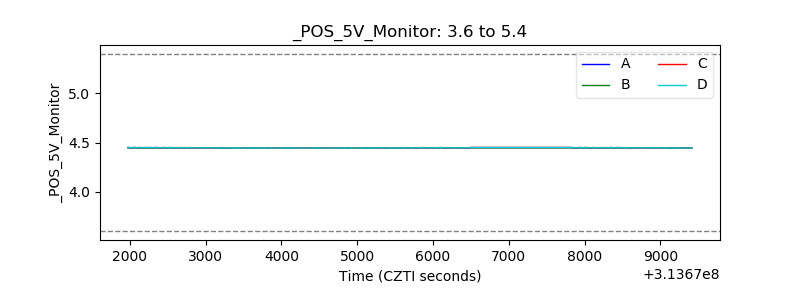 |
| _ROLL_ROT | 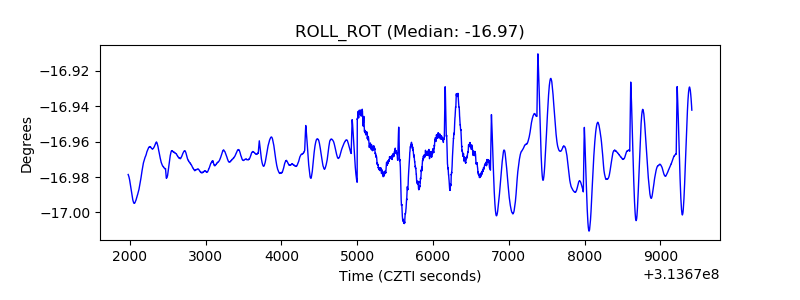 |
| _Roll_DEC | 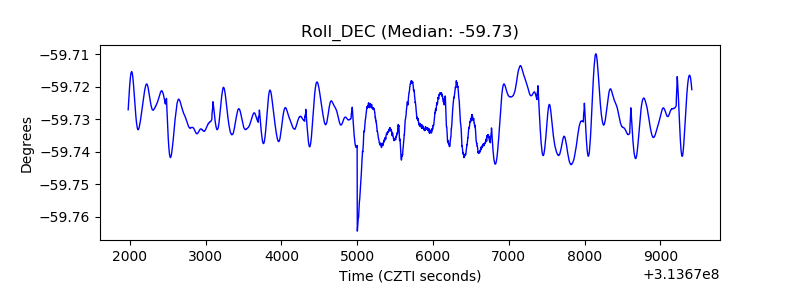 |
| _Roll_RA | 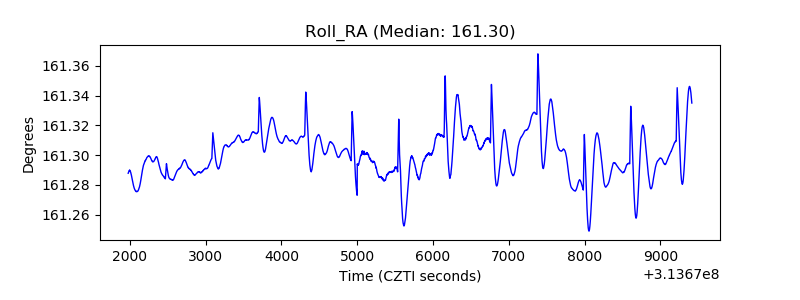 |
| Veto Counter | 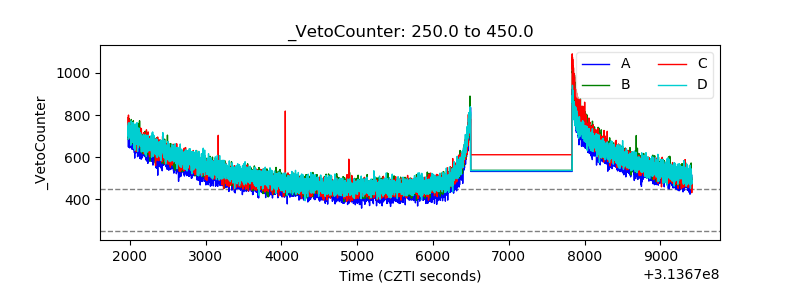 |