| Param | Original file | Final file |
|---|---|---|
| Filename | modeM0/AS1A08_007T01_9000003362_22712cztM0_level2.evt | modeM0/AS1A08_007T01_9000003362_22712cztM0_level2_quad_clean.evt |
| Size (bytes) | 509,716,800 | 82,025,280 |
| Size | 486.1 MB | 78.2 MB |
| Events in quadrant A | 3,469,163 | 522,428 |
| Events in quadrant B | 3,550,080 | 525,138 |
| Events in quadrant C | 3,484,770 | 492,857 |
| Events in quadrant D | 4,488,308 | 486,323 |
| Mode SS | |||
|---|---|---|---|
| Quadrant | BADHDUFLAG | Total packets | Discarded packets |
| A | 0 | 134 | 0 |
| B | 0 | 134 | 0 |
| C | 0 | 134 | 0 |
| D | 0 | 134 | 0 |
| Mode M0 | |||
|---|---|---|---|
| Quadrant | BADHDUFLAG | Total packets | Discarded packets |
| A | 0 | 14286 | 2 |
| B | 0 | 14495 | 2 |
| C | 0 | 14397 | 2 |
| D | 0 | 17786 | 2 |
| Mode M9 | |||
|---|---|---|---|
| Quadrant | BADHDUFLAG | Total packets | Discarded packets |
| A | 0 | 15 | 0 |
| B | 0 | 16 | 0 |
| C | 0 | 16 | 0 |
| D | 0 | 16 | 0 |
| Quadrant | Total seconds | Saturated seconds | Saturation percentage |
|---|---|---|---|
| A | 6550 | 105 | 1.603053% |
| B | 6550 | 111 | 1.694656% |
| C | 6550 | 159 | 2.427481% |
| D | 6550 | 255 | 3.893130% |
Noise dominated data is calculated using 1-second bins in cleaned event files. If a bin has >2000 counts, and if more than 50% of those come from <1% of pixels, then it is considered to be noise-dominated and hence unusable.
| Quadrant | # 1 sec bins | Bins with >0 counts | Bins with >2000 counts | High rate bins dominated by noise | Noise dominated (total time) | Noise dominated (detector-on time) | Marked lightcurve |
|---|---|---|---|---|---|---|---|
| A | 7800 | 6551 | 0 | 0 | 0.00% | 0.00% | 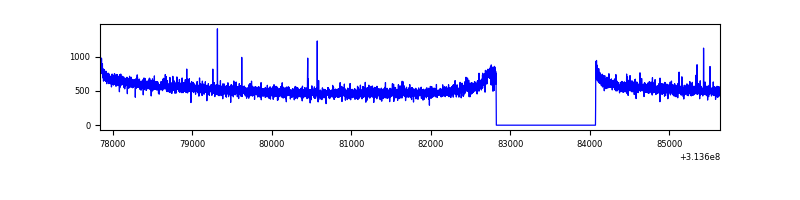 |
| B | 7800 | 6551 | 3 | 3 | 0.04% | 0.05% | 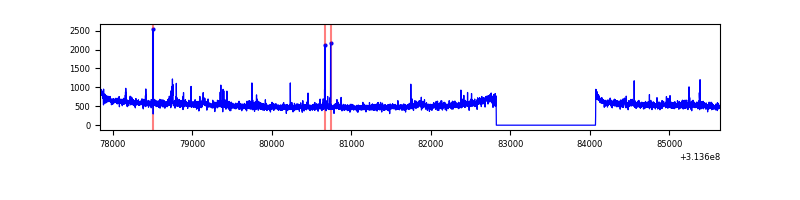 |
| C | 7800 | 6551 | 5 | 5 | 0.06% | 0.08% | 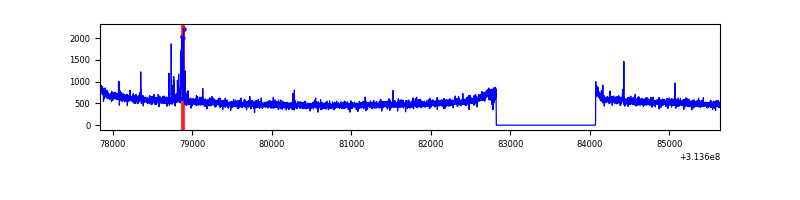 |
| D | 7800 | 6551 | 142 | 142 | 1.82% | 2.17% | 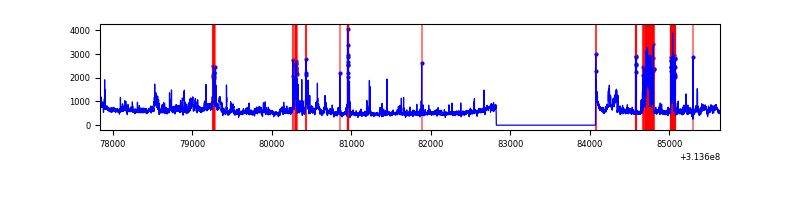 |
Top three noisy pixels from each quadrant. If the there are fewer than three noisy pixels in the level2.evt file, extra rows are filled as -1
| Pixel properties | Quadrant properties | ||||||
|---|---|---|---|---|---|---|---|
| Quadrant | DetID | PixID | Counts | Sigma | Mean | Median | Sigma |
| A | 13 | 254 | 12548 | 66.98 | 893 | 878 | 174.2 |
| A | 0 | 226 | 7812 | 39.8 | 893 | 878 | 174.2 |
| A | 11 | 47 | 7388 | 37.36 | 893 | 878 | 174.2 |
| B | 0 | 245 | 30659 | 185.32 | 881 | 863 | 160.8 |
| B | 0 | 219 | 29351 | 177.19 | 881 | 863 | 160.8 |
| B | 12 | 111 | 17642 | 104.36 | 881 | 863 | 160.8 |
| C | 14 | 238 | 136468 | 706.06 | 840 | 843 | 192.1 |
| C | 9 | 54 | 60934 | 312.83 | 840 | 843 | 192.1 |
| C | 10 | 22 | 10899 | 52.35 | 840 | 843 | 192.1 |
| D | 12 | 233 | 455174 | 2212.75 | 859 | 836 | 205.3 |
| D | 12 | 227 | 375463 | 1824.53 | 859 | 836 | 205.3 |
| D | 1 | 52 | 223168 | 1082.82 | 859 | 836 | 205.3 |
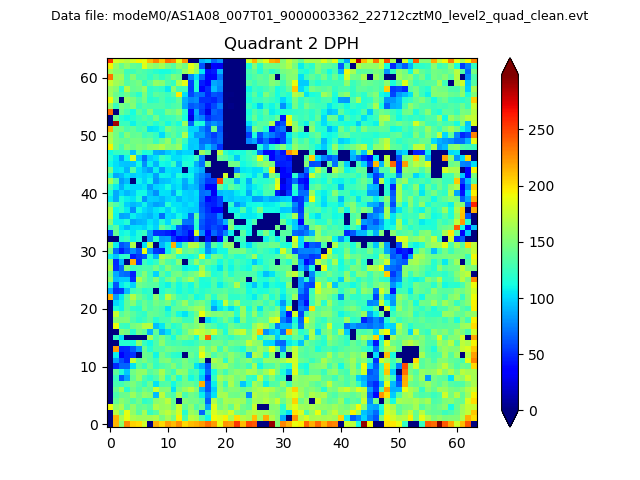
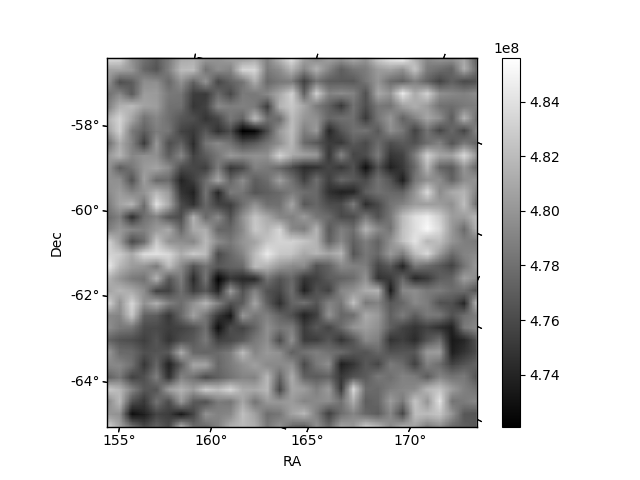
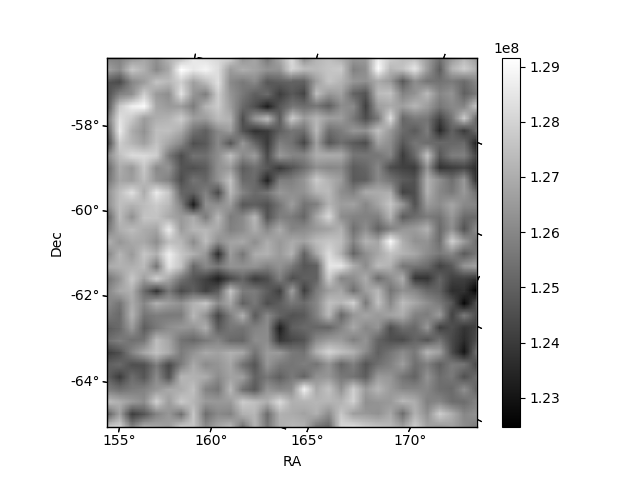
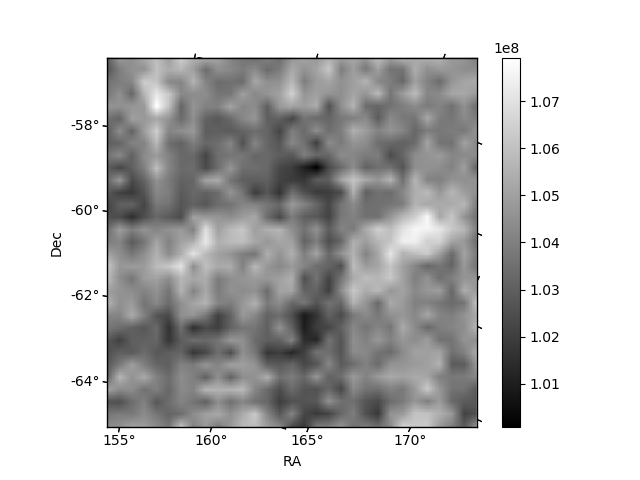
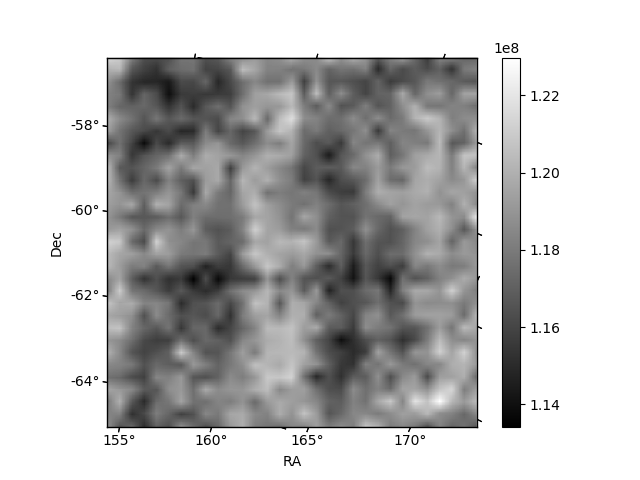
Histogram calculated using DETX and DETY for each event in the final _common_clean file
| Quadrant A | 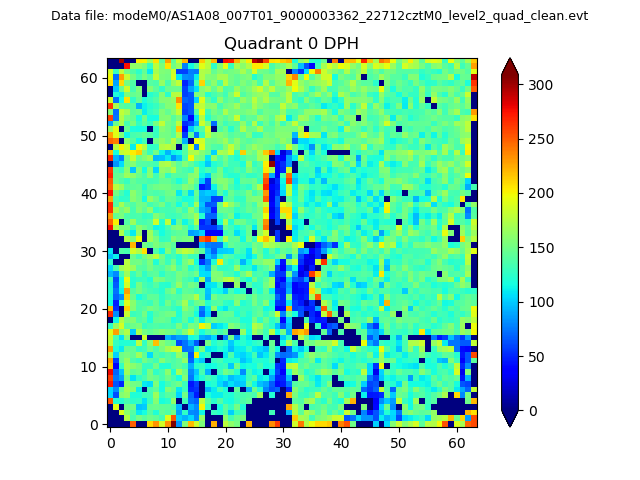 |
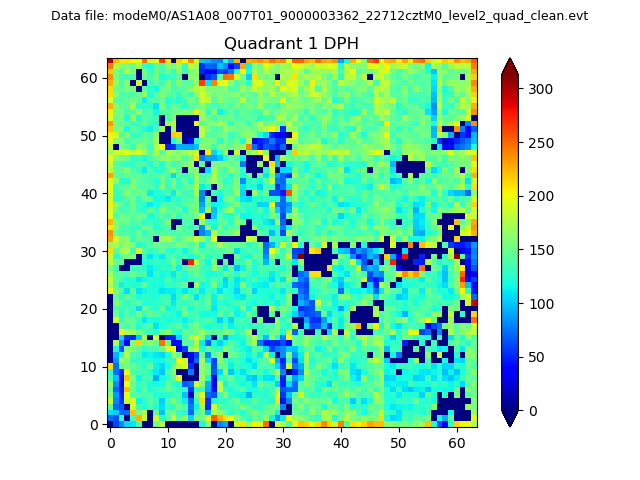 |
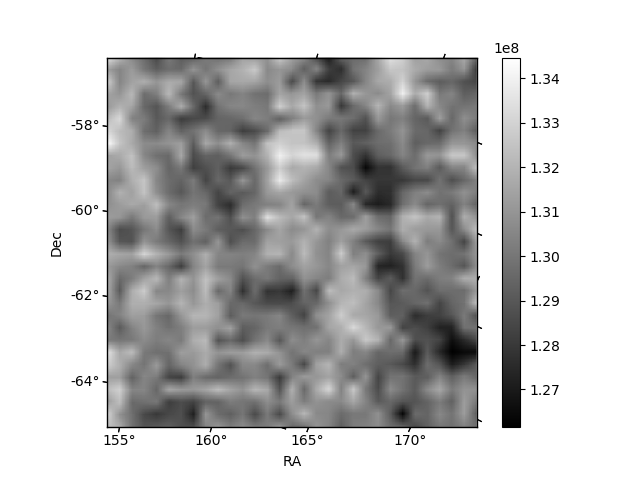
Quadrant B |
|---|---|---|---|
| Quadrant D | 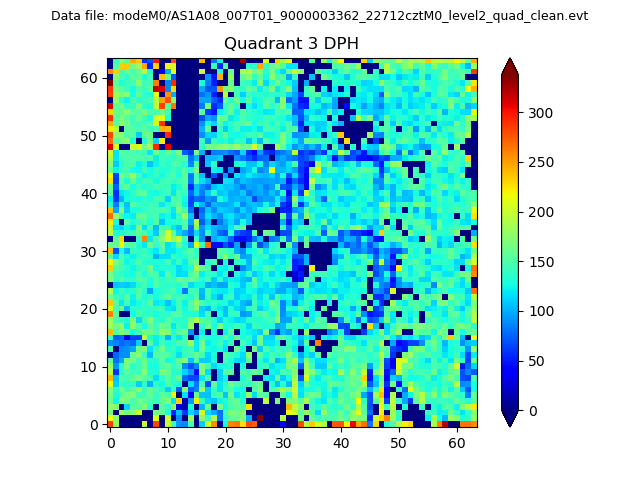 |
 |
Quadrant C |
| Plot type | Count rate plots | Images |
|---|---|---|
| Comparison with Poisson distribution Blue bars denote a histogram of data divided into 1 sec bins. Red curve is a Poisson curve with rate = median count rate of data. |
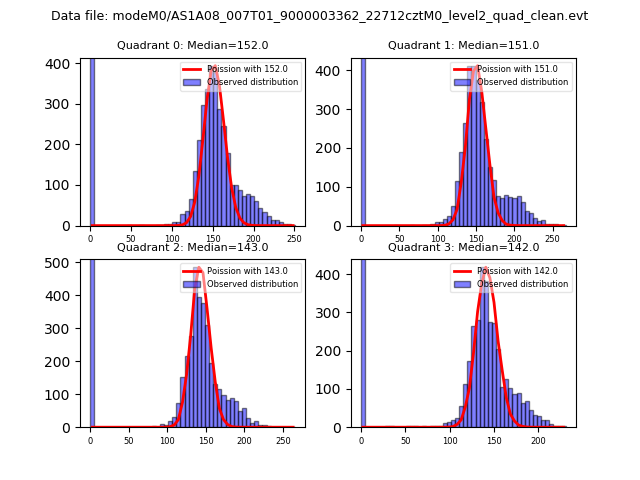 |
 |
| Quadrant-wise count rates Data is divided into 100 sec bins |
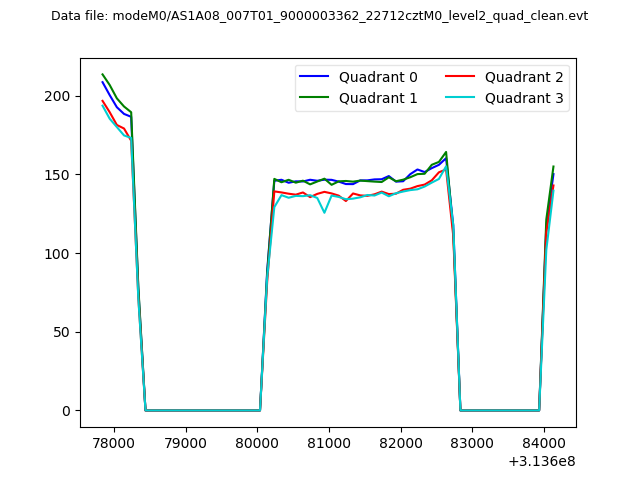 |
|
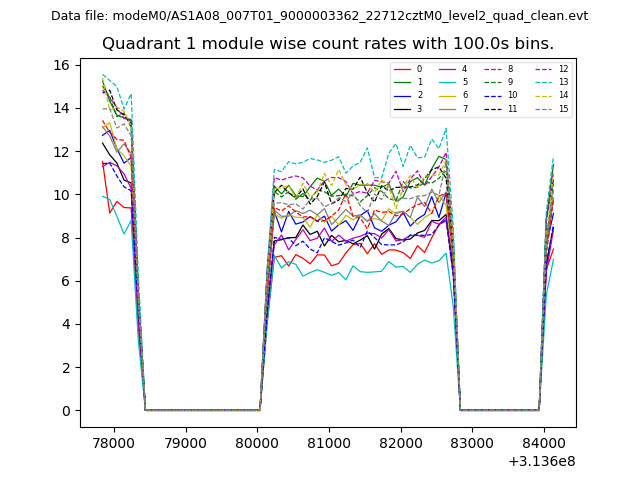
| Module-wise count rates for Quadrant A Data is divided into 100 sec bins |
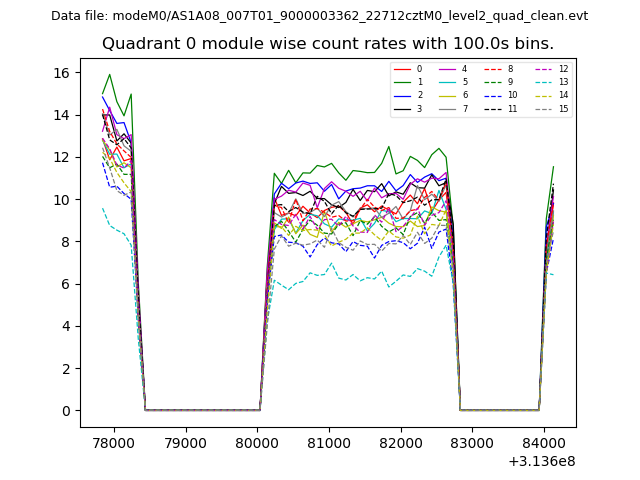 |
 |
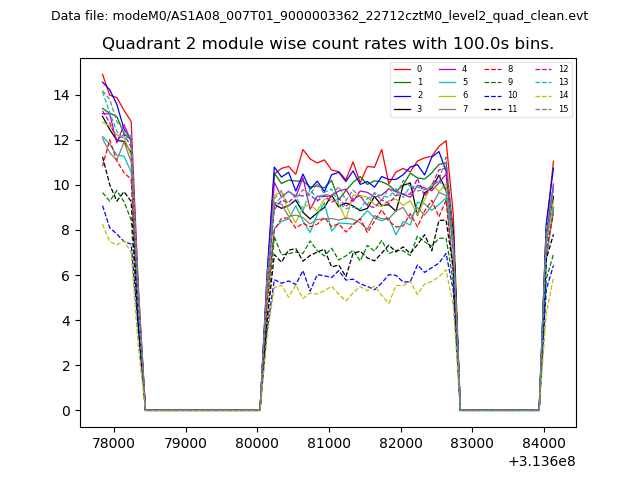
| Module-wise count rates for Quadrant B Data is divided into 100 sec bins |
 |
 |
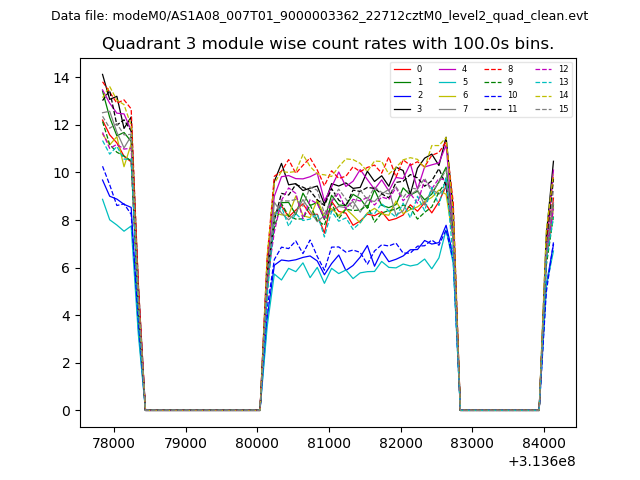
| Module-wise count rates for Quadrant C Data is divided into 100 sec bins |
 |
 |
| Module-wise count rates for Quadrant D Data is divided into 100 sec bins |
 |
 |
| Parameter | Plot |
|---|---|
| CZT HV Monitor | 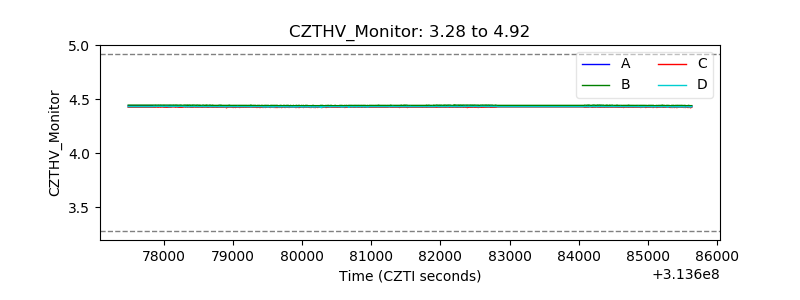 |
| D_VDD | 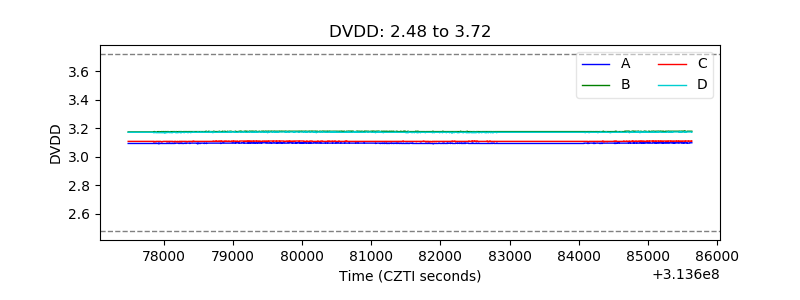 |
| Temperature 1 | 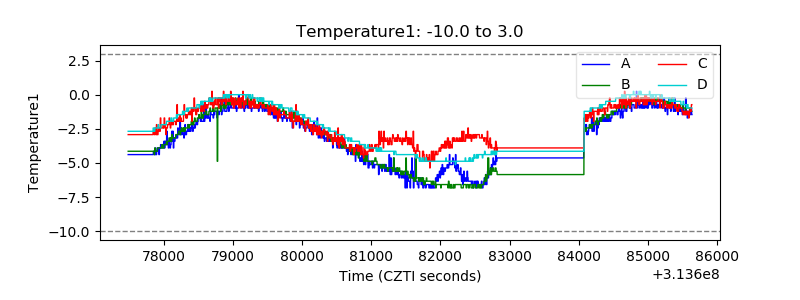 |
| Veto HV Monitor |  |
| Veto LLD | 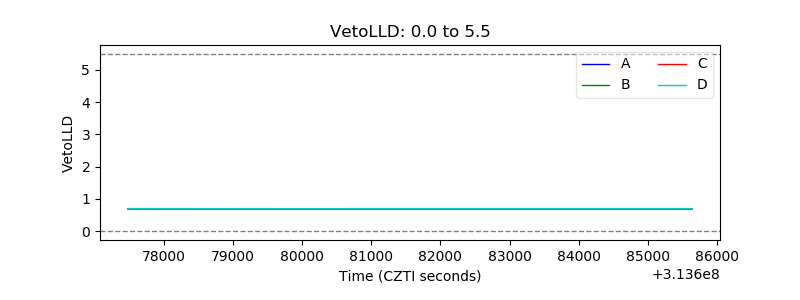 |
| Alpha Counter | 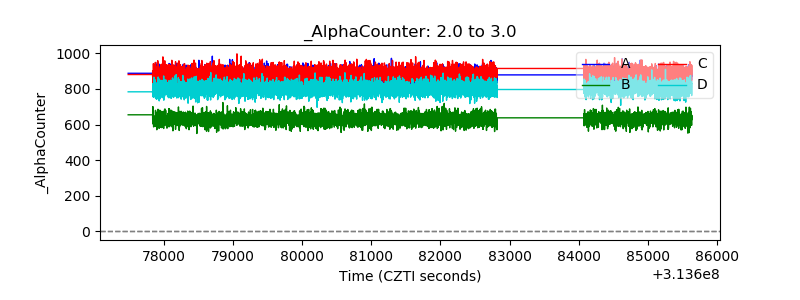 |
| _CPM_Rate | 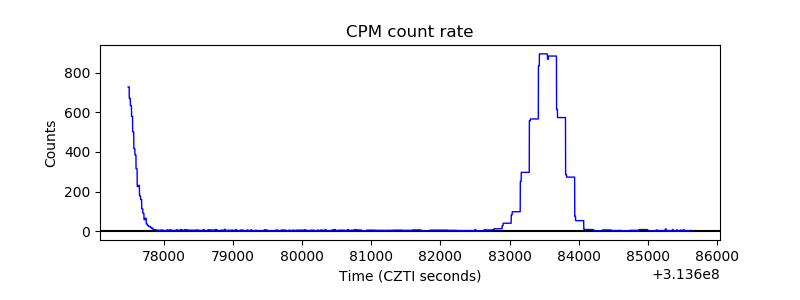 |
| CZT Counter | 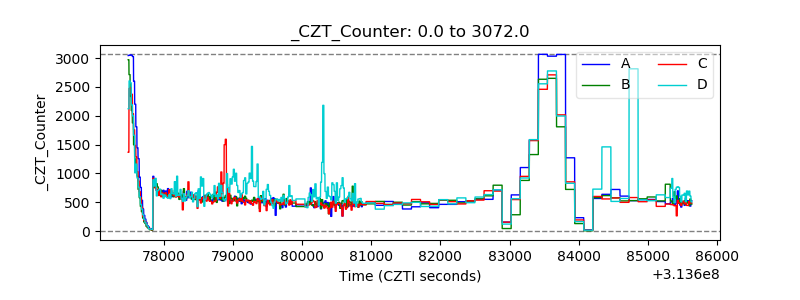 |
| +2.5 Volts monitor | 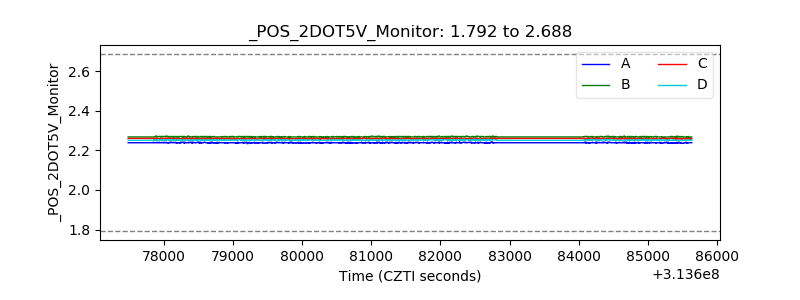 |
| +5 Volts monitor |  |
| _ROLL_ROT | 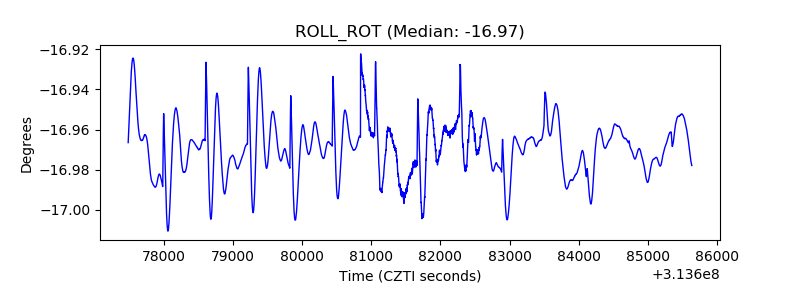 |
| _Roll_DEC | 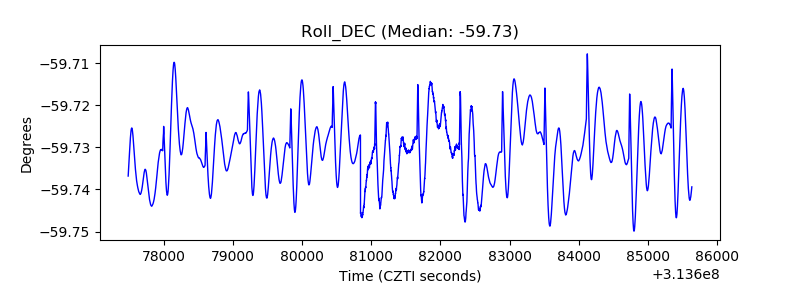 |
| _Roll_RA | 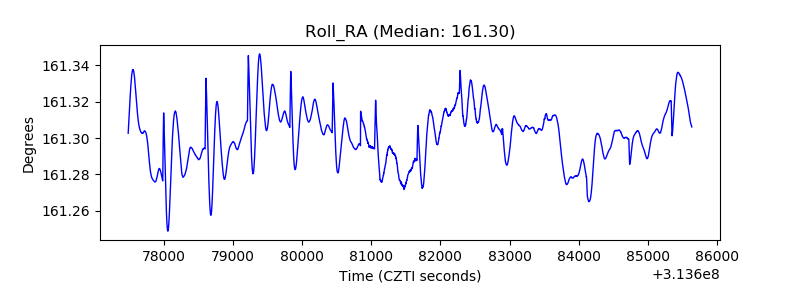 |
| Veto Counter | 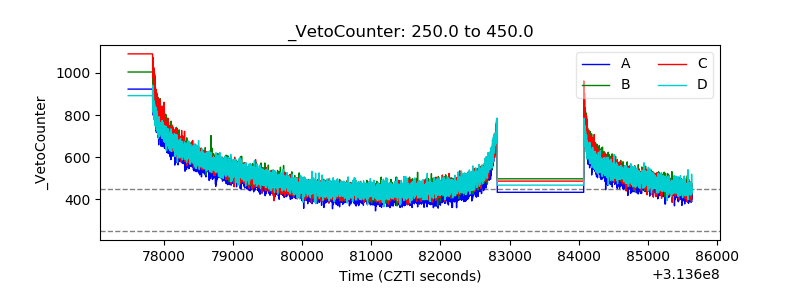 |