| Param | Original file | Final file |
|---|---|---|
| Filename | modeM0/AS1A08_007T01_9000003362_22713cztM0_level2.evt | modeM0/AS1A08_007T01_9000003362_22713cztM0_level2_quad_clean.evt |
| Size (bytes) | 520,652,160 | 79,220,160 |
| Size | 496.5 MB | 75.6 MB |
| Events in quadrant A | 3,428,835 | 493,034 |
| Events in quadrant B | 3,523,449 | 495,902 |
| Events in quadrant C | 3,408,746 | 470,689 |
| Events in quadrant D | 4,942,898 | 462,566 |
| Mode SS | |||
|---|---|---|---|
| Quadrant | BADHDUFLAG | Total packets | Discarded packets |
| A | 0 | 138 | 0 |
| B | 0 | 138 | 0 |
| C | 0 | 138 | 0 |
| D | 0 | 138 | 0 |
| Mode M0 | |||
|---|---|---|---|
| Quadrant | BADHDUFLAG | Total packets | Discarded packets |
| A | 0 | 14367 | 2 |
| B | 0 | 14509 | 3 |
| C | 0 | 14311 | 2 |
| D | 0 | 19235 | 2 |
| Mode M9 | |||
|---|---|---|---|
| Quadrant | BADHDUFLAG | Total packets | Discarded packets |
| A | 0 | 12 | 0 |
| B | 0 | 13 | 0 |
| C | 0 | 13 | 0 |
| D | 0 | 13 | 0 |
| Quadrant | Total seconds | Saturated seconds | Saturation percentage |
|---|---|---|---|
| A | 6842 | 112 | 1.636948% |
| B | 6841 | 117 | 1.710276% |
| C | 6841 | 131 | 1.914925% |
| D | 6841 | 316 | 4.619208% |
Noise dominated data is calculated using 1-second bins in cleaned event files. If a bin has >2000 counts, and if more than 50% of those come from <1% of pixels, then it is considered to be noise-dominated and hence unusable.
| Quadrant | # 1 sec bins | Bins with >0 counts | Bins with >2000 counts | High rate bins dominated by noise | Noise dominated (total time) | Noise dominated (detector-on time) | Marked lightcurve |
|---|---|---|---|---|---|---|---|
| A | 7787 | 6843 | 2 | 2 | 0.03% | 0.03% | 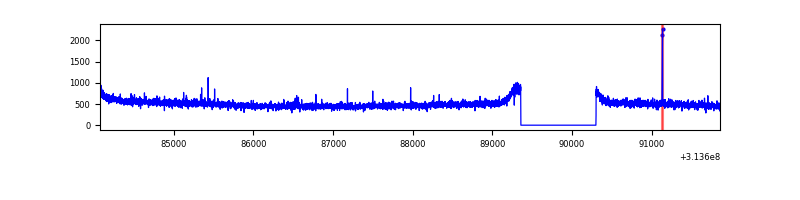 |
| B | 7786 | 6842 | 4 | 4 | 0.05% | 0.06% | 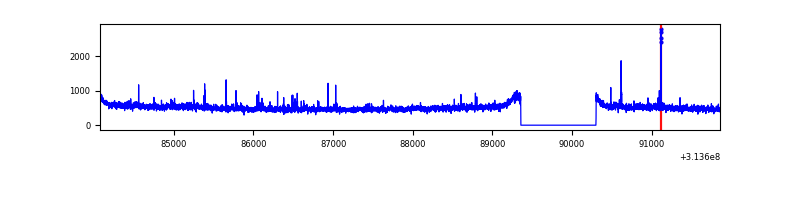 |
| C | 7786 | 6842 | 1 | 1 | 0.01% | 0.01% |  |
| D | 7786 | 6842 | 188 | 188 | 2.41% | 2.75% | 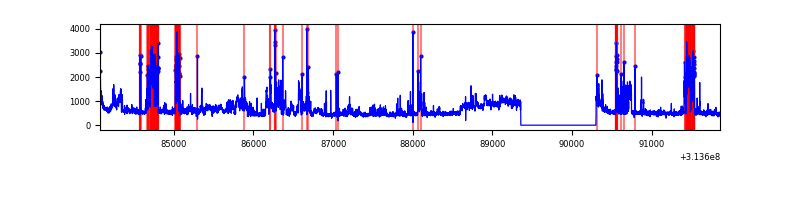 |
Top three noisy pixels from each quadrant. If the there are fewer than three noisy pixels in the level2.evt file, extra rows are filled as -1
| Pixel properties | Quadrant properties | ||||||
|---|---|---|---|---|---|---|---|
| Quadrant | DetID | PixID | Counts | Sigma | Mean | Median | Sigma |
| A | 13 | 170 | 14421 | 76.75 | 883 | 863 | 176.7 |
| A | 13 | 254 | 12930 | 68.31 | 883 | 863 | 176.7 |
| A | 0 | 226 | 7877 | 39.7 | 883 | 863 | 176.7 |
| B | 0 | 245 | 37083 | 222.43 | 874 | 855 | 162.9 |
| B | 0 | 228 | 28766 | 171.37 | 874 | 855 | 162.9 |
| B | 12 | 111 | 18192 | 106.45 | 874 | 855 | 162.9 |
| C | 14 | 238 | 132816 | 685.91 | 836 | 843 | 192.4 |
| C | 10 | 23 | 9180 | 43.33 | 836 | 843 | 192.4 |
| C | 10 | 22 | 7514 | 34.67 | 836 | 843 | 192.4 |
| D | 12 | 233 | 567872 | 2786.33 | 847 | 822 | 203.5 |
| D | 7 | 223 | 533314 | 2616.52 | 847 | 822 | 203.5 |
| D | 1 | 52 | 373770 | 1832.57 | 847 | 822 | 203.5 |
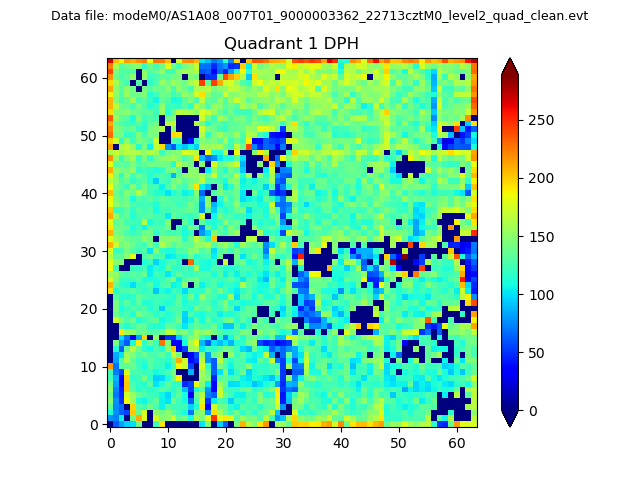
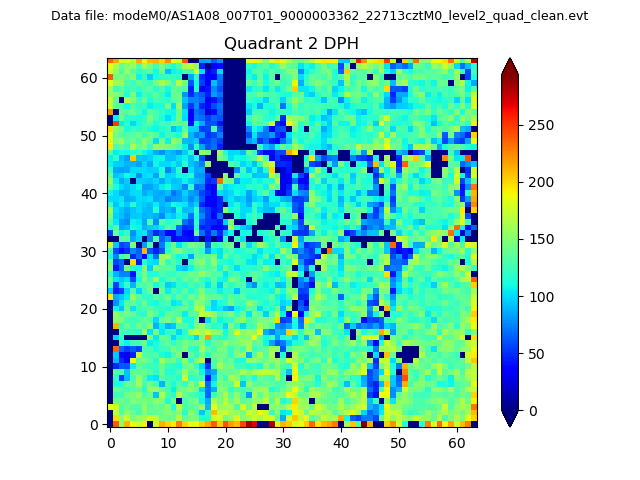
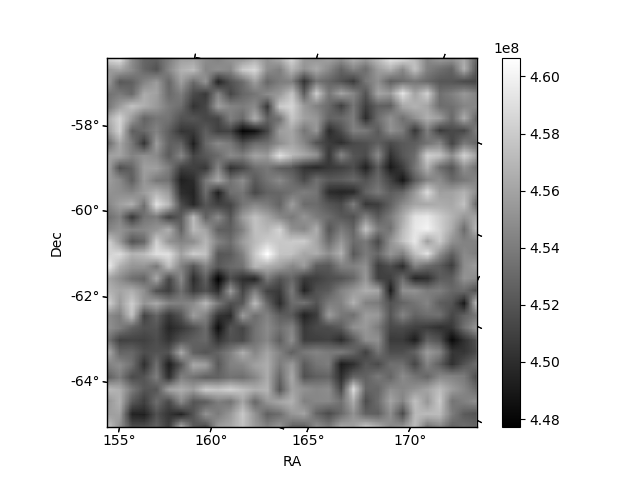
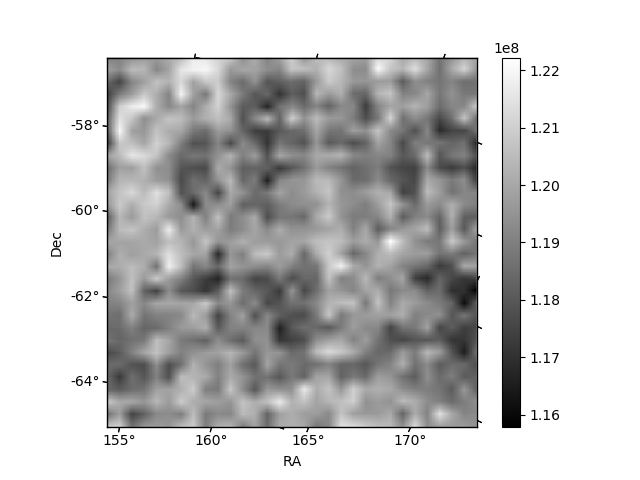
Histogram calculated using DETX and DETY for each event in the final _common_clean file
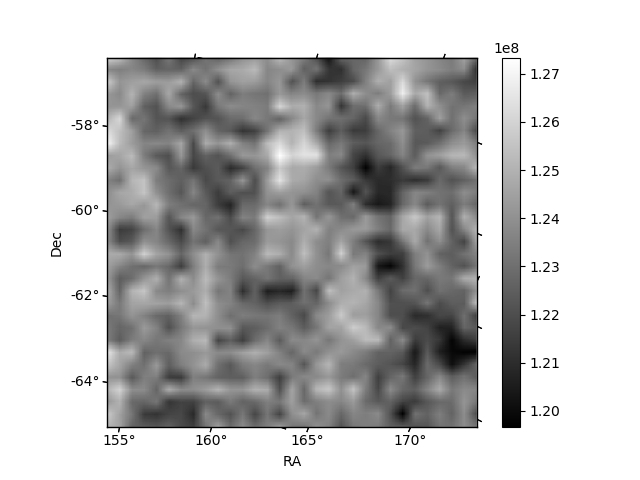
| Quadrant A | 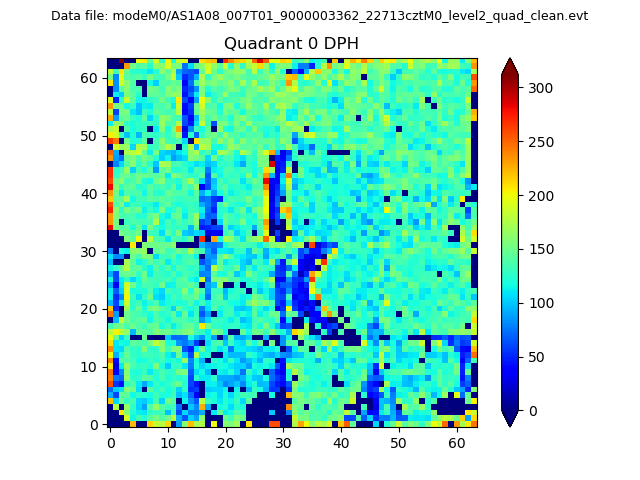 |
 |
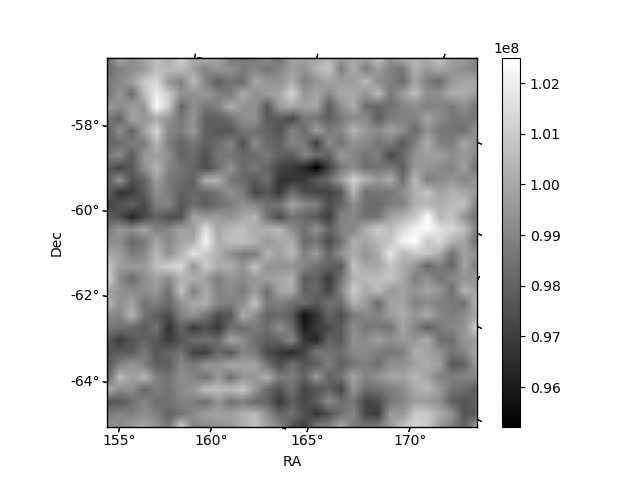
Quadrant B |
|---|---|---|---|
| Quadrant D | 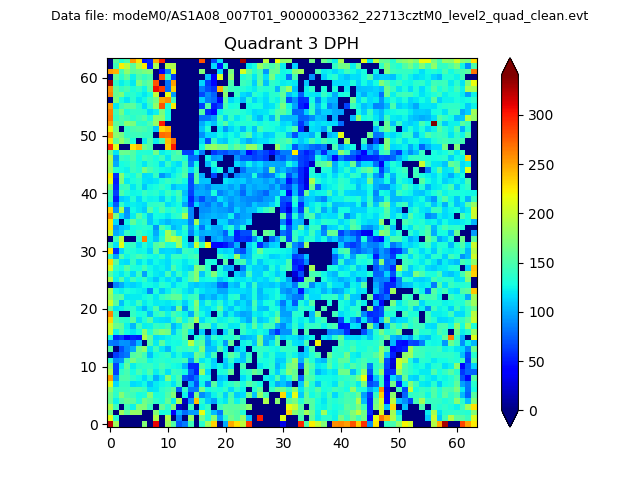 |
 |
Quadrant C |
| Plot type | Count rate plots | Images |
|---|---|---|
| Comparison with Poisson distribution Blue bars denote a histogram of data divided into 1 sec bins. Red curve is a Poisson curve with rate = median count rate of data. |
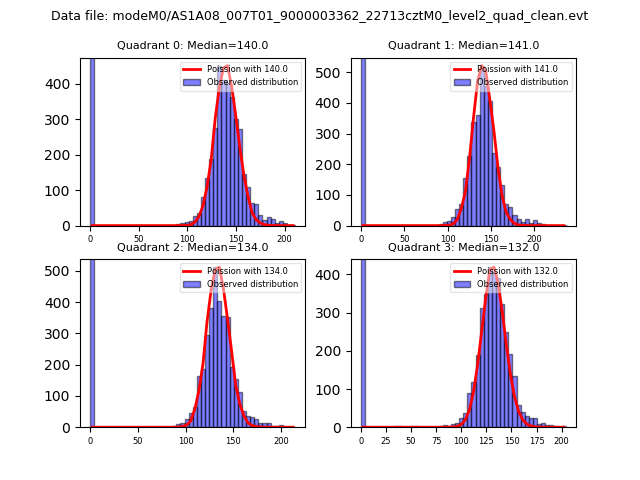 |
 |
| Quadrant-wise count rates Data is divided into 100 sec bins |
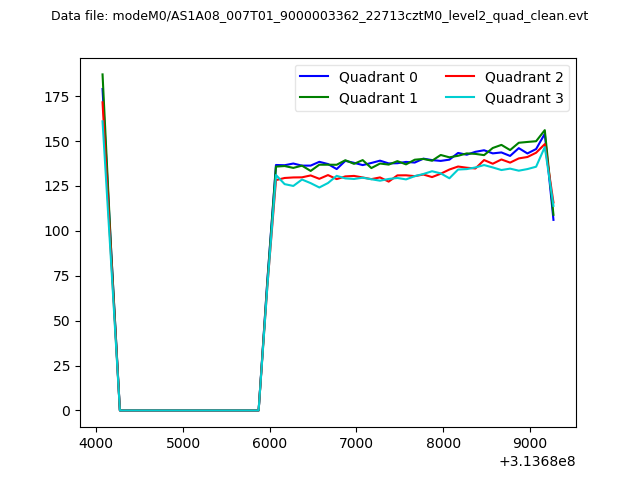 |
|
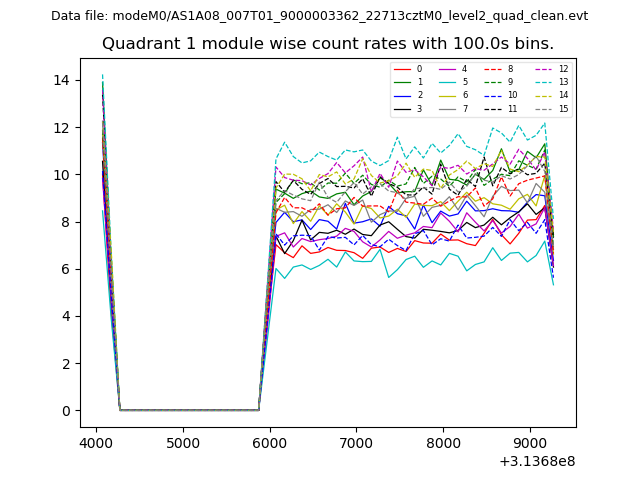
| Module-wise count rates for Quadrant A Data is divided into 100 sec bins |
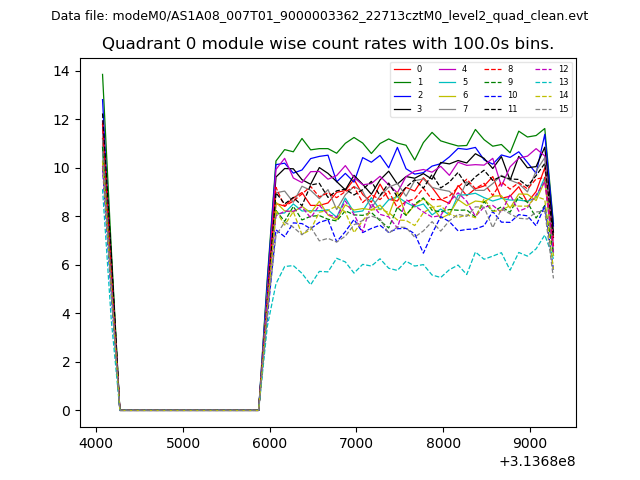 |
 |
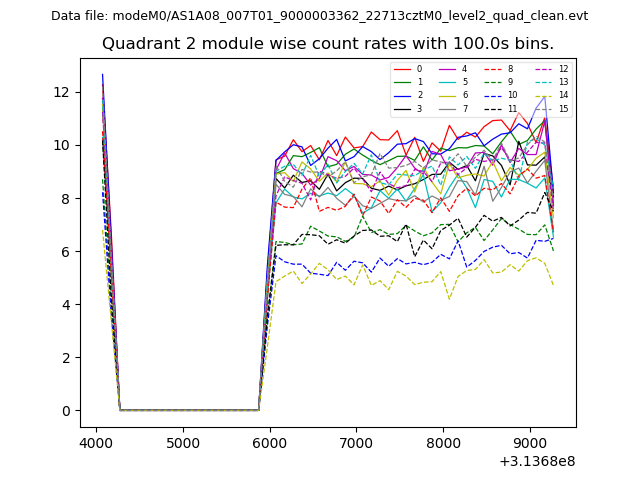
| Module-wise count rates for Quadrant B Data is divided into 100 sec bins |
 |
 |
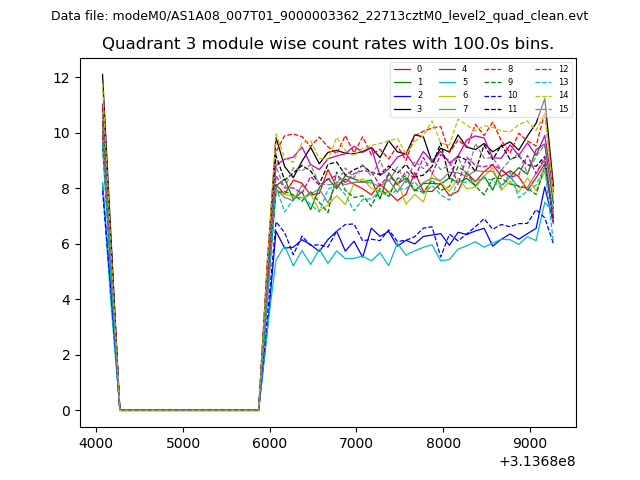
| Module-wise count rates for Quadrant C Data is divided into 100 sec bins |
 |
 |
| Module-wise count rates for Quadrant D Data is divided into 100 sec bins |
 |
 |
| Parameter | Plot |
|---|---|
| CZT HV Monitor | 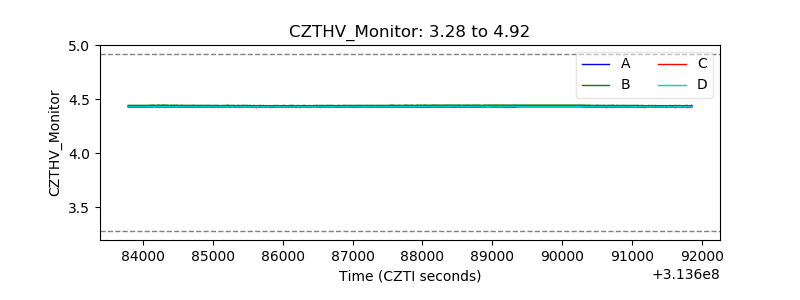 |
| D_VDD | 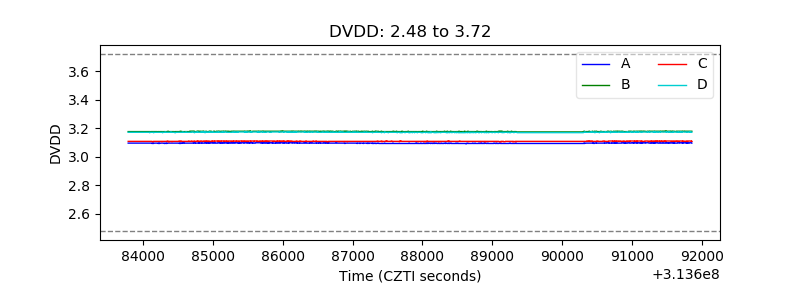 |
| Temperature 1 | 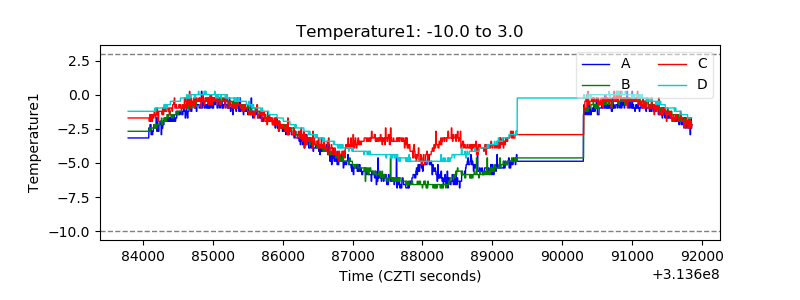 |
| Veto HV Monitor | 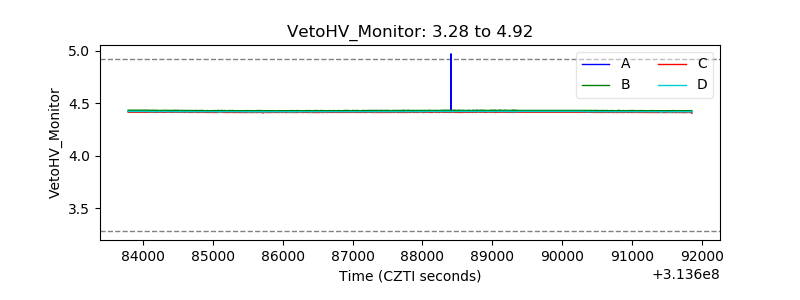 |
| Veto LLD | 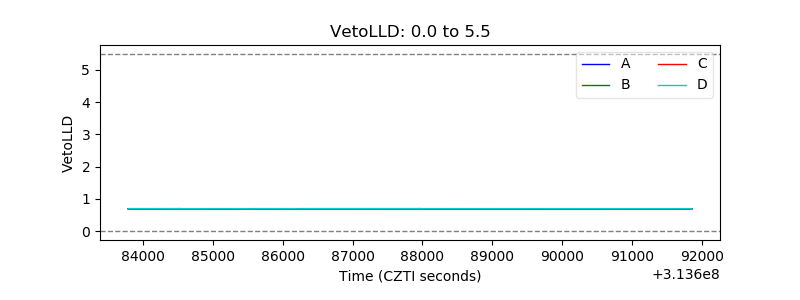 |
| Alpha Counter | 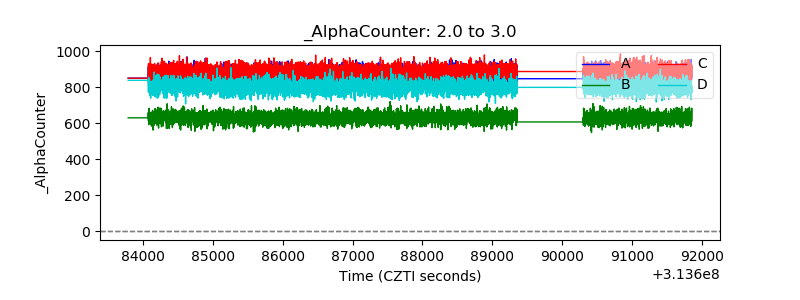 |
| _CPM_Rate | 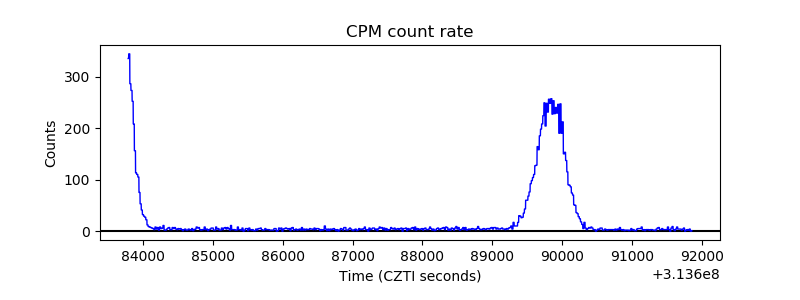 |
| CZT Counter | 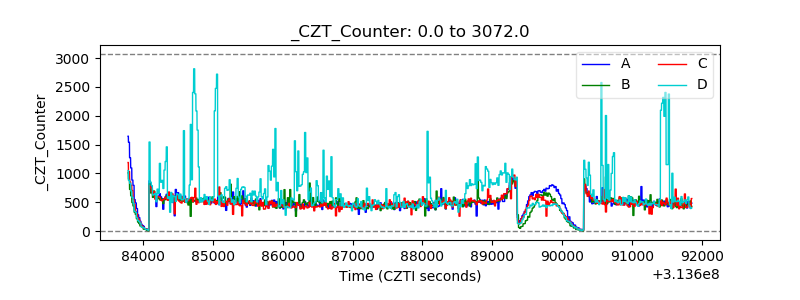 |
| +2.5 Volts monitor |  |
| +5 Volts monitor |  |
| _ROLL_ROT | 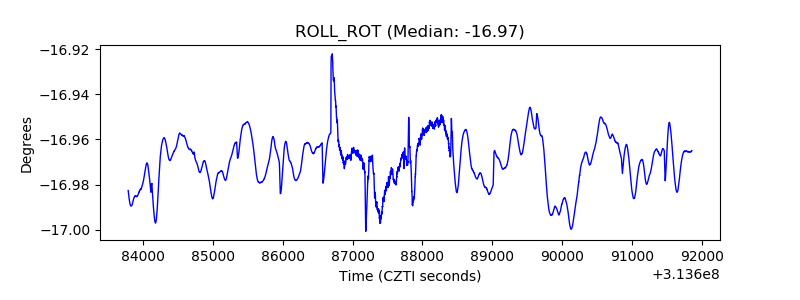 |
| _Roll_DEC | 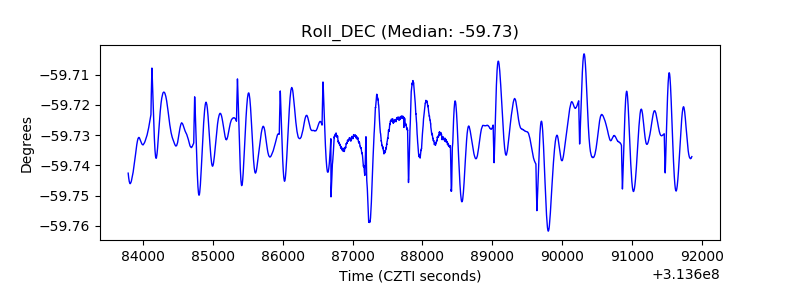 |
| _Roll_RA | 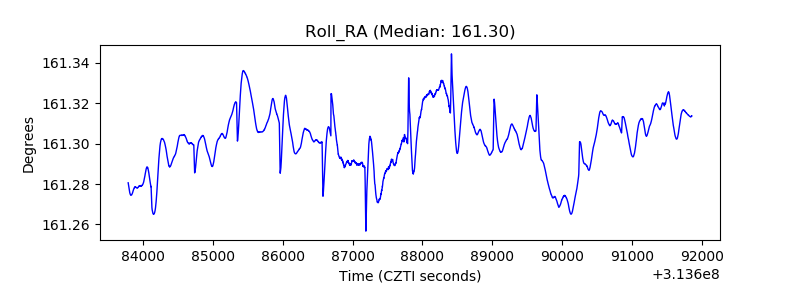 |
| Veto Counter | 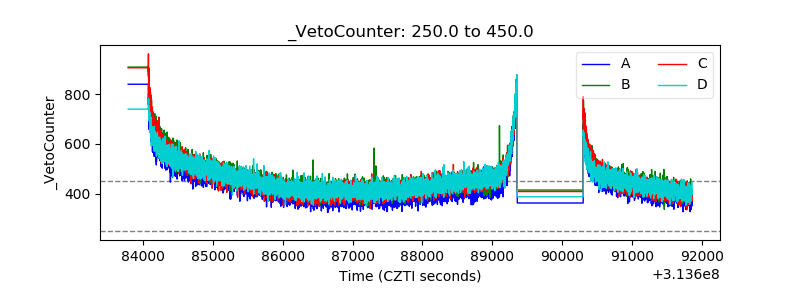 |