| Param | Original file | Final file |
|---|---|---|
| Filename | modeM0/AS1A08_007T01_9000003362_22714cztM0_level2.evt | modeM0/AS1A08_007T01_9000003362_22714cztM0_level2_quad_clean.evt |
| Size (bytes) | 517,754,880 | 91,272,960 |
| Size | 493.8 MB | 87.0 MB |
| Events in quadrant A | 3,445,043 | 580,852 |
| Events in quadrant B | 3,657,331 | 583,529 |
| Events in quadrant C | 3,437,283 | 555,629 |
| Events in quadrant D | 4,655,905 | 546,529 |
| Mode SS | |||
|---|---|---|---|
| Quadrant | BADHDUFLAG | Total packets | Discarded packets |
| A | 0 | 144 | 0 |
| B | 0 | 144 | 0 |
| C | 0 | 144 | 0 |
| D | 0 | 144 | 0 |
| Mode M0 | |||
|---|---|---|---|
| Quadrant | BADHDUFLAG | Total packets | Discarded packets |
| A | 0 | 14807 | 2 |
| B | 0 | 15323 | 2 |
| C | 0 | 14771 | 2 |
| D | 0 | 18511 | 2 |
| Mode M9 | |||
|---|---|---|---|
| Quadrant | BADHDUFLAG | Total packets | Discarded packets |
| A | 0 | 9 | 0 |
| B | 0 | 10 | 0 |
| C | 0 | 10 | 0 |
| D | 0 | 10 | 0 |
| Quadrant | Total seconds | Saturated seconds | Saturation percentage |
|---|---|---|---|
| A | 7148 | 75 | 1.049245% |
| B | 7148 | 82 | 1.147174% |
| C | 7147 | 70 | 0.979432% |
| D | 7147 | 161 | 2.252693% |
Noise dominated data is calculated using 1-second bins in cleaned event files. If a bin has >2000 counts, and if more than 50% of those come from <1% of pixels, then it is considered to be noise-dominated and hence unusable.
| Quadrant | # 1 sec bins | Bins with >0 counts | Bins with >2000 counts | High rate bins dominated by noise | Noise dominated (total time) | Noise dominated (detector-on time) | Marked lightcurve |
|---|---|---|---|---|---|---|---|
| A | 7728 | 7149 | 8 | 8 | 0.10% | 0.11% |  |
| B | 7728 | 7149 | 4 | 4 | 0.05% | 0.06% | 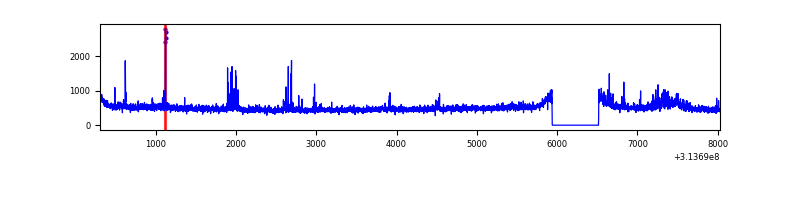 |
| C | 7727 | 7148 | 1 | 1 | 0.01% | 0.01% | 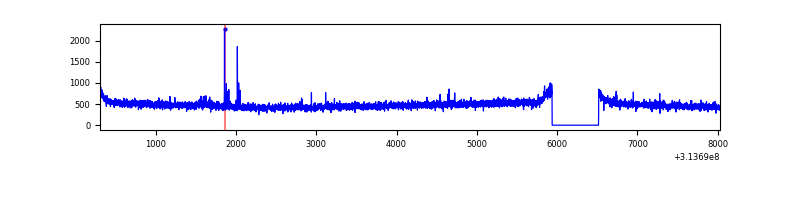 |
| D | 7727 | 7148 | 118 | 118 | 1.53% | 1.65% |  |
Top three noisy pixels from each quadrant. If the there are fewer than three noisy pixels in the level2.evt file, extra rows are filled as -1
| Pixel properties | Quadrant properties | ||||||
|---|---|---|---|---|---|---|---|
| Quadrant | DetID | PixID | Counts | Sigma | Mean | Median | Sigma |
| A | 4 | 208 | 20947 | 112.73 | 883 | 863 | 178.2 |
| A | 13 | 254 | 14015 | 73.82 | 883 | 863 | 178.2 |
| A | 13 | 170 | 8742 | 44.22 | 883 | 863 | 178.2 |
| B | 15 | 33 | 91191 | 547.19 | 879 | 860 | 165.1 |
| B | 0 | 245 | 69681 | 416.89 | 879 | 860 | 165.1 |
| B | 0 | 228 | 30466 | 179.34 | 879 | 860 | 165.1 |
| C | 14 | 238 | 132716 | 672.93 | 841 | 845 | 196.0 |
| C | 10 | 23 | 20842 | 102.04 | 841 | 845 | 196.0 |
| C | 10 | 22 | 6327 | 27.97 | 841 | 845 | 196.0 |
| D | 10 | 230 | 517166 | 2506.11 | 853 | 828 | 206.0 |
| D | 12 | 233 | 347812 | 1684.13 | 853 | 828 | 206.0 |
| D | 12 | 227 | 108513 | 522.66 | 853 | 828 | 206.0 |
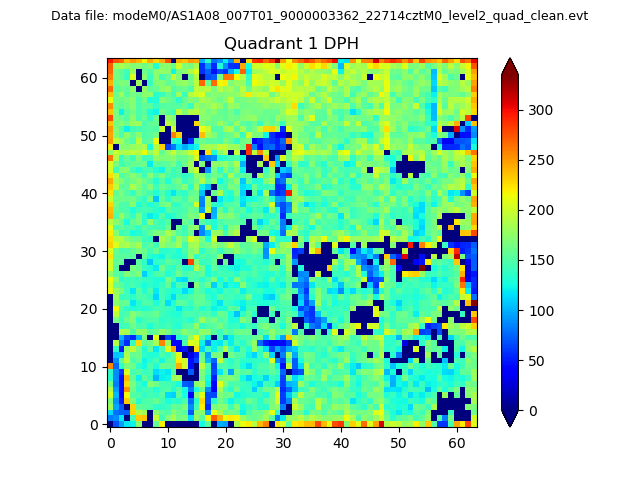
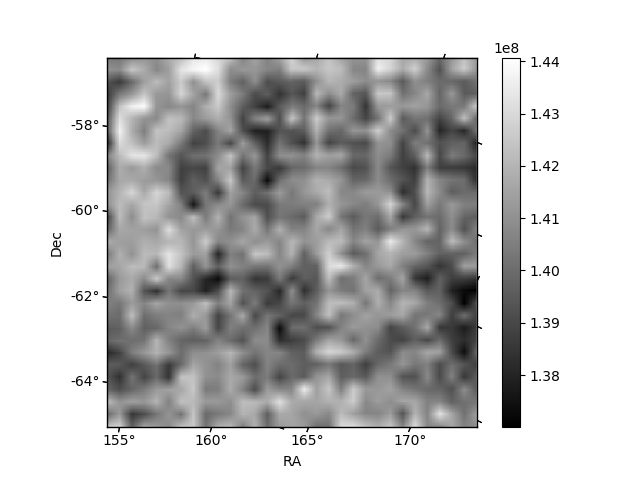
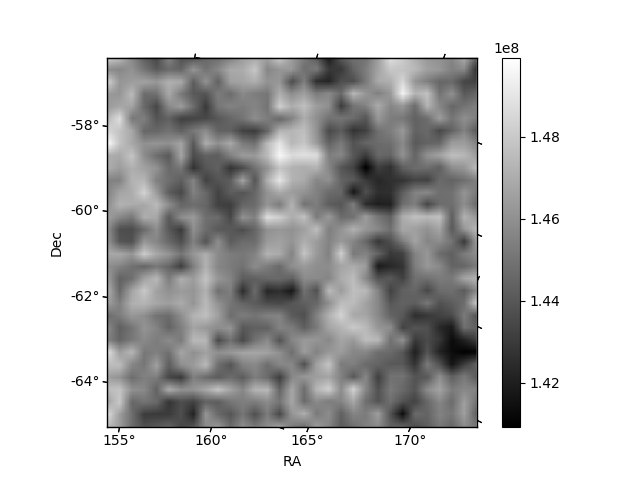
Histogram calculated using DETX and DETY for each event in the final _common_clean file
| Quadrant A |  |
 |
Quadrant B |
|---|---|---|---|
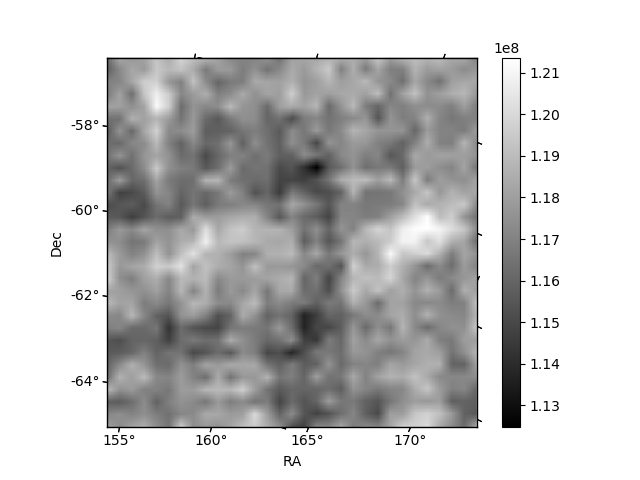
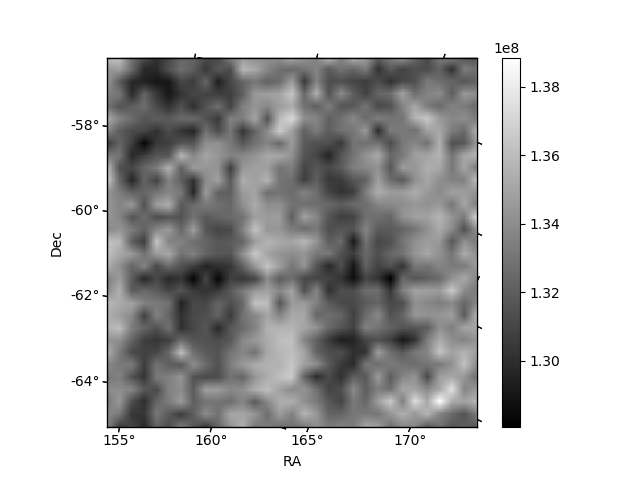
| Quadrant D | 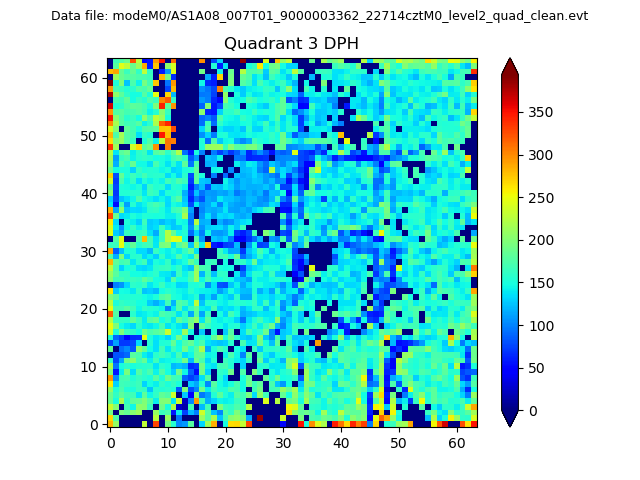 |
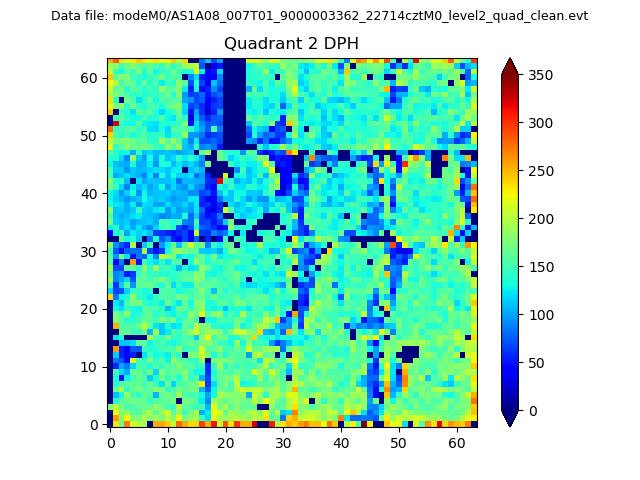 |
Quadrant C |
| Plot type | Count rate plots | Images |
|---|---|---|
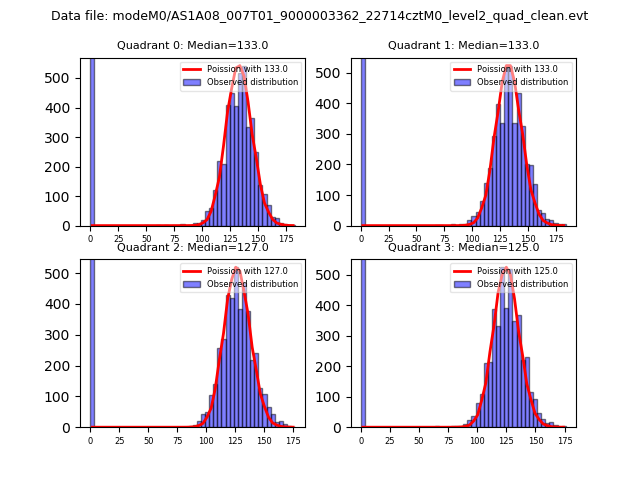
| Comparison with Poisson distribution Blue bars denote a histogram of data divided into 1 sec bins. Red curve is a Poisson curve with rate = median count rate of data. |
 |
 |
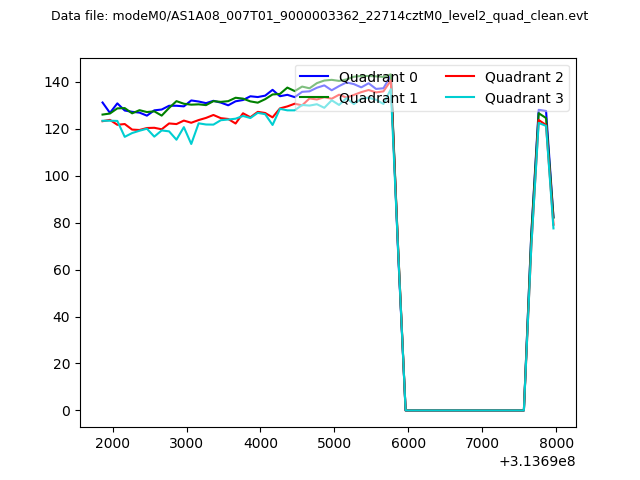
| Quadrant-wise count rates Data is divided into 100 sec bins |
 |
|
| Module-wise count rates for Quadrant A Data is divided into 100 sec bins |
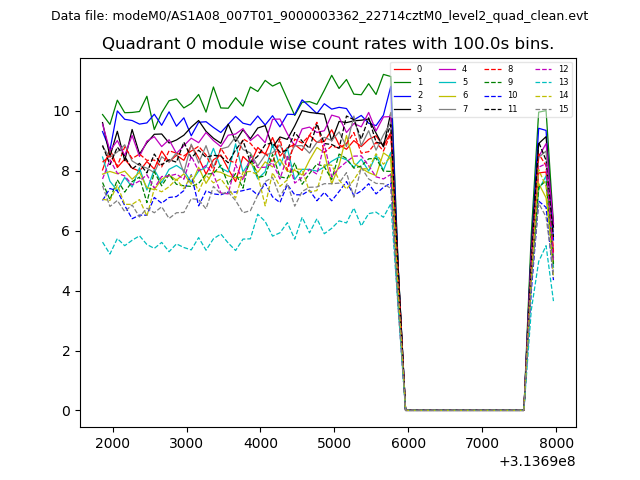 |
 |
| Module-wise count rates for Quadrant B Data is divided into 100 sec bins |
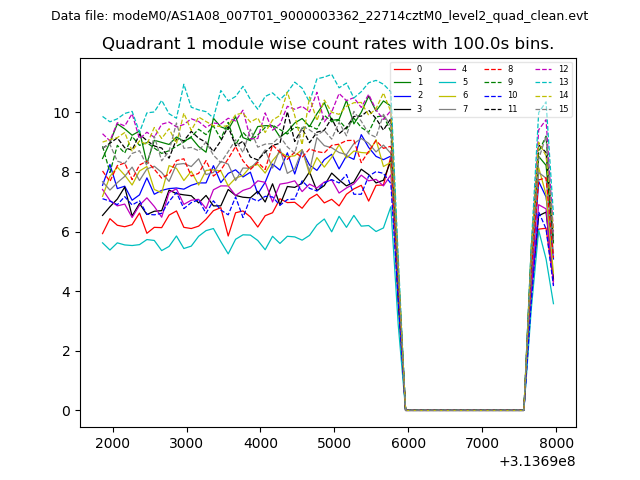 |
 |
| Module-wise count rates for Quadrant C Data is divided into 100 sec bins |
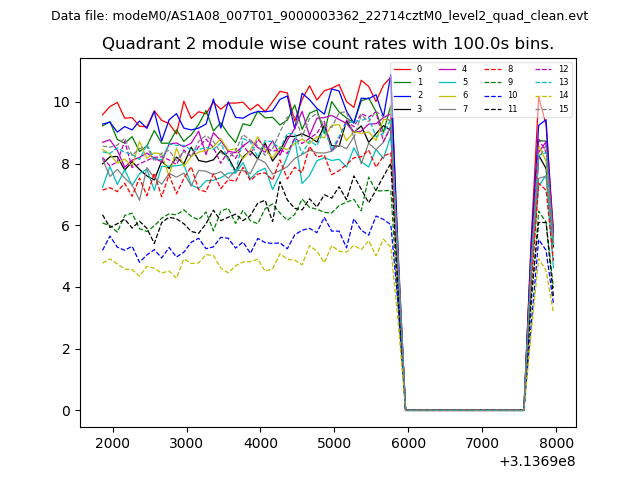 |
 |
| Module-wise count rates for Quadrant D Data is divided into 100 sec bins |
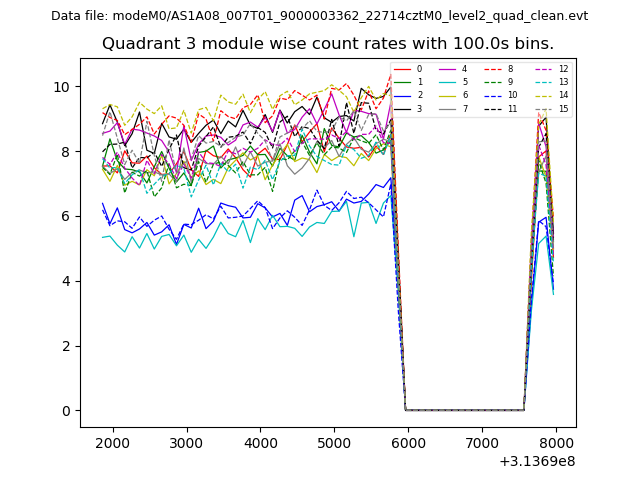 |
 |
| Parameter | Plot |
|---|---|
| CZT HV Monitor | 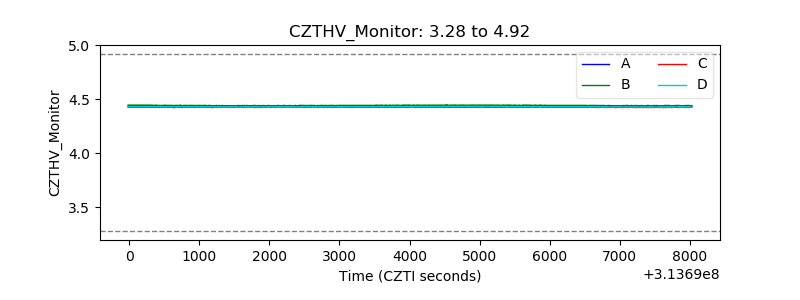 |
| D_VDD | 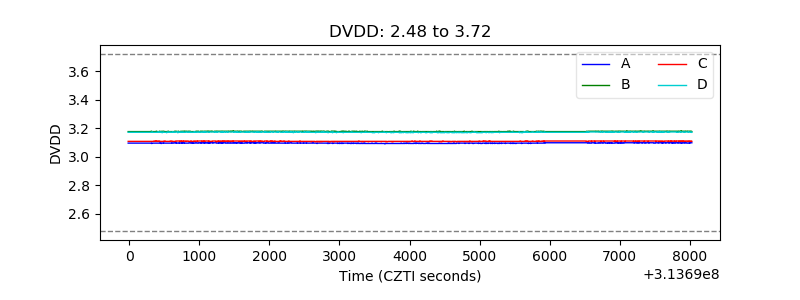 |
| Temperature 1 | 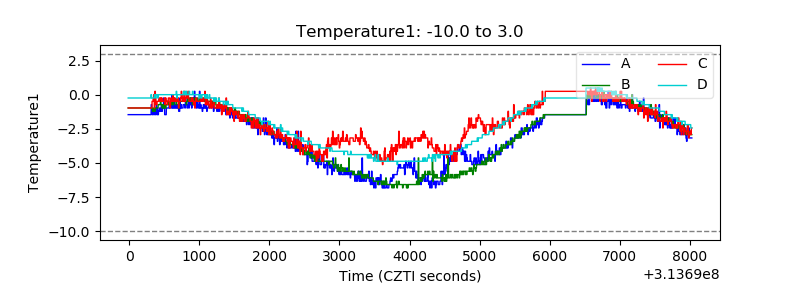 |
| Veto HV Monitor | 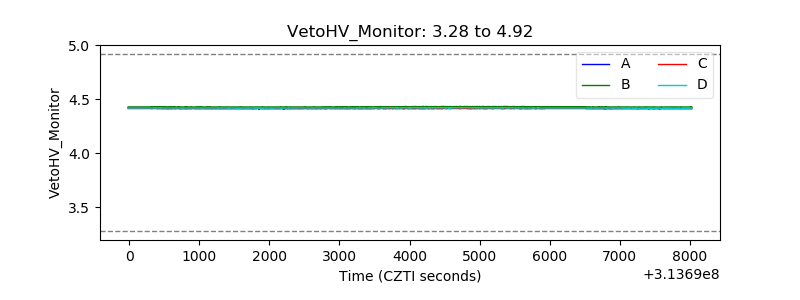 |
| Veto LLD | 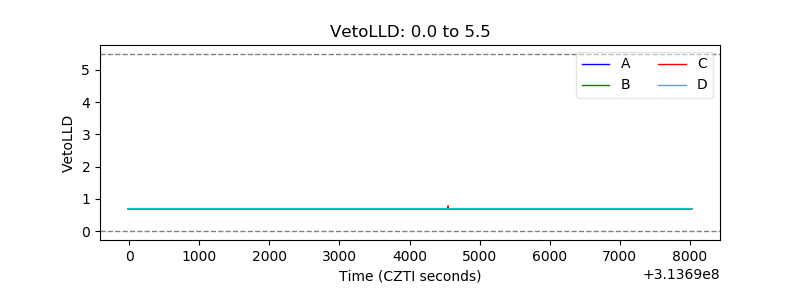 |
| Alpha Counter | 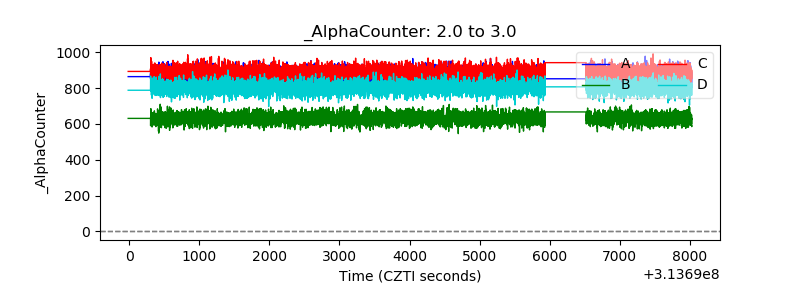 |
| _CPM_Rate | 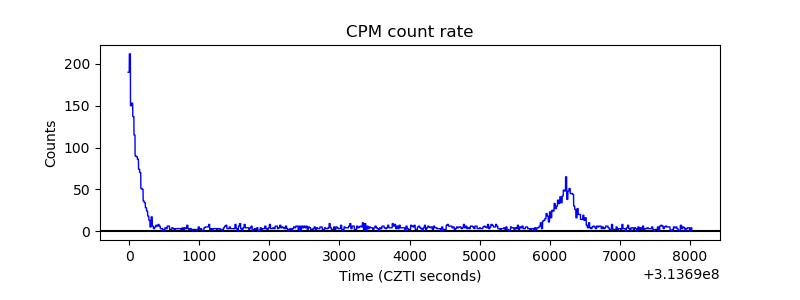 |
| CZT Counter | 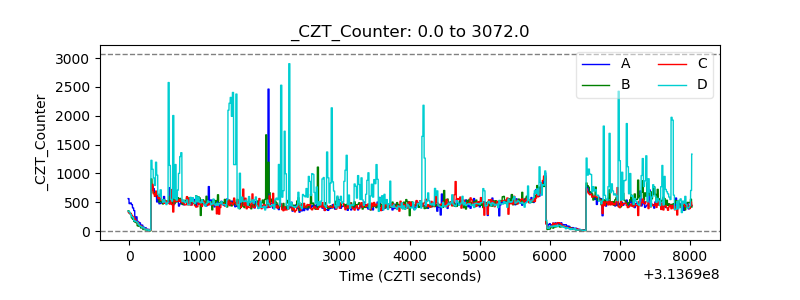 |
| +2.5 Volts monitor |  |
| +5 Volts monitor |  |
| _ROLL_ROT | 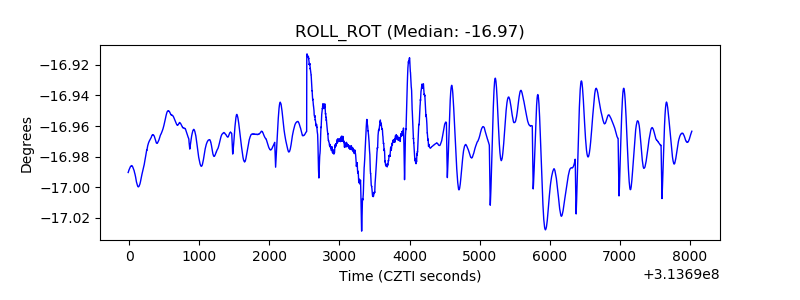 |
| _Roll_DEC | 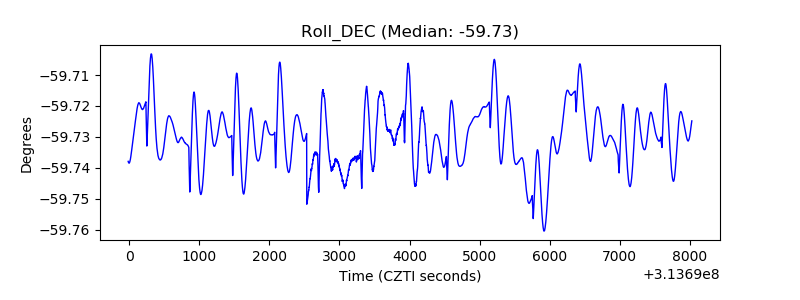 |
| _Roll_RA | 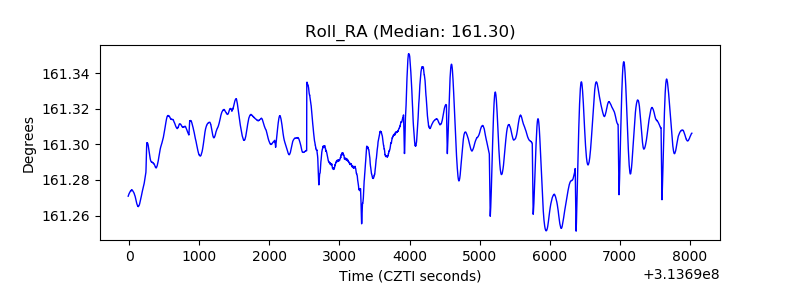 |
| Veto Counter | 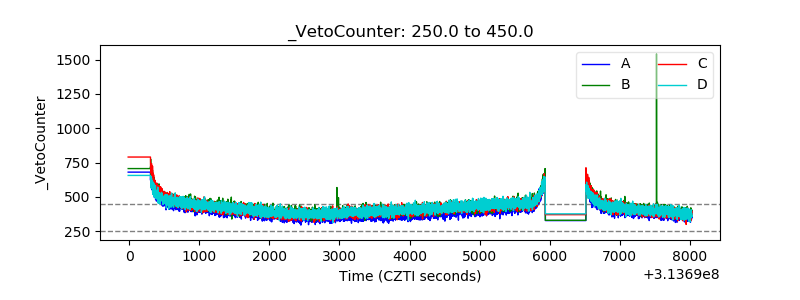 |