| Param | Original file | Final file |
|---|---|---|
| Filename | modeM0/AS1A08_007T01_9000003362_22715cztM0_level2.evt | modeM0/AS1A08_007T01_9000003362_22715cztM0_level2_quad_clean.evt |
| Size (bytes) | 534,902,400 | 93,991,680 |
| Size | 510.1 MB | 89.6 MB |
| Events in quadrant A | 3,492,913 | 598,959 |
| Events in quadrant B | 3,724,301 | 600,143 |
| Events in quadrant C | 3,509,704 | 575,319 |
| Events in quadrant D | 4,972,068 | 558,524 |
| Mode SS | |||
|---|---|---|---|
| Quadrant | BADHDUFLAG | Total packets | Discarded packets |
| A | 0 | 148 | 0 |
| B | 0 | 148 | 0 |
| C | 0 | 148 | 0 |
| D | 0 | 148 | 0 |
| Mode M0 | |||
|---|---|---|---|
| Quadrant | BADHDUFLAG | Total packets | Discarded packets |
| A | 0 | 15188 | 1 |
| B | 0 | 15746 | 1 |
| C | 0 | 15217 | 1 |
| D | 0 | 19743 | 1 |
| Mode M9 | |||
|---|---|---|---|
| Quadrant | BADHDUFLAG | Total packets | Discarded packets |
| A | 0 | 2 | 0 |
| B | 0 | 2 | 0 |
| C | 0 | 2 | 0 |
| D | 0 | 2 | 0 |
| Quadrant | Total seconds | Saturated seconds | Saturation percentage |
|---|---|---|---|
| A | 7380 | 78 | 1.056911% |
| B | 7381 | 108 | 1.463216% |
| C | 7381 | 88 | 1.192250% |
| D | 7381 | 314 | 4.254166% |
Noise dominated data is calculated using 1-second bins in cleaned event files. If a bin has >2000 counts, and if more than 50% of those come from <1% of pixels, then it is considered to be noise-dominated and hence unusable.
| Quadrant | # 1 sec bins | Bins with >0 counts | Bins with >2000 counts | High rate bins dominated by noise | Noise dominated (total time) | Noise dominated (detector-on time) | Marked lightcurve |
|---|---|---|---|---|---|---|---|
| A | 7585 | 7381 | 0 | 0 | 0.00% | 0.00% |  |
| B | 7586 | 7382 | 7 | 7 | 0.09% | 0.09% | 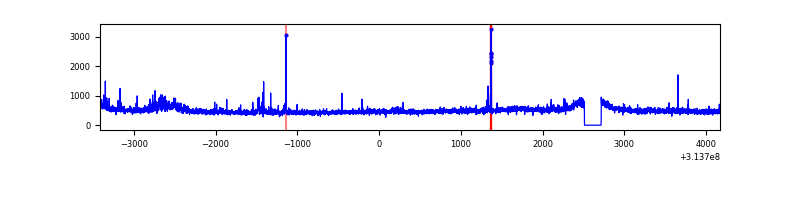 |
| C | 7586 | 7382 | 0 | 0 | 0.00% | 0.00% | 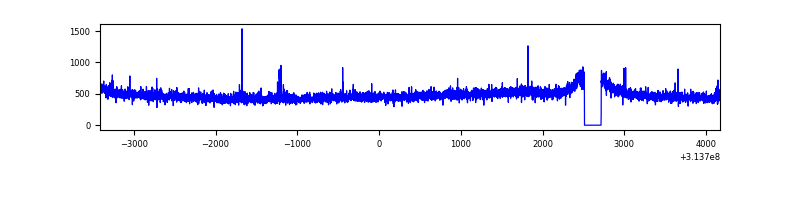 |
| D | 7586 | 7382 | 219 | 219 | 2.89% | 2.97% | 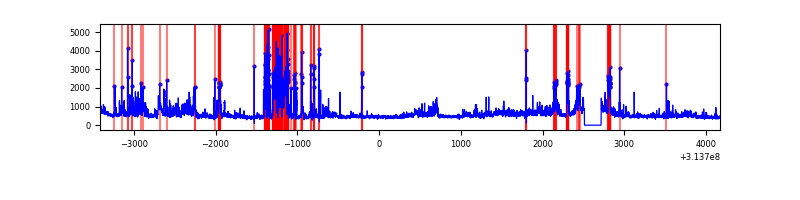 |
Top three noisy pixels from each quadrant. If the there are fewer than three noisy pixels in the level2.evt file, extra rows are filled as -1
| Pixel properties | Quadrant properties | ||||||
|---|---|---|---|---|---|---|---|
| Quadrant | DetID | PixID | Counts | Sigma | Mean | Median | Sigma |
| A | 13 | 254 | 14618 | 75.34 | 901 | 881 | 182.3 |
| A | 11 | 47 | 8536 | 41.98 | 901 | 881 | 182.3 |
| A | 0 | 226 | 7856 | 38.25 | 901 | 881 | 182.3 |
| B | 15 | 33 | 82154 | 478.34 | 897 | 874 | 169.9 |
| B | 0 | 245 | 32806 | 187.92 | 897 | 874 | 169.9 |
| B | 0 | 219 | 28165 | 160.61 | 897 | 874 | 169.9 |
| C | 14 | 238 | 133783 | 666.52 | 856 | 861 | 199.4 |
| C | 10 | 22 | 13186 | 61.8 | 856 | 861 | 199.4 |
| C | 10 | 23 | 10746 | 49.57 | 856 | 861 | 199.4 |
| D | 13 | 172 | 589851 | 2816.68 | 862 | 837 | 209.1 |
| D | 10 | 230 | 560248 | 2675.12 | 862 | 837 | 209.1 |
| D | 12 | 233 | 171894 | 818.0 | 862 | 837 | 209.1 |
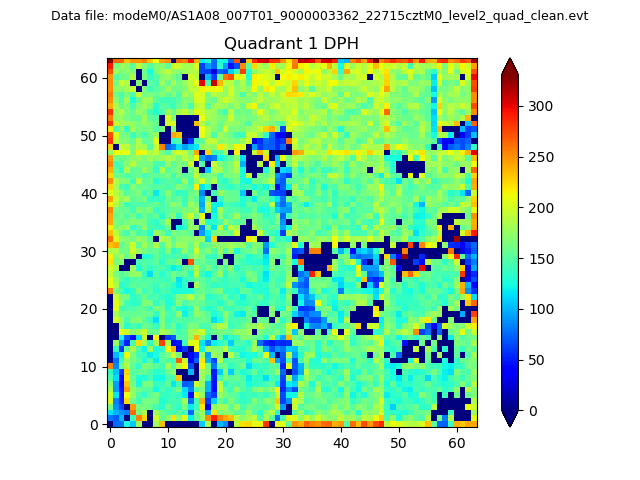
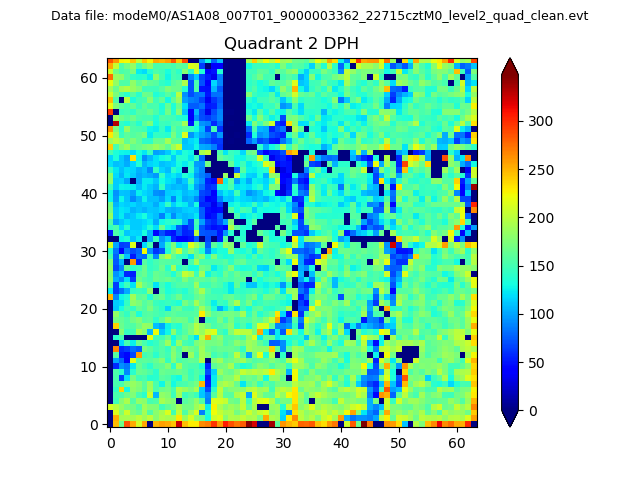
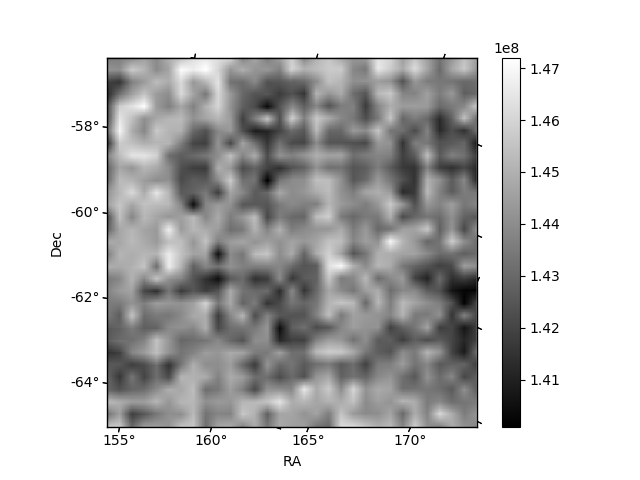
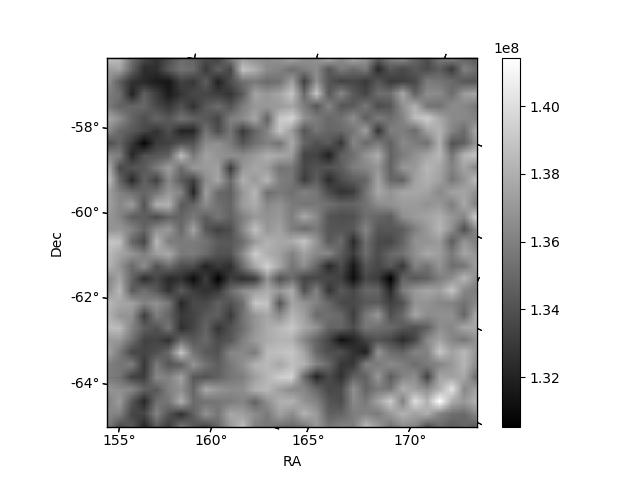
Histogram calculated using DETX and DETY for each event in the final _common_clean file
| Quadrant A | 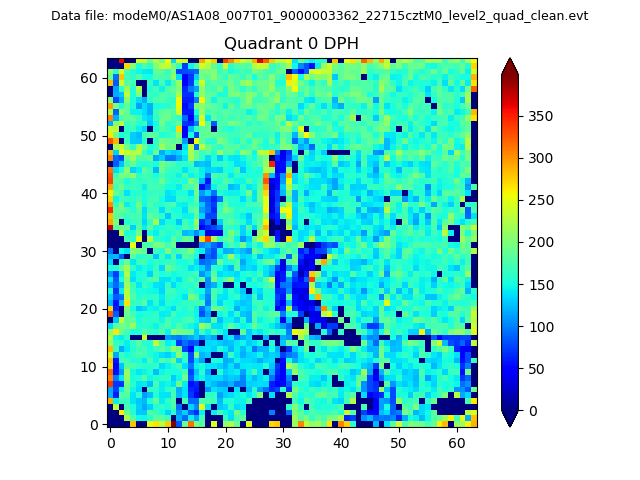 |
 |
Quadrant B |
|---|---|---|---|
| Quadrant D |  |
 |
Quadrant C |
| Plot type | Count rate plots | Images |
|---|---|---|
| Comparison with Poisson distribution Blue bars denote a histogram of data divided into 1 sec bins. Red curve is a Poisson curve with rate = median count rate of data. |
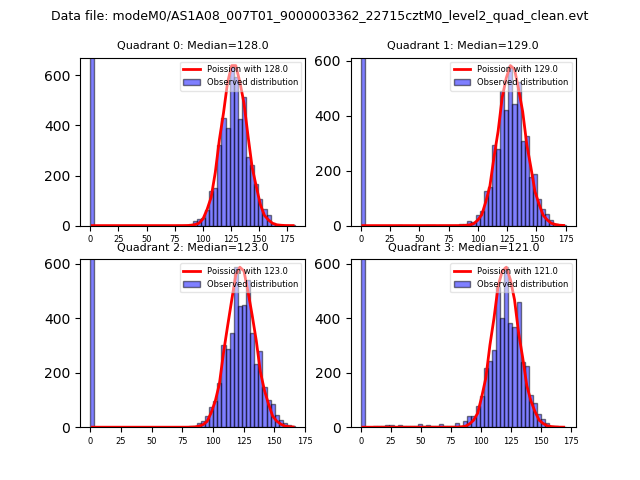 |
 |
| Quadrant-wise count rates Data is divided into 100 sec bins |
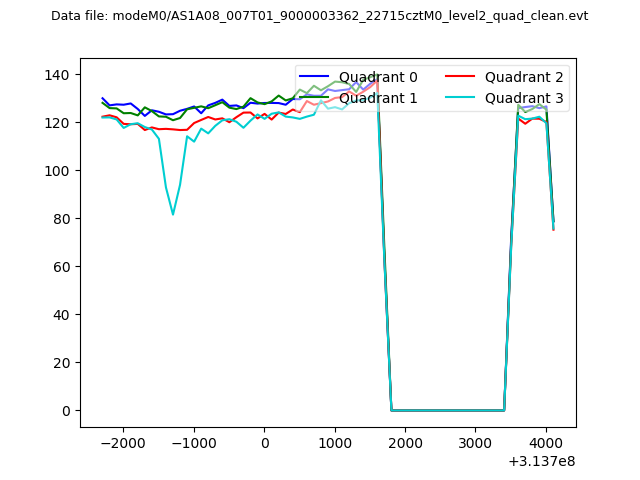 |
|
| Module-wise count rates for Quadrant A Data is divided into 100 sec bins |
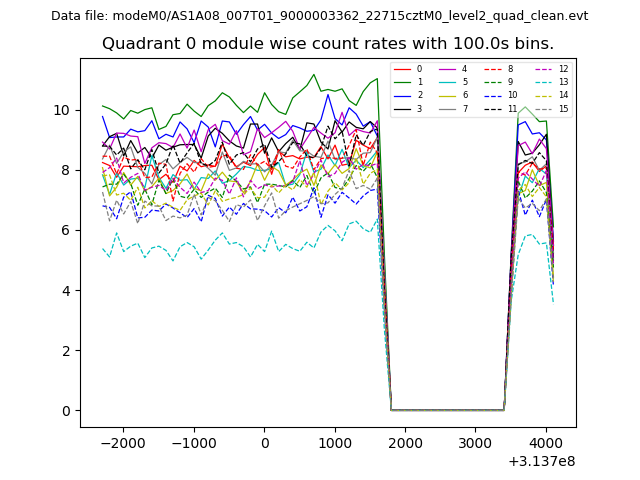 |
 |
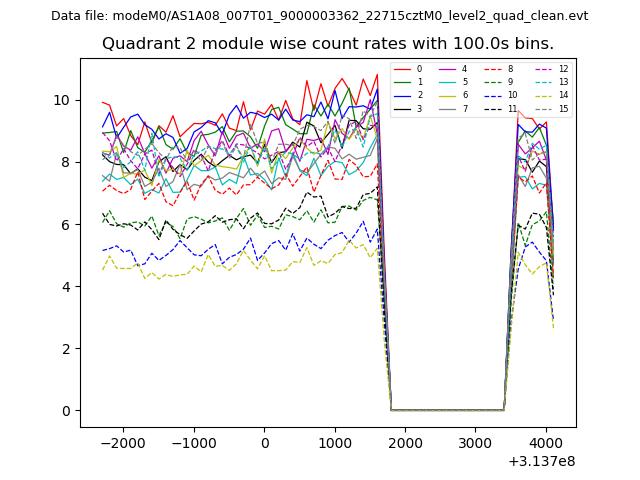
| Module-wise count rates for Quadrant B Data is divided into 100 sec bins |
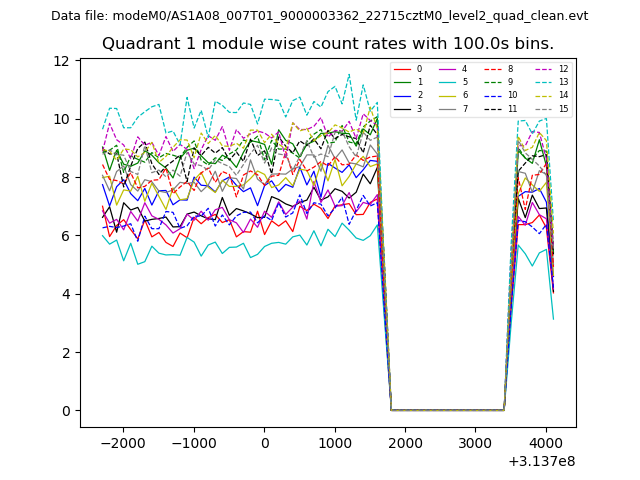 |
 |
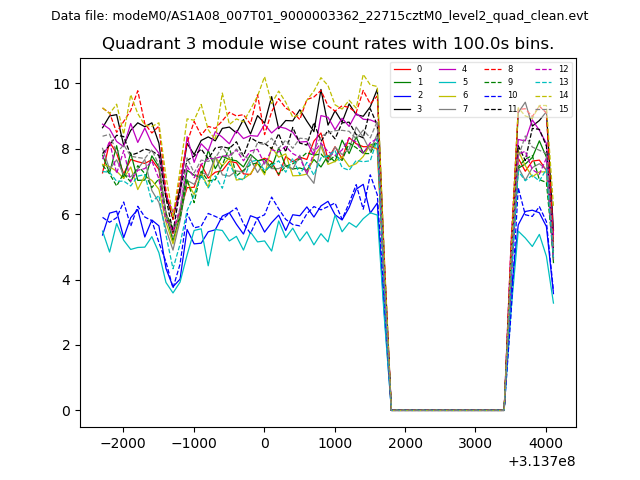
| Module-wise count rates for Quadrant C Data is divided into 100 sec bins |
 |
 |
| Module-wise count rates for Quadrant D Data is divided into 100 sec bins |
 |
 |
| Parameter | Plot |
|---|---|
| CZT HV Monitor | 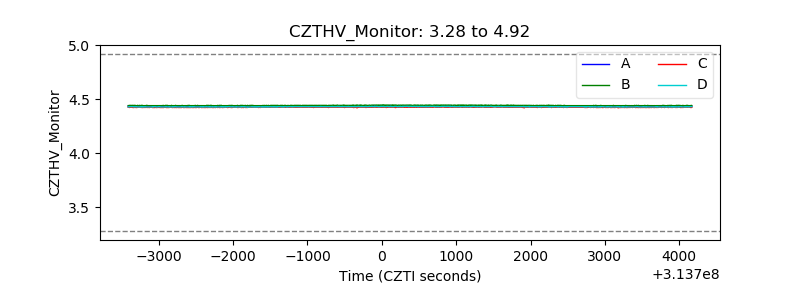 |
| D_VDD | 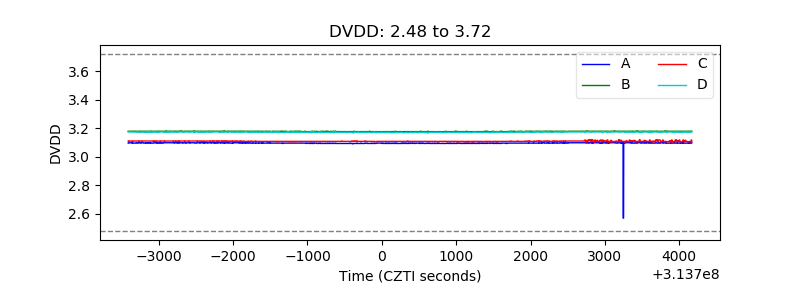 |
| Temperature 1 | 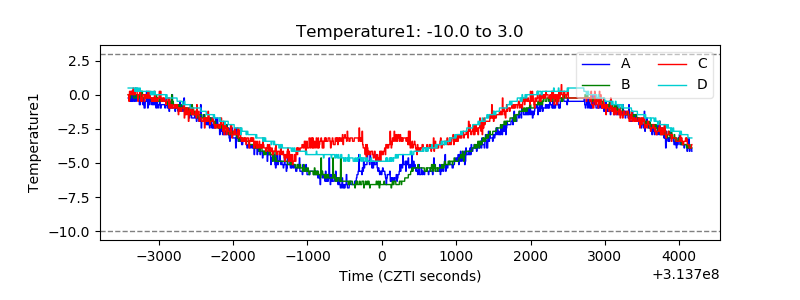 |
| Veto HV Monitor | 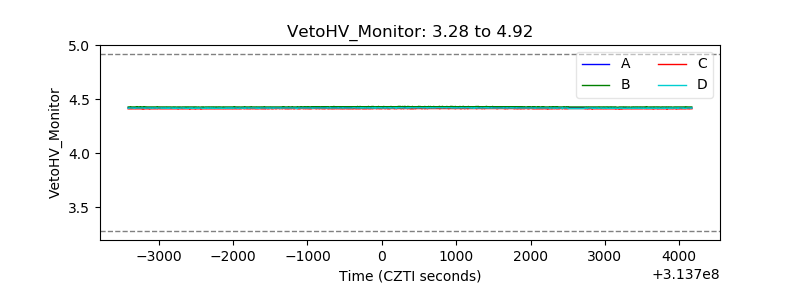 |
| Veto LLD |  |
| Alpha Counter | 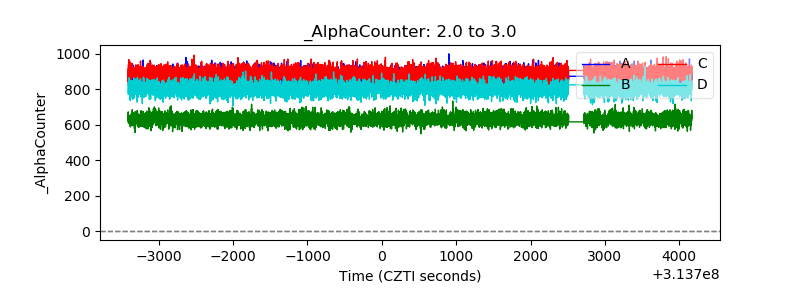 |
| _CPM_Rate | 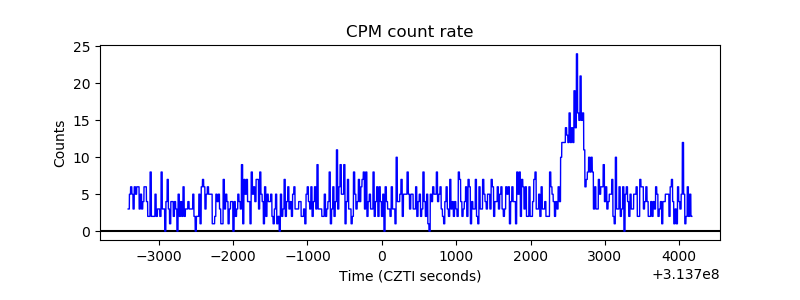 |
| CZT Counter | 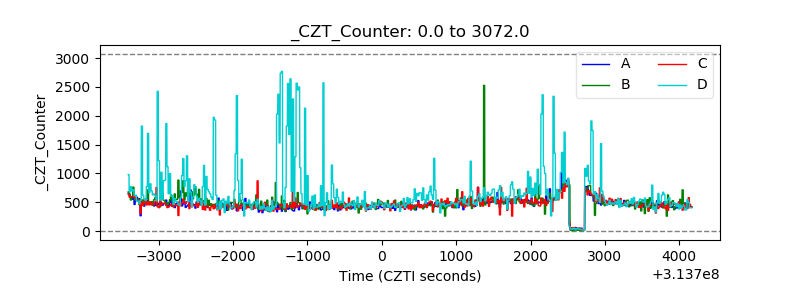 |
| +2.5 Volts monitor |  |
| +5 Volts monitor |  |
| _ROLL_ROT | 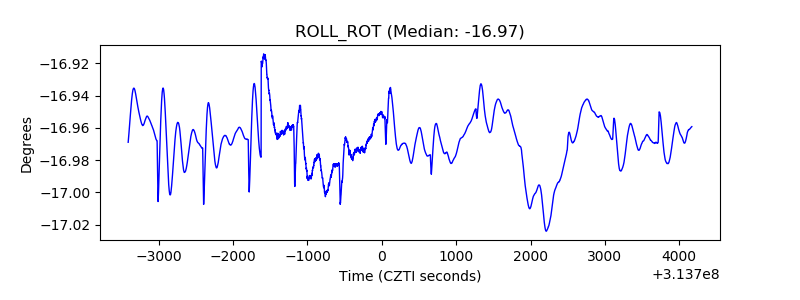 |
| _Roll_DEC | 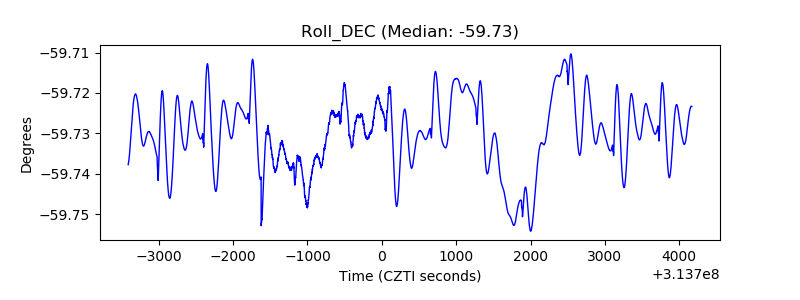 |
| _Roll_RA | 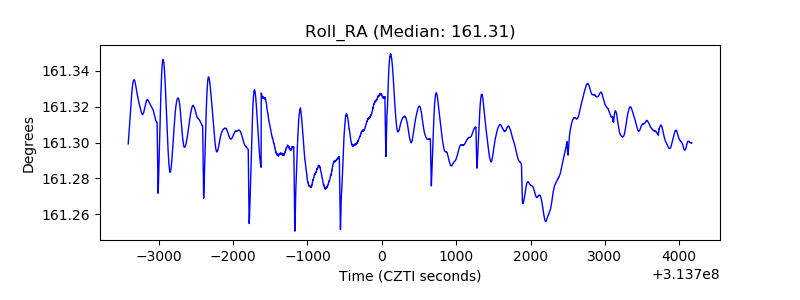 |
| Veto Counter | 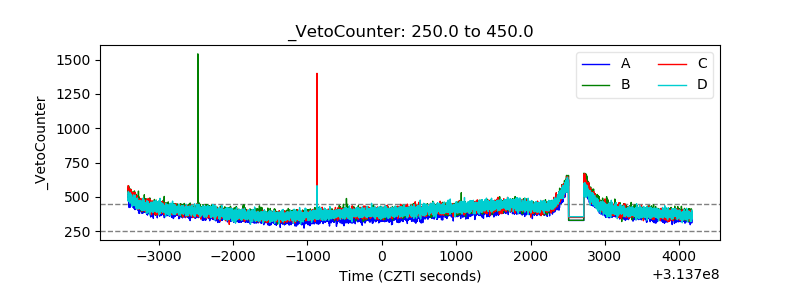 |