| Param | Original file | Final file |
|---|---|---|
| Filename | modeM0/AS1A08_007T01_9000003362_22716cztM0_level2.evt | modeM0/AS1A08_007T01_9000003362_22716cztM0_level2_quad_clean.evt |
| Size (bytes) | 512,300,160 | 103,795,200 |
| Size | 488.6 MB | 99.0 MB |
| Events in quadrant A | 3,566,600 | 668,394 |
| Events in quadrant B | 3,730,315 | 668,799 |
| Events in quadrant C | 3,612,480 | 640,655 |
| Events in quadrant D | 4,086,068 | 633,753 |
| Mode SS | |||
|---|---|---|---|
| Quadrant | BADHDUFLAG | Total packets | Discarded packets |
| A | 0 | 156 | 0 |
| B | 0 | 156 | 0 |
| C | 0 | 156 | 0 |
| D | 0 | 156 | 0 |
| Mode M0 | |||
|---|---|---|---|
| Quadrant | BADHDUFLAG | Total packets | Discarded packets |
| A | 0 | 15690 | 3 |
| B | 0 | 15968 | 3 |
| C | 0 | 15737 | 3 |
| D | 0 | 17354 | 3 |
| Mode M9 | |||
|---|---|---|---|
| Quadrant | BADHDUFLAG | Total packets | Discarded packets |
| A | 0 | 2 | 0 |
| B | 0 | 2 | 0 |
| C | 0 | 2 | 0 |
| D | 0 | 2 | 0 |
| Quadrant | Total seconds | Saturated seconds | Saturation percentage |
|---|---|---|---|
| A | 7644 | 88 | 1.151230% |
| B | 7643 | 108 | 1.413058% |
| C | 7643 | 121 | 1.583148% |
| D | 7643 | 174 | 2.276593% |
Noise dominated data is calculated using 1-second bins in cleaned event files. If a bin has >2000 counts, and if more than 50% of those come from <1% of pixels, then it is considered to be noise-dominated and hence unusable.
| Quadrant | # 1 sec bins | Bins with >0 counts | Bins with >2000 counts | High rate bins dominated by noise | Noise dominated (total time) | Noise dominated (detector-on time) | Marked lightcurve |
|---|---|---|---|---|---|---|---|
| A | 7884 | 7647 | 2 | 2 | 0.03% | 0.03% | 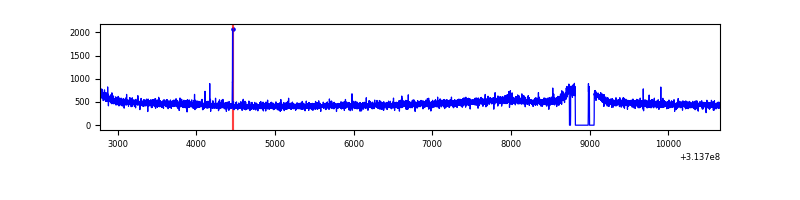 |
| B | 7883 | 7646 | 0 | 0 | 0.00% | 0.00% | 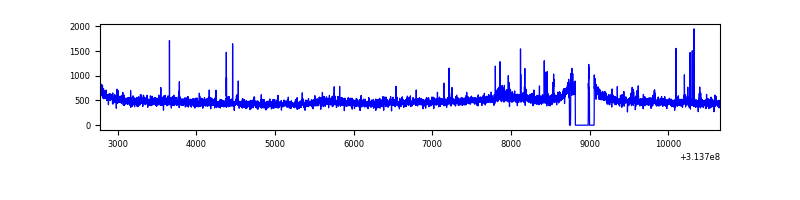 |
| C | 7883 | 7646 | 2 | 2 | 0.03% | 0.03% | 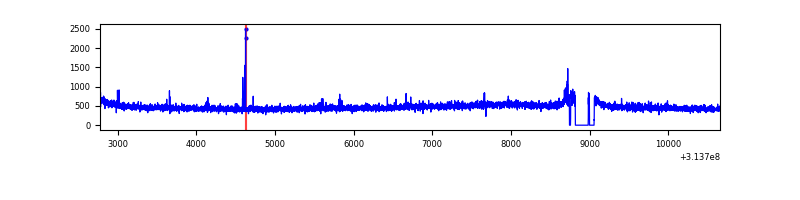 |
| D | 7883 | 7646 | 78 | 78 | 0.99% | 1.02% | 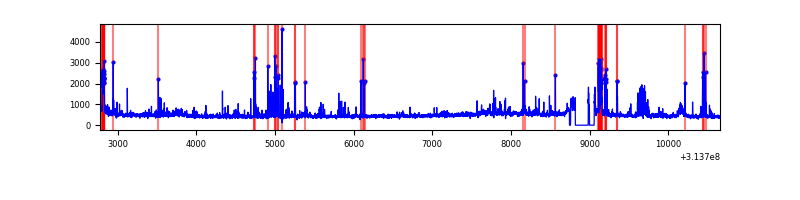 |
Top three noisy pixels from each quadrant. If the there are fewer than three noisy pixels in the level2.evt file, extra rows are filled as -1
| Pixel properties | Quadrant properties | ||||||
|---|---|---|---|---|---|---|---|
| Quadrant | DetID | PixID | Counts | Sigma | Mean | Median | Sigma |
| A | 13 | 254 | 14837 | 74.89 | 921 | 899 | 186.1 |
| A | 0 | 226 | 8051 | 38.43 | 921 | 899 | 186.1 |
| A | 3 | 137 | 7625 | 36.14 | 921 | 899 | 186.1 |
| B | 0 | 219 | 36007 | 202.67 | 918 | 895 | 173.2 |
| B | 0 | 190 | 23943 | 133.04 | 918 | 895 | 173.2 |
| B | 0 | 197 | 23619 | 131.17 | 918 | 895 | 173.2 |
| C | 14 | 238 | 136418 | 660.5 | 876 | 880 | 205.2 |
| C | 10 | 23 | 22187 | 103.83 | 876 | 880 | 205.2 |
| C | 10 | 22 | 18174 | 84.28 | 876 | 880 | 205.2 |
| D | 12 | 233 | 209447 | 972.61 | 885 | 858 | 214.5 |
| D | 1 | 52 | 144750 | 670.94 | 885 | 858 | 214.5 |
| D | 12 | 227 | 86317 | 398.48 | 885 | 858 | 214.5 |
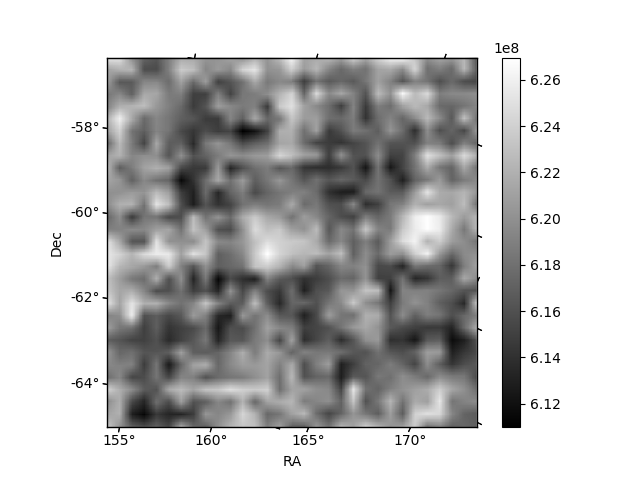
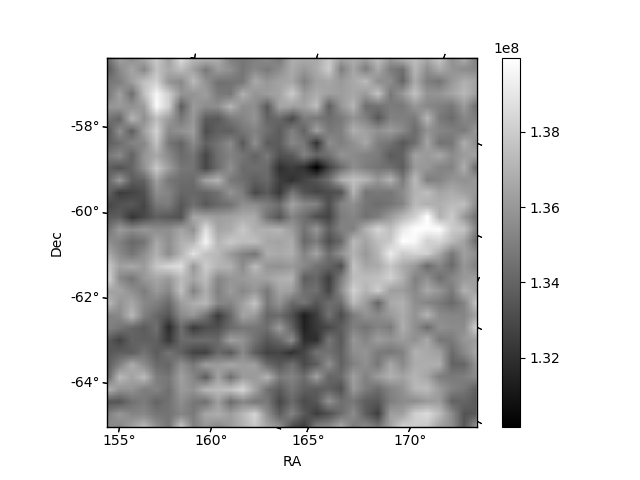
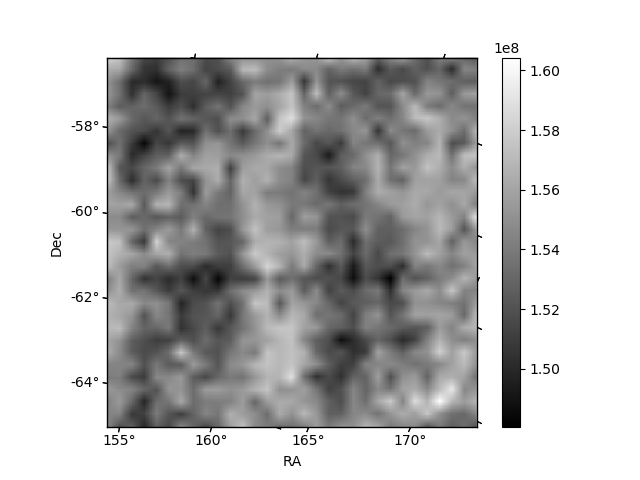
Histogram calculated using DETX and DETY for each event in the final _common_clean file
| Quadrant A | 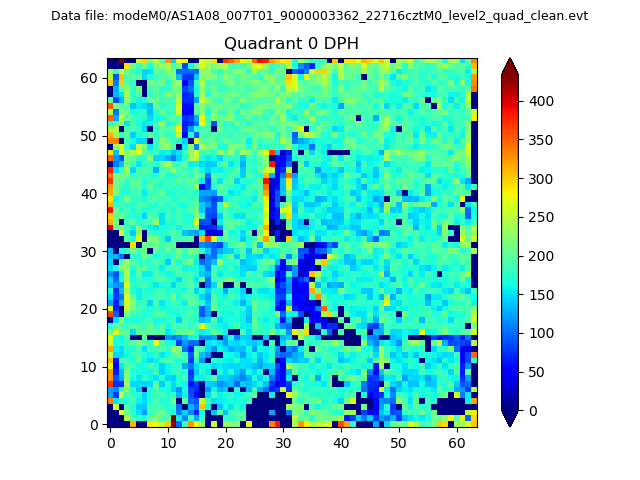 |
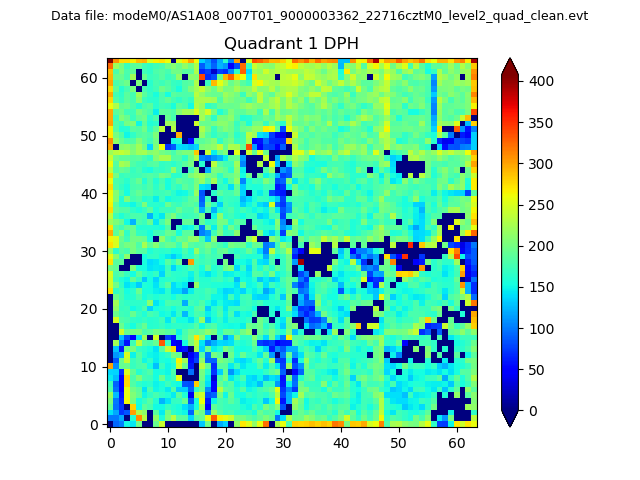 |
Quadrant B |
|---|---|---|---|
| Quadrant D | 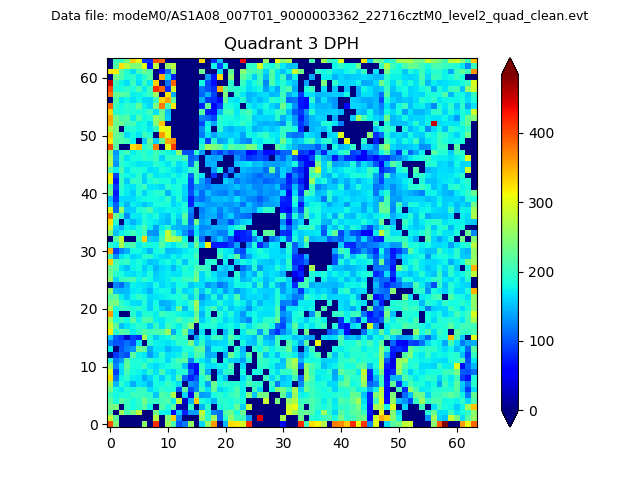 |
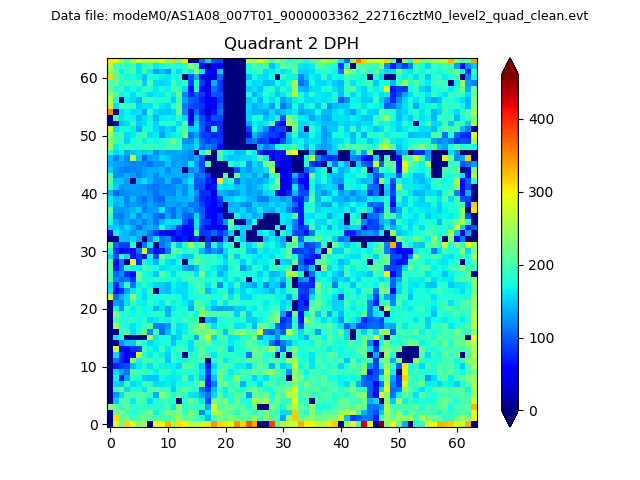 |
Quadrant C |
| Plot type | Count rate plots | Images |
|---|---|---|
| Comparison with Poisson distribution Blue bars denote a histogram of data divided into 1 sec bins. Red curve is a Poisson curve with rate = median count rate of data. |
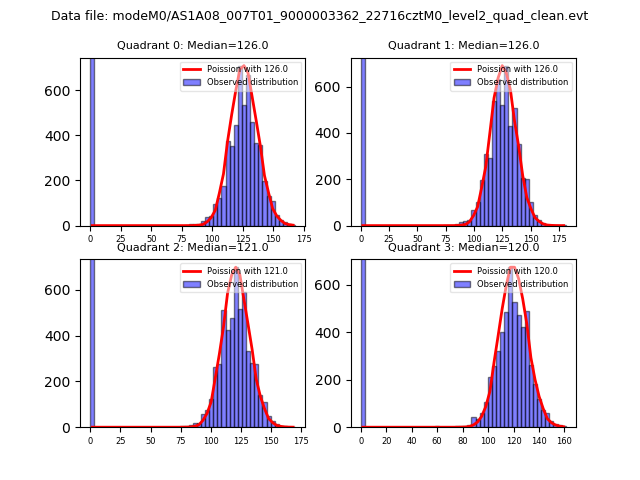 |
 |
| Quadrant-wise count rates Data is divided into 100 sec bins |
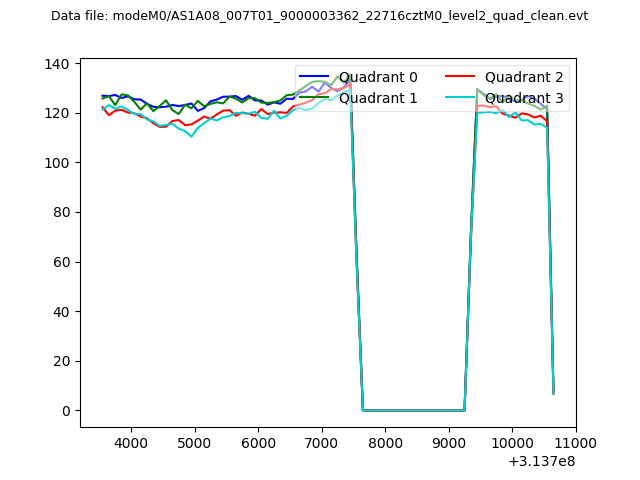 |
|
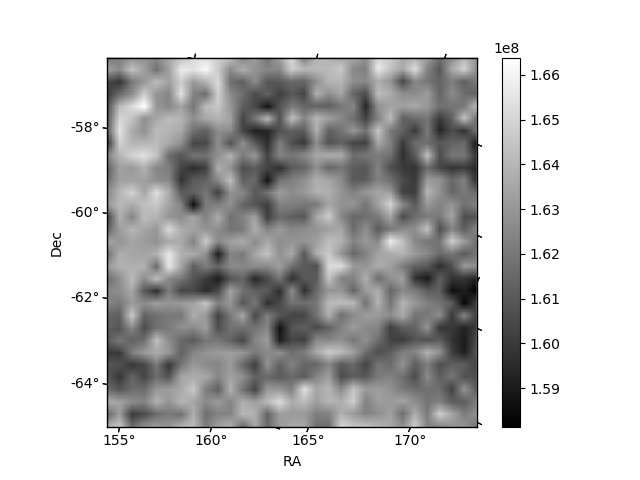
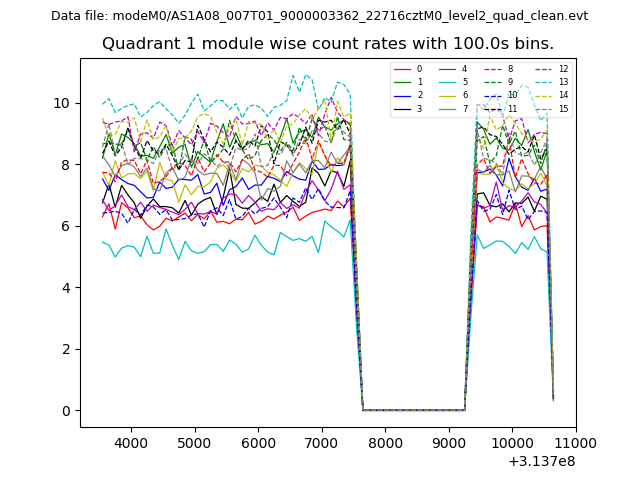
| Module-wise count rates for Quadrant A Data is divided into 100 sec bins |
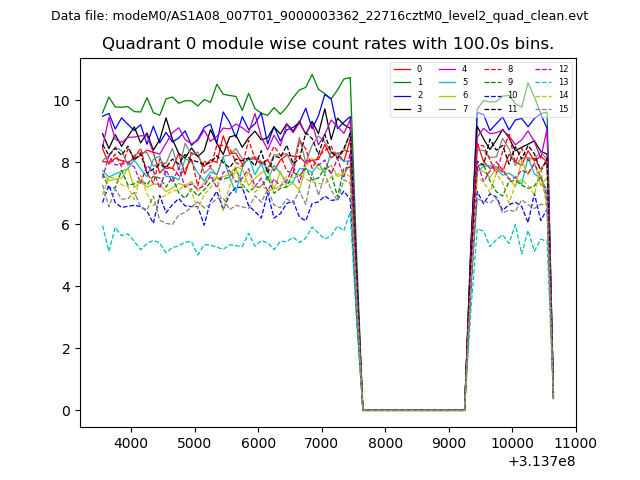 |
 |
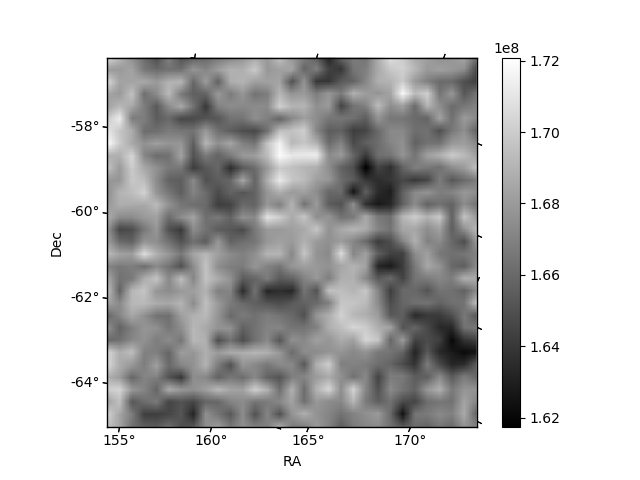
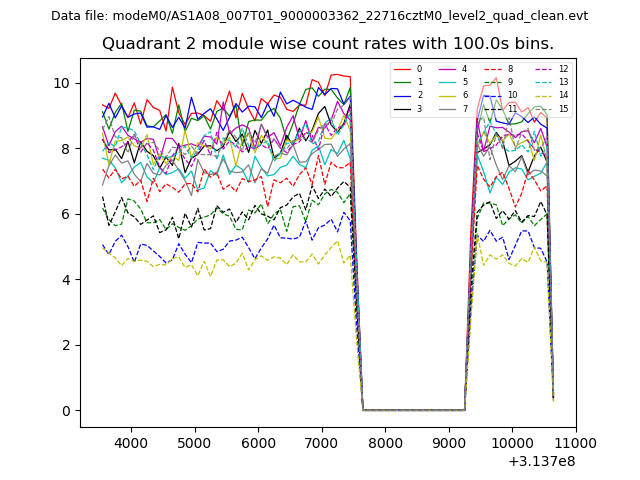
| Module-wise count rates for Quadrant B Data is divided into 100 sec bins |
 |
 |
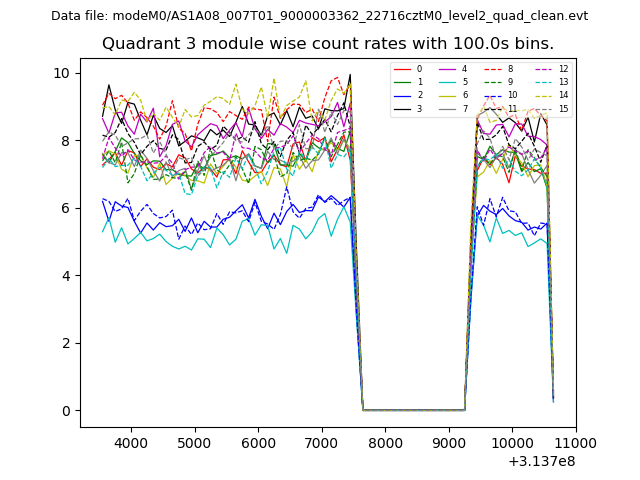
| Module-wise count rates for Quadrant C Data is divided into 100 sec bins |
 |
 |
| Module-wise count rates for Quadrant D Data is divided into 100 sec bins |
 |
 |
| Parameter | Plot |
|---|---|
| CZT HV Monitor | 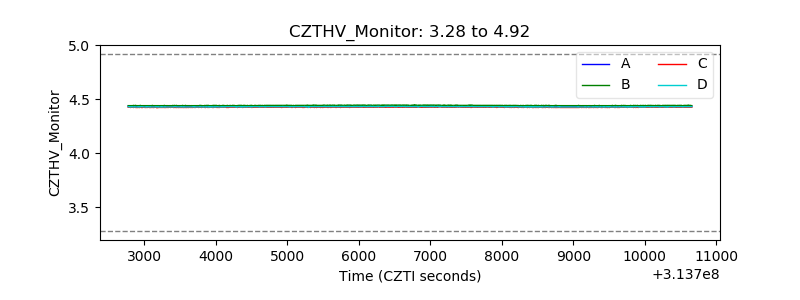 |
| D_VDD | 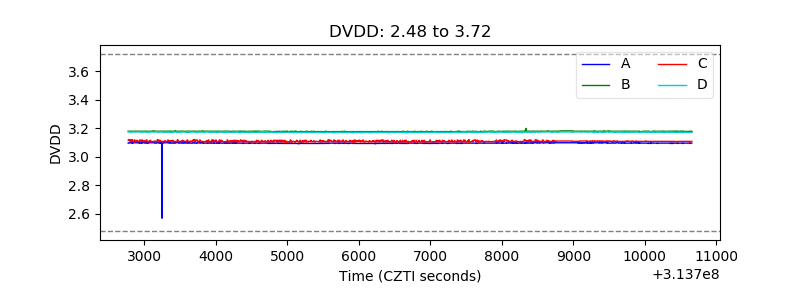 |
| Temperature 1 | 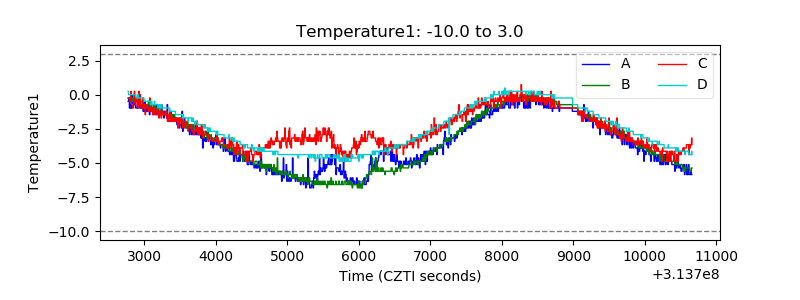 |
| Veto HV Monitor | 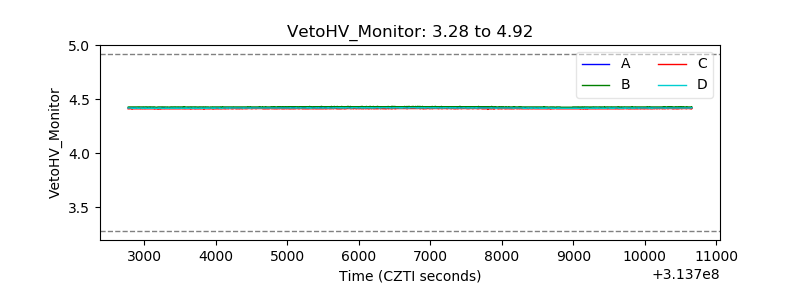 |
| Veto LLD | 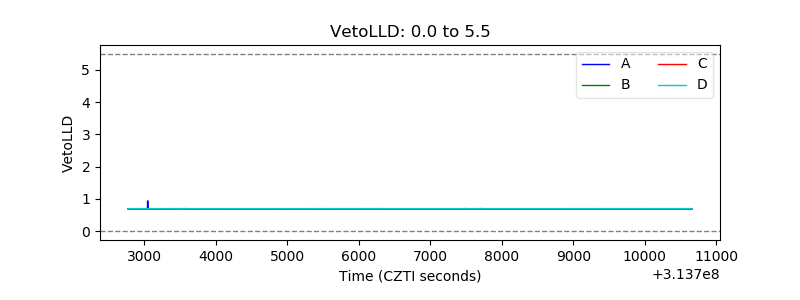 |
| Alpha Counter | 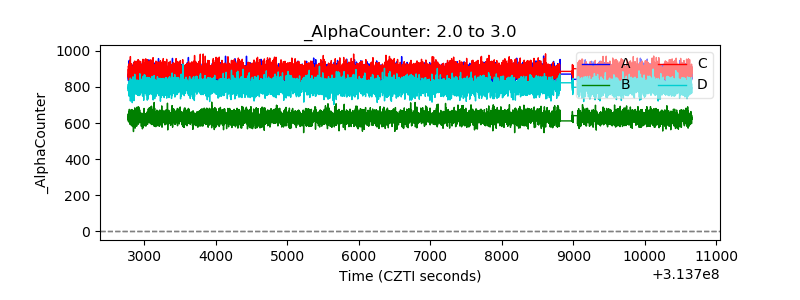 |
| _CPM_Rate | 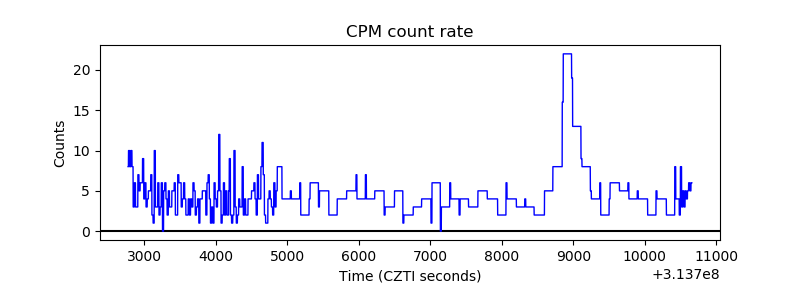 |
| CZT Counter | 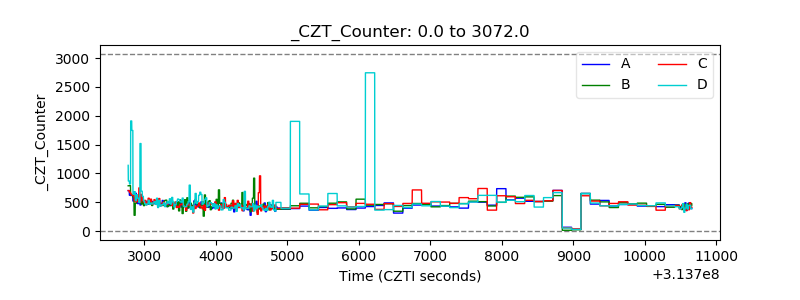 |
| +2.5 Volts monitor | 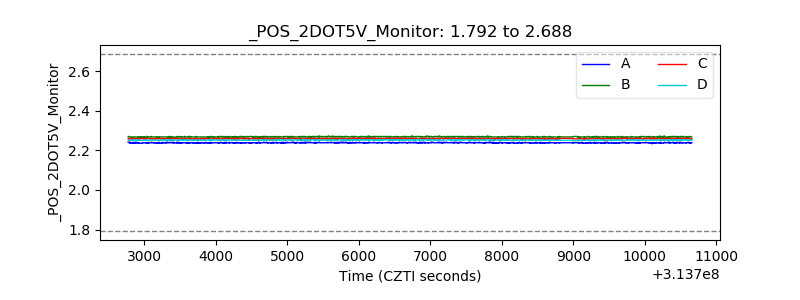 |
| +5 Volts monitor |  |
| _ROLL_ROT | 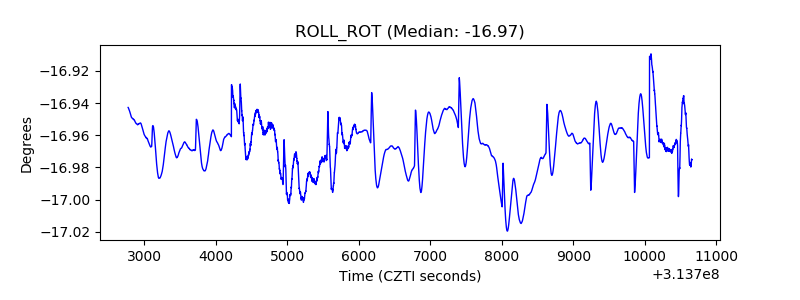 |
| _Roll_DEC | 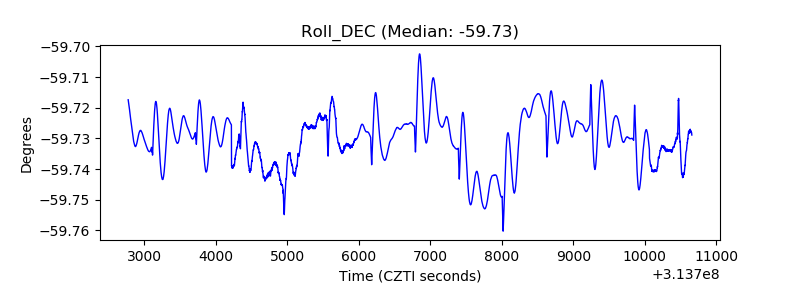 |
| _Roll_RA | 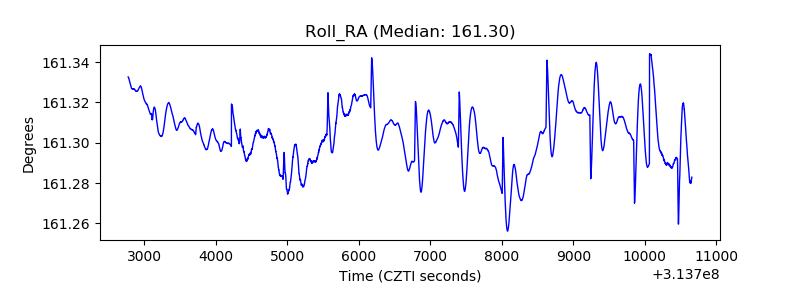 |
| Veto Counter | 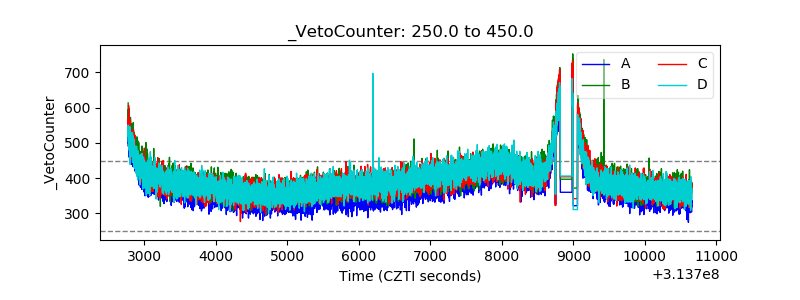 |