| Param | Original file | Final file |
|---|---|---|
| Filename | modeM0/AS1A08_007T01_9000003362_22720cztM0_level2.evt | modeM0/AS1A08_007T01_9000003362_22720cztM0_level2_quad_clean.evt |
| Size (bytes) | 780,036,480 | 153,498,240 |
| Size | 743.9 MB | 146.4 MB |
| Events in quadrant A | 5,264,399 | 982,894 |
| Events in quadrant B | 5,495,104 | 991,260 |
| Events in quadrant C | 5,375,146 | 948,675 |
| Events in quadrant D | 6,712,631 | 933,473 |
| Mode SS | |||
|---|---|---|---|
| Quadrant | BADHDUFLAG | Total packets | Discarded packets |
| A | 0 | 232 | 0 |
| B | 0 | 232 | 0 |
| C | 0 | 232 | 0 |
| D | 0 | 232 | 0 |
| Mode M0 | |||
|---|---|---|---|
| Quadrant | BADHDUFLAG | Total packets | Discarded packets |
| A | 0 | 23315 | 2 |
| B | 0 | 23761 | 2 |
| C | 0 | 23449 | 2 |
| D | 0 | 28030 | 2 |
| Mode M9 | |||
|---|---|---|---|
| Quadrant | BADHDUFLAG | Total packets | Discarded packets |
| A | 0 | 6 | 0 |
| B | 0 | 7 | 0 |
| C | 0 | 7 | 0 |
| D | 0 | 7 | 0 |
| Quadrant | Total seconds | Saturated seconds | Saturation percentage |
|---|---|---|---|
| A | 11461 | 44 | 0.383911% |
| B | 11460 | 73 | 0.636998% |
| C | 11460 | 97 | 0.846422% |
| D | 11460 | 267 | 2.329843% |
Noise dominated data is calculated using 1-second bins in cleaned event files. If a bin has >2000 counts, and if more than 50% of those come from <1% of pixels, then it is considered to be noise-dominated and hence unusable.
| Quadrant | # 1 sec bins | Bins with >0 counts | Bins with >2000 counts | High rate bins dominated by noise | Noise dominated (total time) | Noise dominated (detector-on time) | Marked lightcurve |
|---|---|---|---|---|---|---|---|
| A | 11986 | 11463 | 0 | 0 | 0.00% | 0.00% | 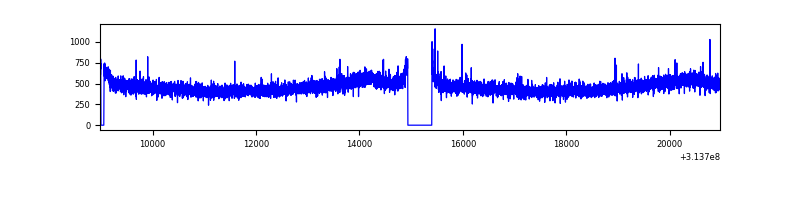 |
| B | 11985 | 11462 | 4 | 4 | 0.03% | 0.03% | 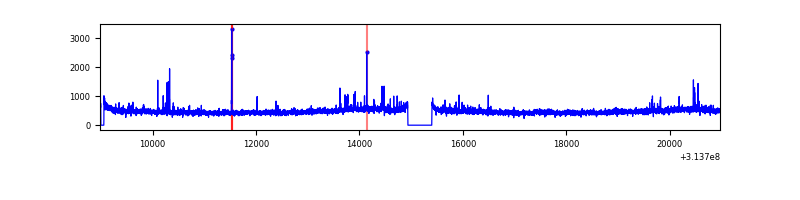 |
| C | 11985 | 11462 | 2 | 2 | 0.02% | 0.02% | 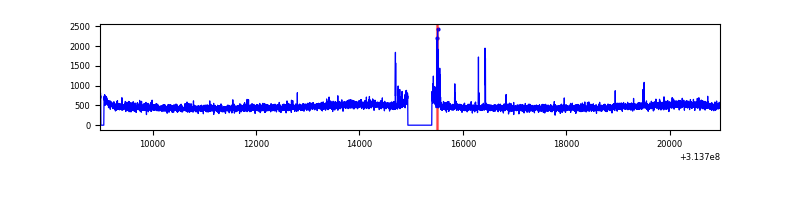 |
| D | 11985 | 11462 | 146 | 146 | 1.22% | 1.27% | 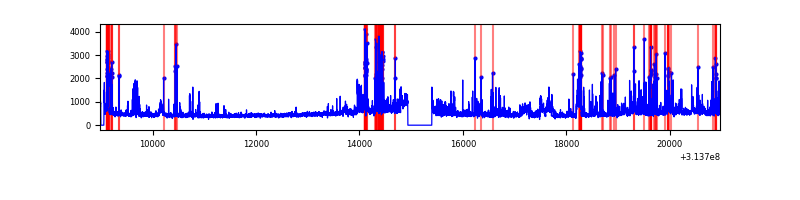 |
Top three noisy pixels from each quadrant. If the there are fewer than three noisy pixels in the level2.evt file, extra rows are filled as -1
| Pixel properties | Quadrant properties | ||||||
|---|---|---|---|---|---|---|---|
| Quadrant | DetID | PixID | Counts | Sigma | Mean | Median | Sigma |
| A | 13 | 254 | 21833 | 74.75 | 1360 | 1333 | 274.2 |
| A | 0 | 226 | 11754 | 38.0 | 1360 | 1333 | 274.2 |
| A | 3 | 1 | 11691 | 37.77 | 1360 | 1333 | 274.2 |
| B | 0 | 219 | 35312 | 134.06 | 1356 | 1322 | 253.5 |
| B | 0 | 190 | 34955 | 132.65 | 1356 | 1322 | 253.5 |
| B | 0 | 228 | 34702 | 131.66 | 1356 | 1322 | 253.5 |
| C | 14 | 238 | 203711 | 666.93 | 1303 | 1311 | 303.5 |
| C | 10 | 23 | 42285 | 135.01 | 1303 | 1311 | 303.5 |
| C | 10 | 22 | 33730 | 106.82 | 1303 | 1311 | 303.5 |
| D | 1 | 52 | 865566 | 2712.42 | 1313 | 1275 | 318.6 |
| D | 12 | 233 | 398534 | 1246.72 | 1313 | 1275 | 318.6 |
| D | 7 | 238 | 167391 | 521.32 | 1313 | 1275 | 318.6 |
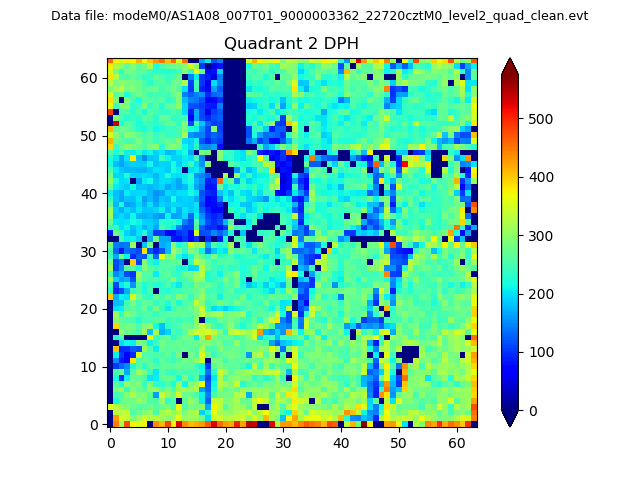
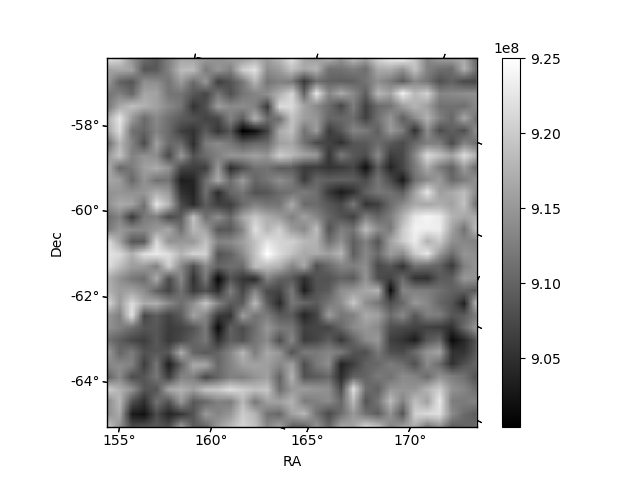
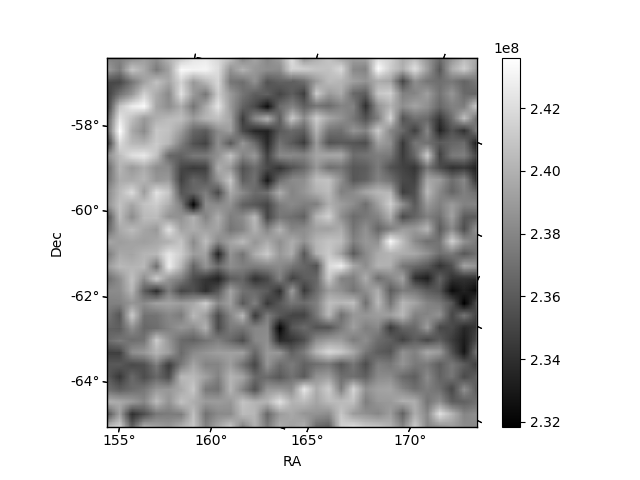
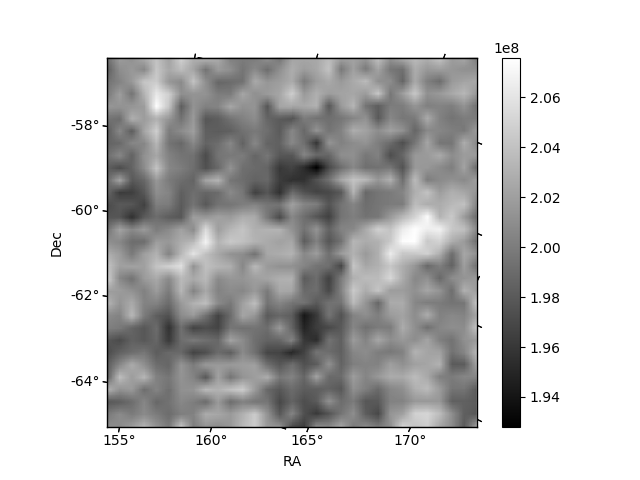
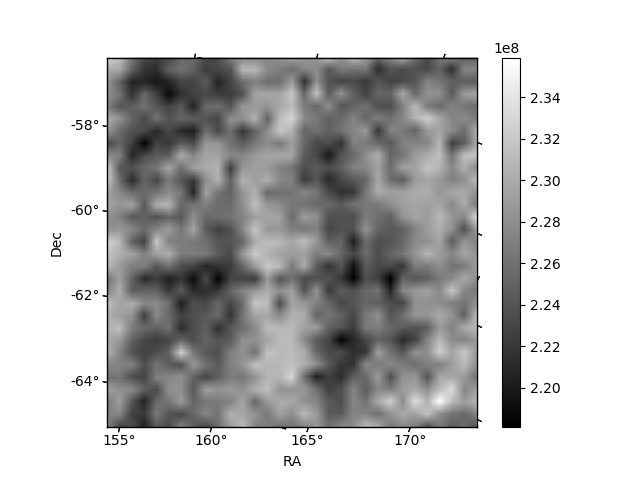
Histogram calculated using DETX and DETY for each event in the final _common_clean file
| Quadrant A | 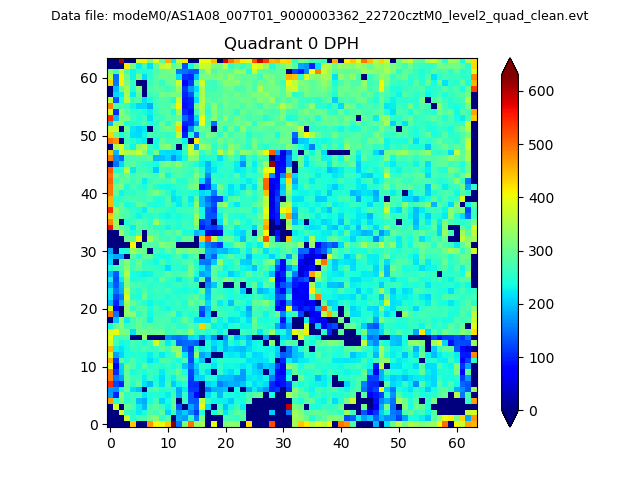 |
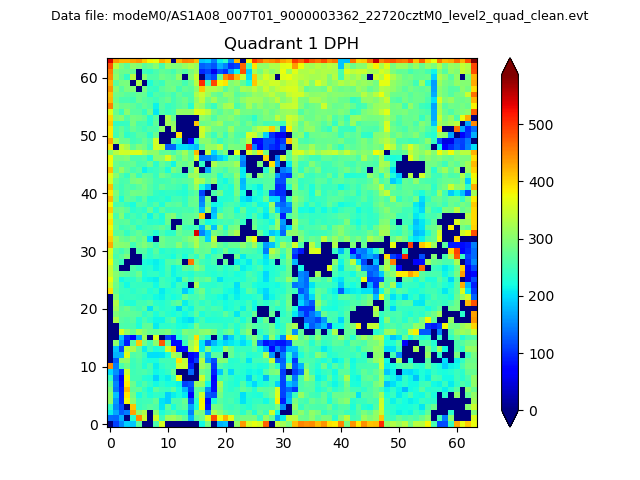 |
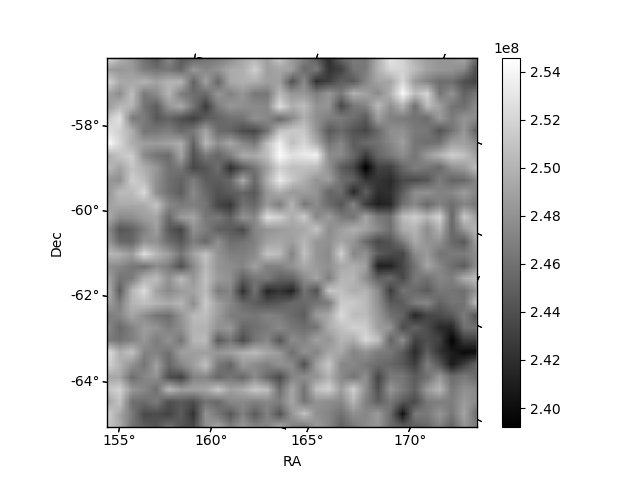
Quadrant B |
|---|---|---|---|
| Quadrant D | 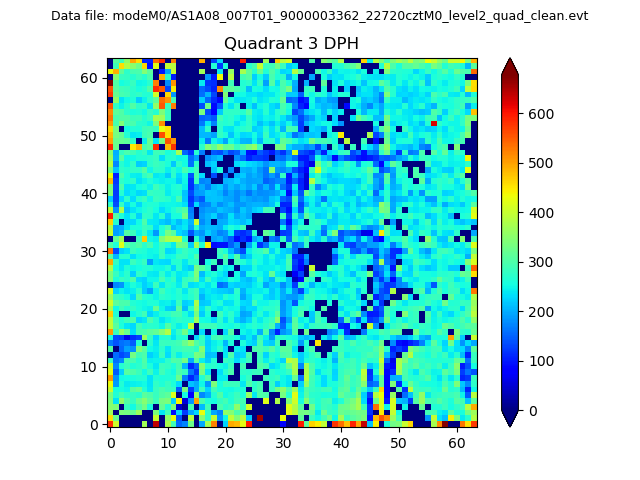 |
 |
Quadrant C |
| Plot type | Count rate plots | Images |
|---|---|---|
| Comparison with Poisson distribution Blue bars denote a histogram of data divided into 1 sec bins. Red curve is a Poisson curve with rate = median count rate of data. |
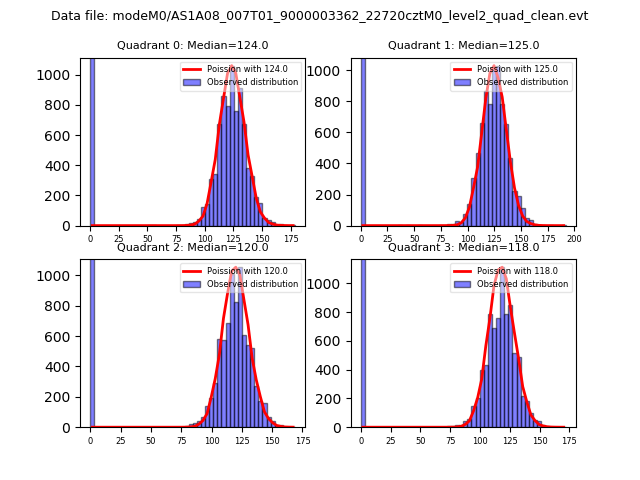 |
 |
| Quadrant-wise count rates Data is divided into 100 sec bins |
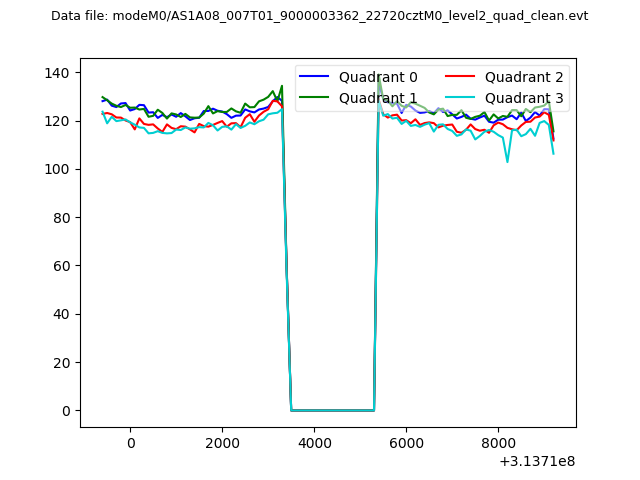 |
|
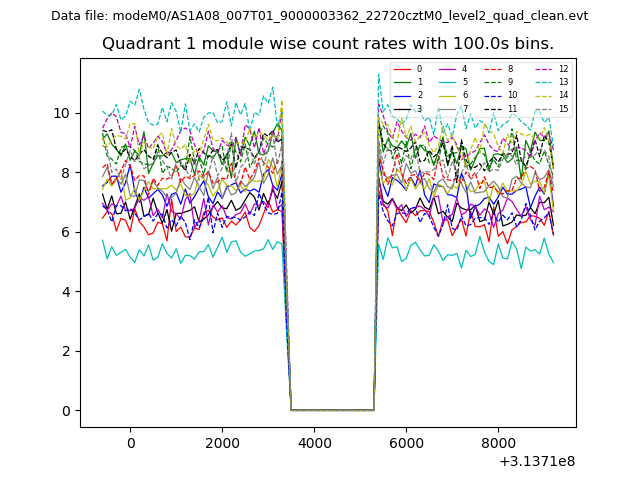
| Module-wise count rates for Quadrant A Data is divided into 100 sec bins |
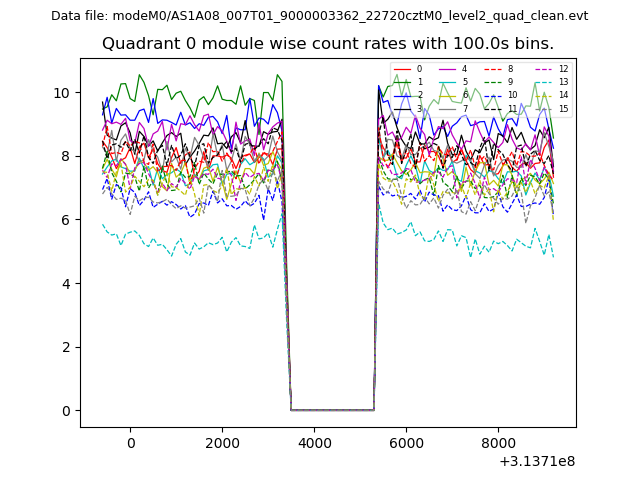 |
 |
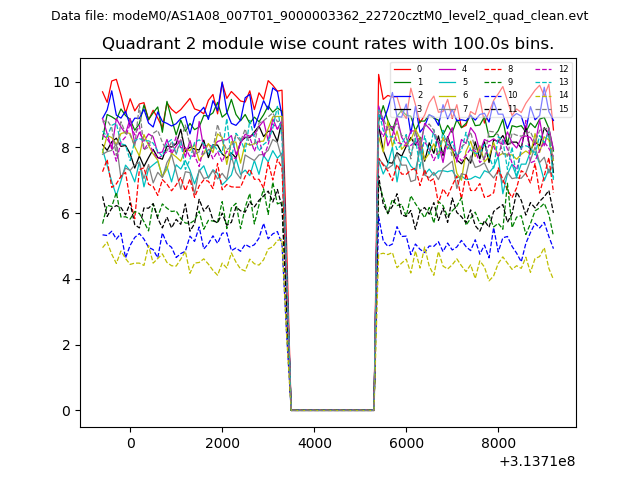
| Module-wise count rates for Quadrant B Data is divided into 100 sec bins |
 |
 |
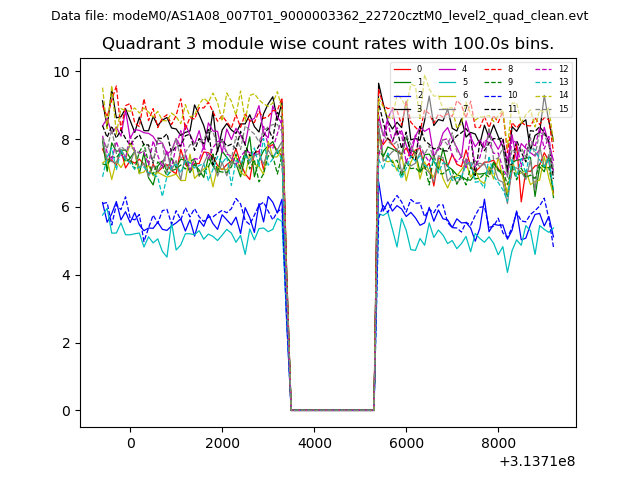
| Module-wise count rates for Quadrant C Data is divided into 100 sec bins |
 |
 |
| Module-wise count rates for Quadrant D Data is divided into 100 sec bins |
 |
 |
| Parameter | Plot |
|---|---|
| CZT HV Monitor | 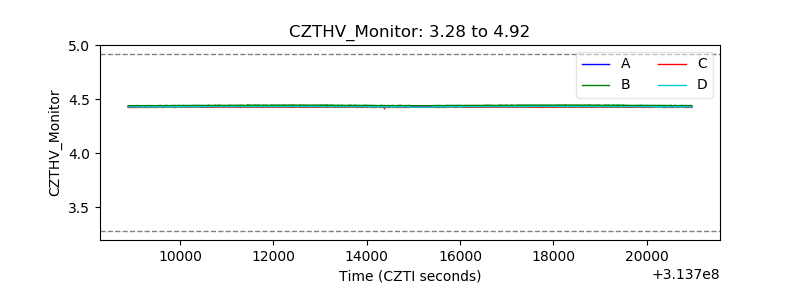 |
| D_VDD | 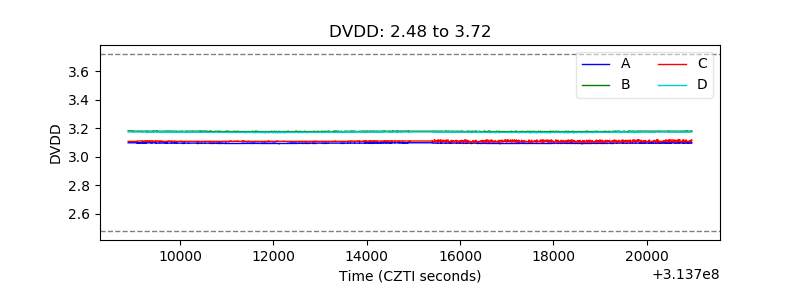 |
| Temperature 1 | 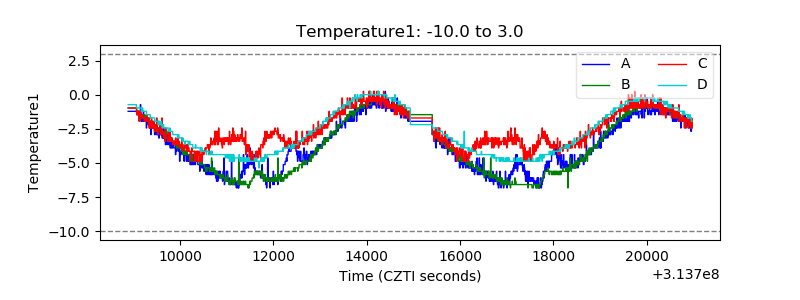 |
| Veto HV Monitor |  |
| Veto LLD | 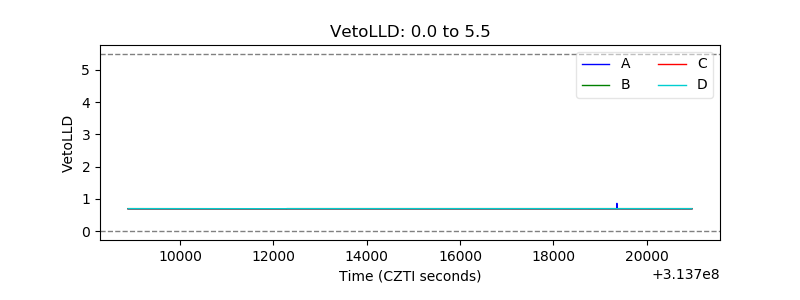 |
| Alpha Counter | 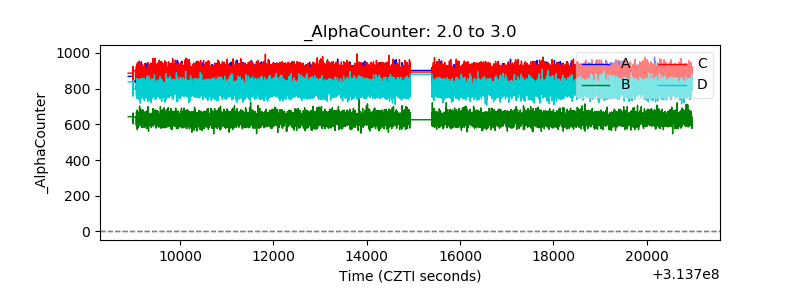 |
| _CPM_Rate | 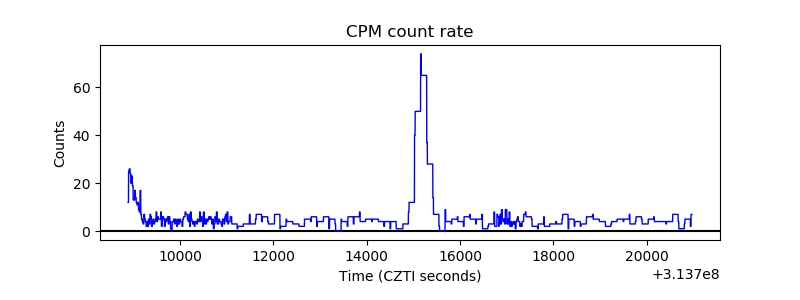 |
| CZT Counter | 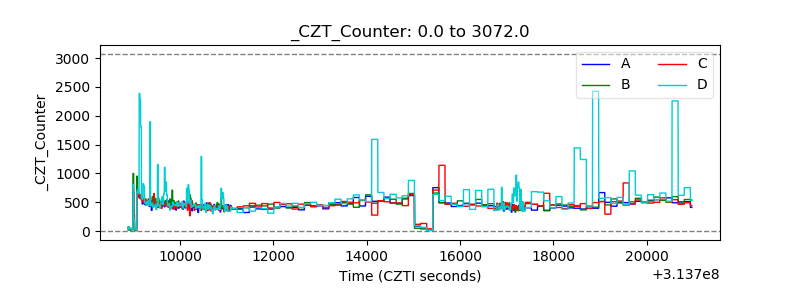 |
| +2.5 Volts monitor |  |
| +5 Volts monitor |  |
| _ROLL_ROT | 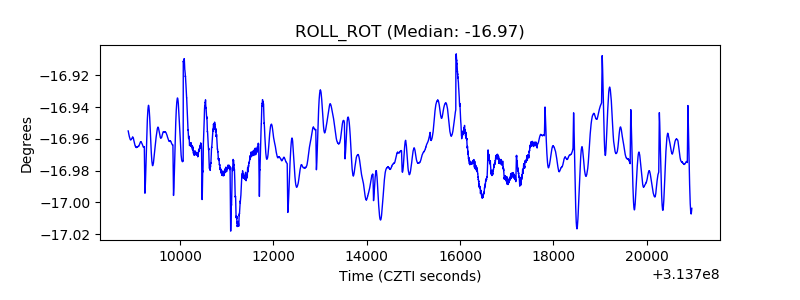 |
| _Roll_DEC | 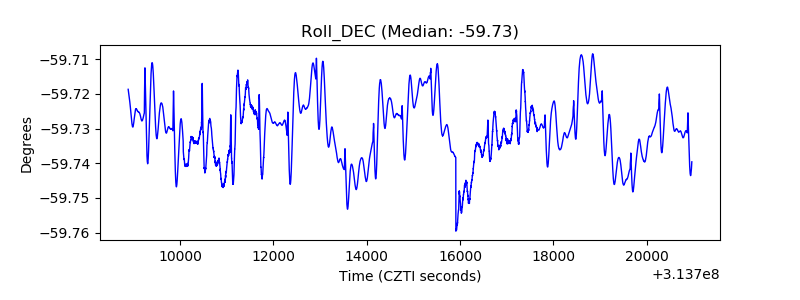 |
| _Roll_RA | 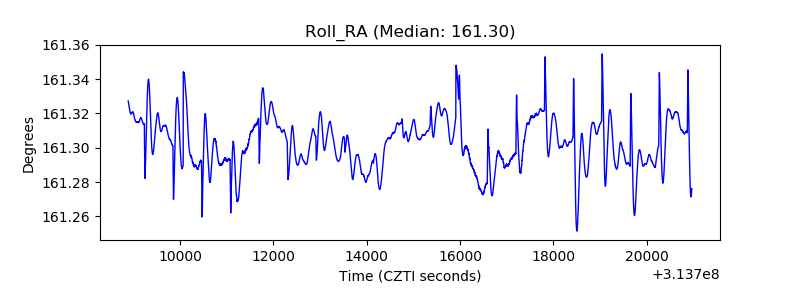 |
| Veto Counter | 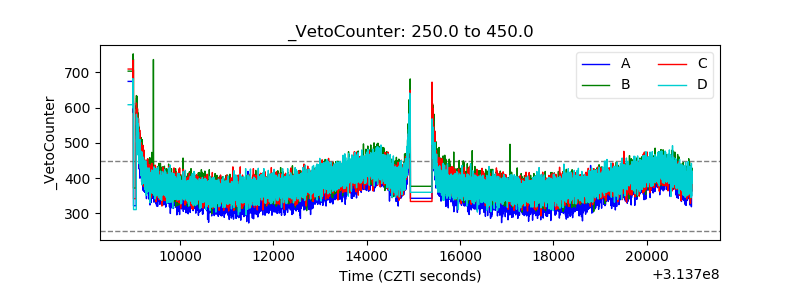 |