| Param | Original file | Final file |
|---|---|---|
| Filename | modeM0/AS1A08_007T01_9000003362_22723cztM0_level2.evt | modeM0/AS1A08_007T01_9000003362_22723cztM0_level2_quad_clean.evt |
| Size (bytes) | 415,028,160 | 94,294,080 |
| Size | 395.8 MB | 89.9 MB |
| Events in quadrant A | 2,929,550 | 620,898 |
| Events in quadrant B | 3,043,824 | 631,294 |
| Events in quadrant C | 3,093,316 | 606,402 |
| Events in quadrant D | 3,110,316 | 593,898 |
| Mode SS | |||
|---|---|---|---|
| Quadrant | BADHDUFLAG | Total packets | Discarded packets |
| A | 0 | 118 | 0 |
| B | 0 | 118 | 0 |
| C | 0 | 118 | 0 |
| D | 0 | 118 | 0 |
| Mode M0 | |||
|---|---|---|---|
| Quadrant | BADHDUFLAG | Total packets | Discarded packets |
| A | 0 | 12206 | 1 |
| B | 0 | 12553 | 1 |
| C | 0 | 12714 | 1 |
| D | 0 | 12815 | 1 |
| Mode M9 | |||
|---|---|---|---|
| Quadrant | BADHDUFLAG | Total packets | Discarded packets |
| A | 0 | 12 | 0 |
| B | 0 | 12 | 0 |
| C | 0 | 12 | 0 |
| D | 0 | 12 | 0 |
| Quadrant | Total seconds | Saturated seconds | Saturation percentage |
|---|---|---|---|
| A | 5765 | 23 | 0.398959% |
| B | 5764 | 37 | 0.641915% |
| C | 5764 | 88 | 1.526718% |
| D | 5765 | 52 | 0.901995% |
Noise dominated data is calculated using 1-second bins in cleaned event files. If a bin has >2000 counts, and if more than 50% of those come from <1% of pixels, then it is considered to be noise-dominated and hence unusable.
| Quadrant | # 1 sec bins | Bins with >0 counts | Bins with >2000 counts | High rate bins dominated by noise | Noise dominated (total time) | Noise dominated (detector-on time) | Marked lightcurve |
|---|---|---|---|---|---|---|---|
| A | 7010 | 5766 | 0 | 0 | 0.00% | 0.00% | 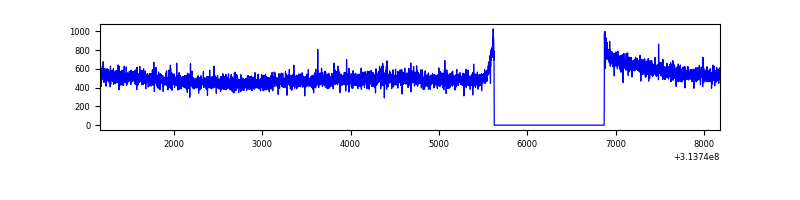 |
| B | 7009 | 5765 | 8 | 8 | 0.11% | 0.14% | 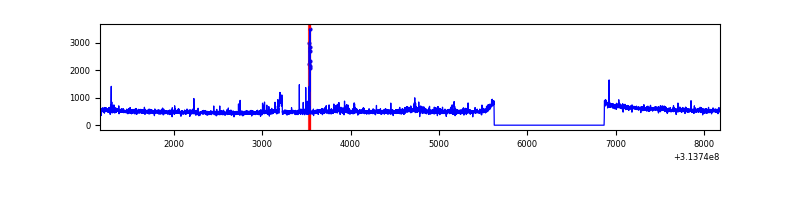 |
| C | 7009 | 5765 | 16 | 16 | 0.23% | 0.28% |  |
| D | 7010 | 5766 | 16 | 16 | 0.23% | 0.28% | 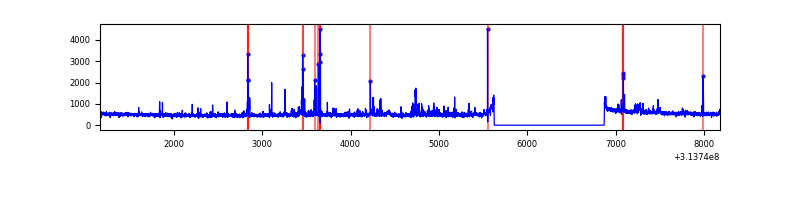 |
Top three noisy pixels from each quadrant. If the there are fewer than three noisy pixels in the level2.evt file, extra rows are filled as -1
| Pixel properties | Quadrant properties | ||||||
|---|---|---|---|---|---|---|---|
| Quadrant | DetID | PixID | Counts | Sigma | Mean | Median | Sigma |
| A | 13 | 254 | 9860 | 60.83 | 756 | 742 | 149.9 |
| A | 0 | 23 | 7290 | 43.68 | 756 | 742 | 149.9 |
| A | 0 | 226 | 7138 | 42.67 | 756 | 742 | 149.9 |
| B | 0 | 228 | 52958 | 377.76 | 747 | 729 | 138.3 |
| B | 0 | 190 | 41176 | 292.54 | 747 | 729 | 138.3 |
| B | 0 | 245 | 16598 | 114.78 | 747 | 729 | 138.3 |
| C | 14 | 238 | 116197 | 679.36 | 734 | 739 | 170.0 |
| C | 9 | 54 | 66864 | 389.08 | 734 | 739 | 170.0 |
| C | 10 | 22 | 27624 | 158.19 | 734 | 739 | 170.0 |
| D | 1 | 52 | 123360 | 681.96 | 746 | 726 | 179.8 |
| D | 12 | 233 | 46165 | 252.68 | 746 | 726 | 179.8 |
| D | 7 | 238 | 44258 | 242.08 | 746 | 726 | 179.8 |
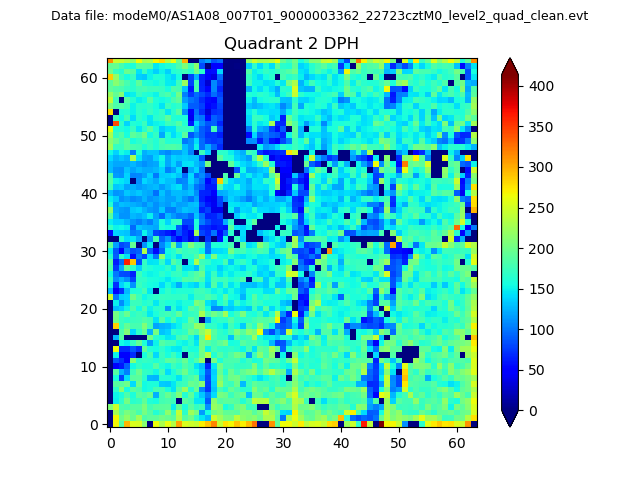
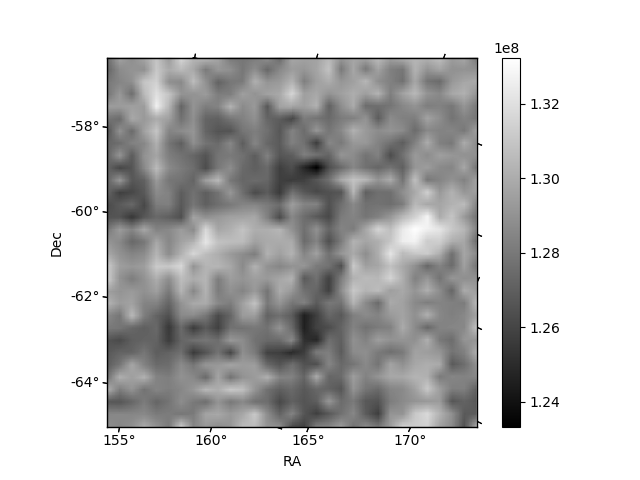
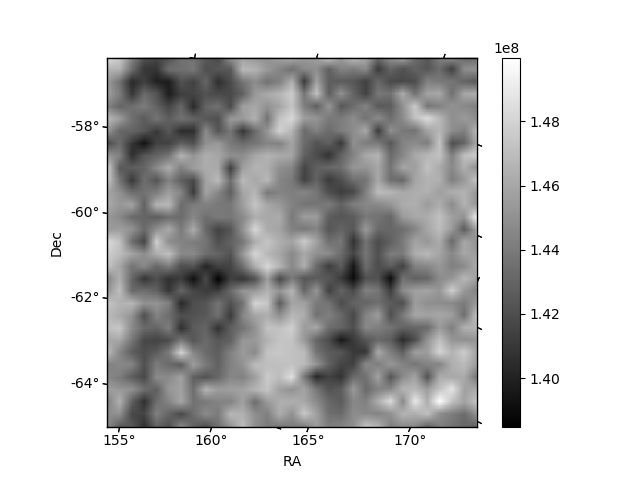
Histogram calculated using DETX and DETY for each event in the final _common_clean file
| Quadrant A | 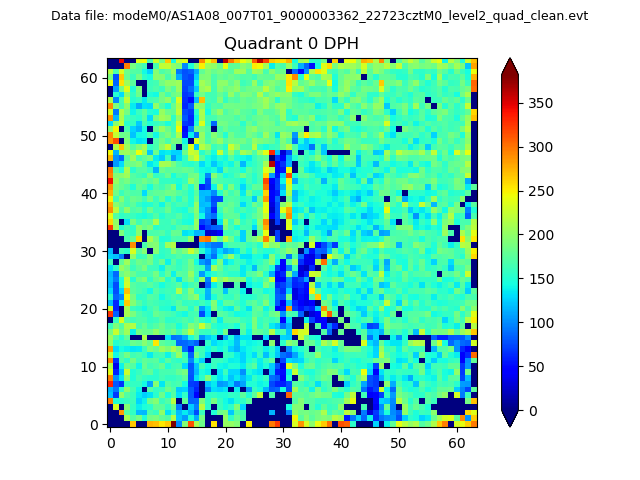 |
 |
Quadrant B |
|---|---|---|---|
| Quadrant D |  |
 |
Quadrant C |
| Plot type | Count rate plots | Images |
|---|---|---|
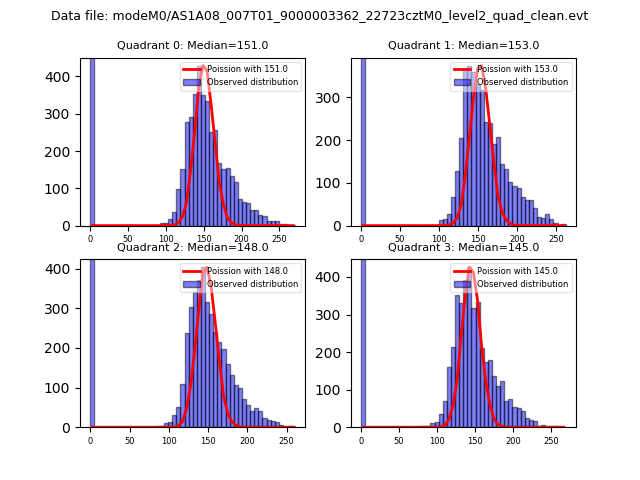
| Comparison with Poisson distribution Blue bars denote a histogram of data divided into 1 sec bins. Red curve is a Poisson curve with rate = median count rate of data. |
 |
 |
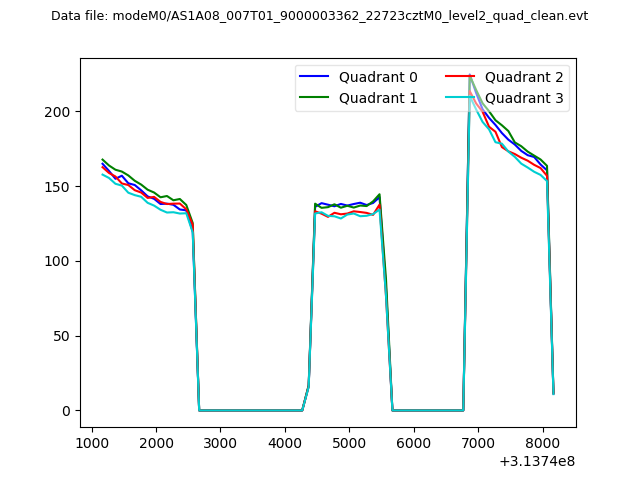
| Quadrant-wise count rates Data is divided into 100 sec bins |
 |
|
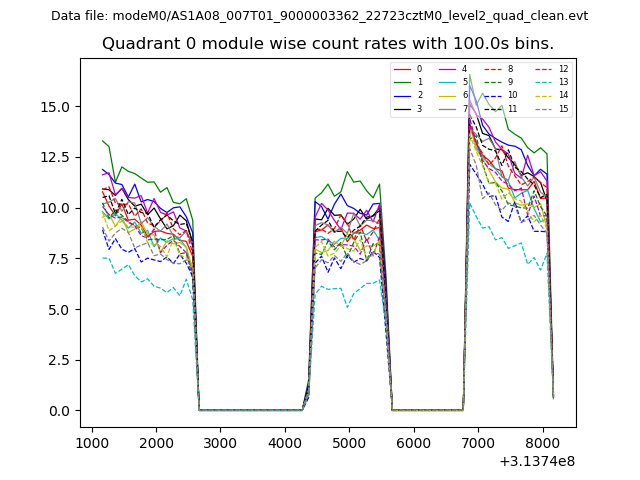
| Module-wise count rates for Quadrant A Data is divided into 100 sec bins |
 |
 |
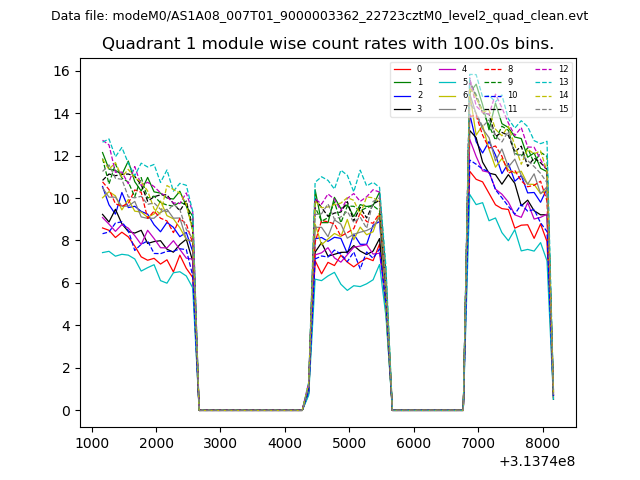
| Module-wise count rates for Quadrant B Data is divided into 100 sec bins |
 |
 |
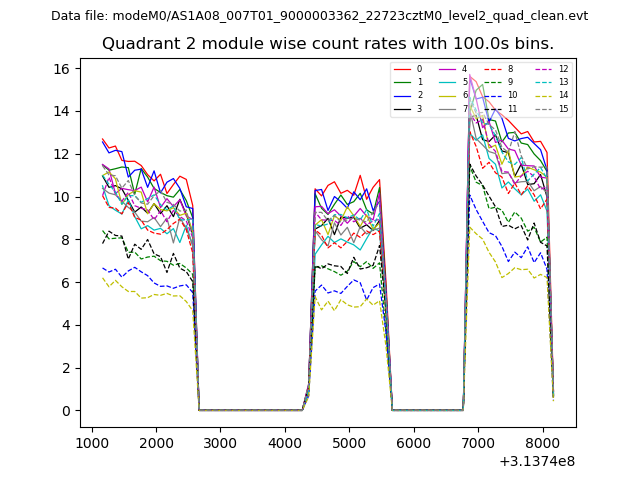
| Module-wise count rates for Quadrant C Data is divided into 100 sec bins |
 |
 |
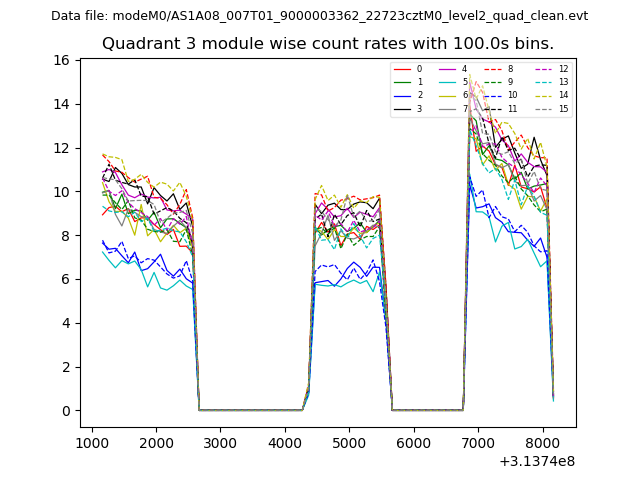
| Module-wise count rates for Quadrant D Data is divided into 100 sec bins |
 |
 |
| Parameter | Plot |
|---|---|
| CZT HV Monitor | 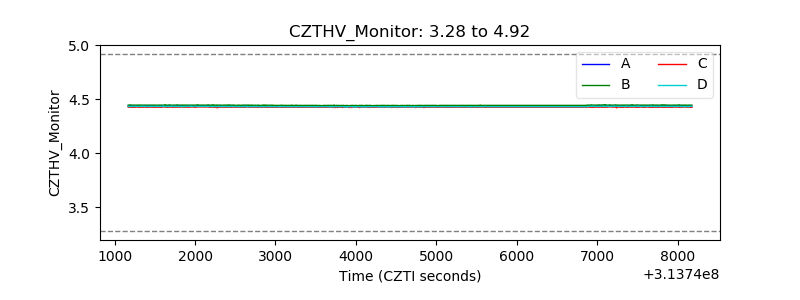 |
| D_VDD | 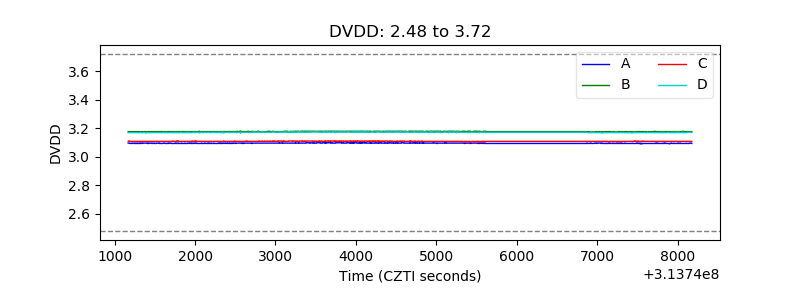 |
| Temperature 1 | 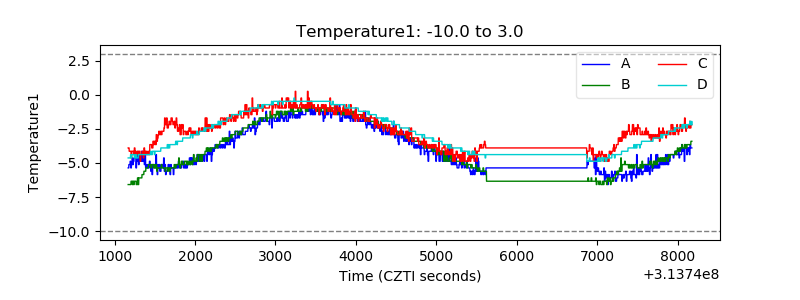 |
| Veto HV Monitor | 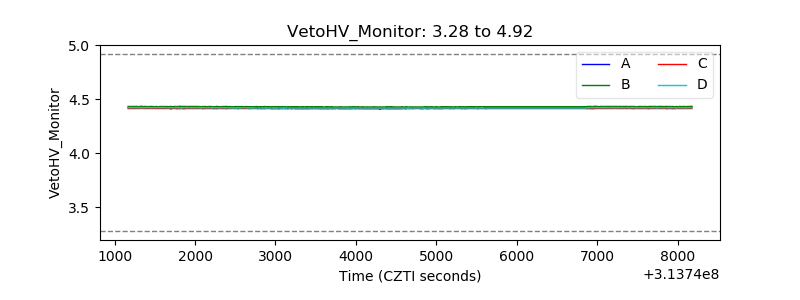 |
| Veto LLD | 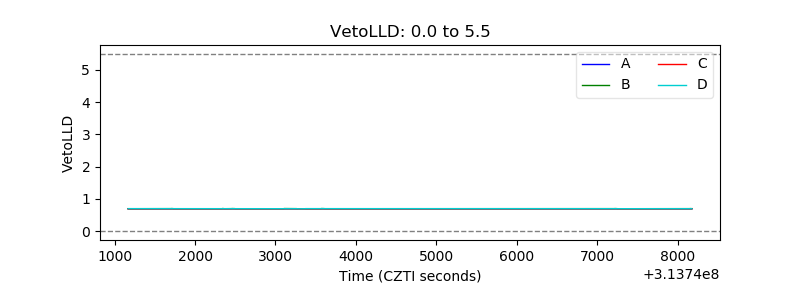 |
| Alpha Counter | 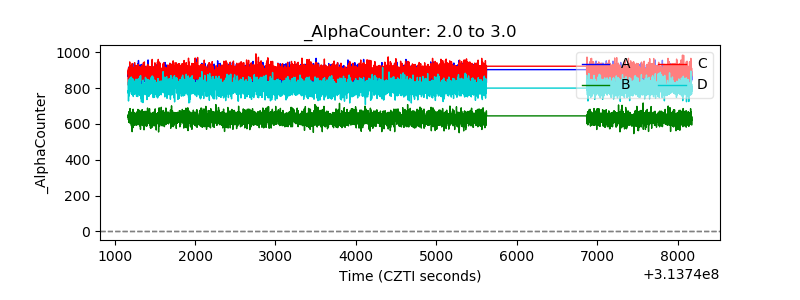 |
| _CPM_Rate | 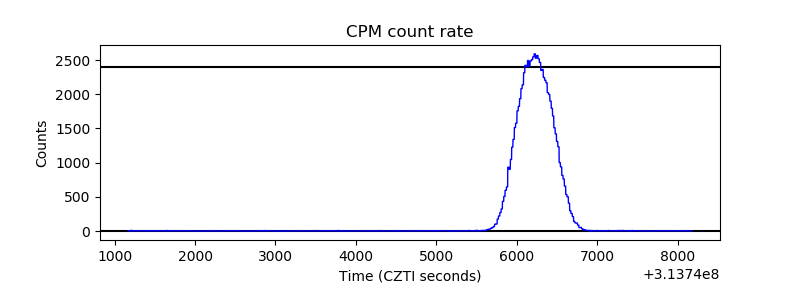 |
| CZT Counter | 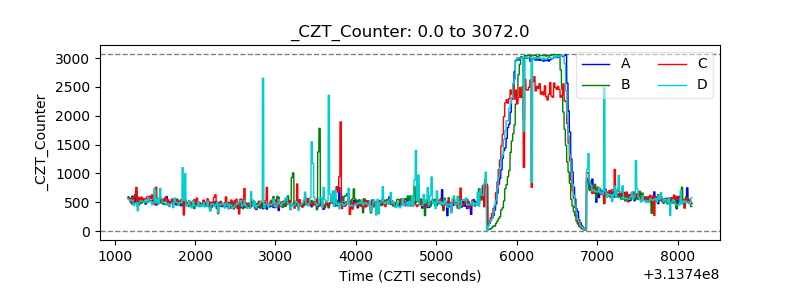 |
| +2.5 Volts monitor |  |
| +5 Volts monitor | 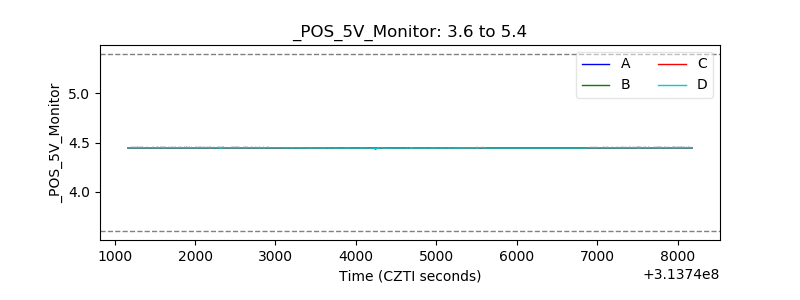 |
| _ROLL_ROT | 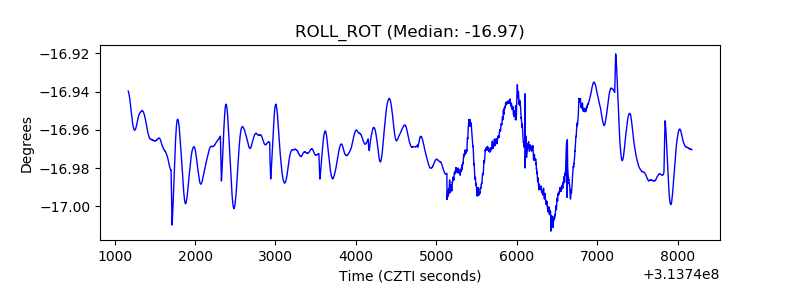 |
| _Roll_DEC | 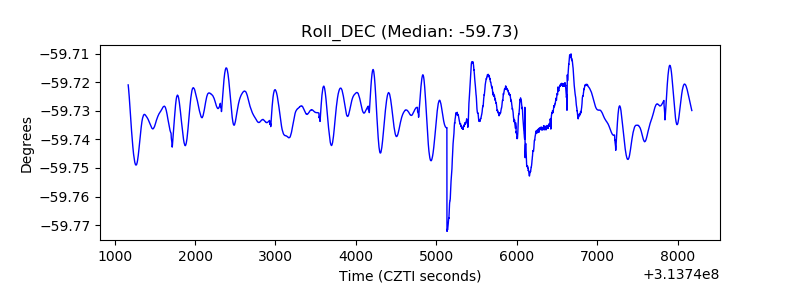 |
| _Roll_RA | 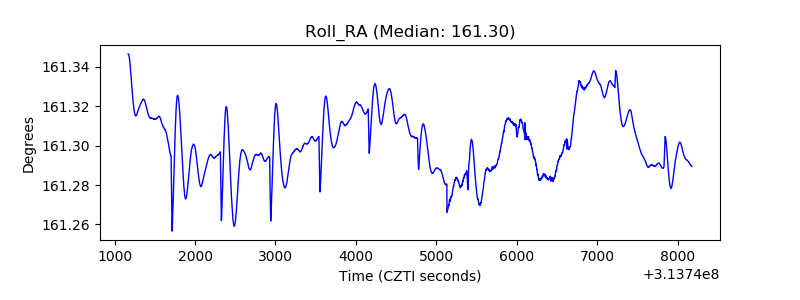 |
| Veto Counter | 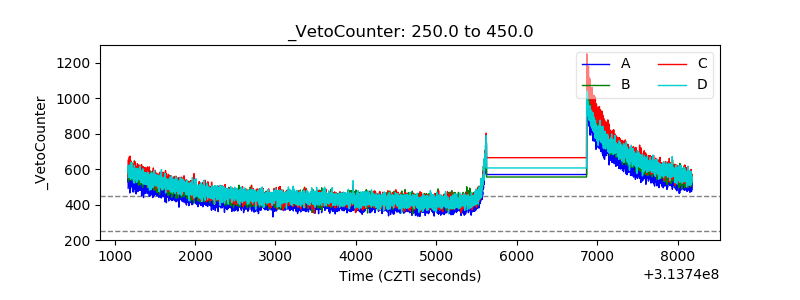 |